Traces
The traces page shows a summary of your application's traces for a given period. A trace captures methods, requests, queries, and external API calls so you can troubleshoot performance issues and get detailed insight into how your application is performing.
Getting started
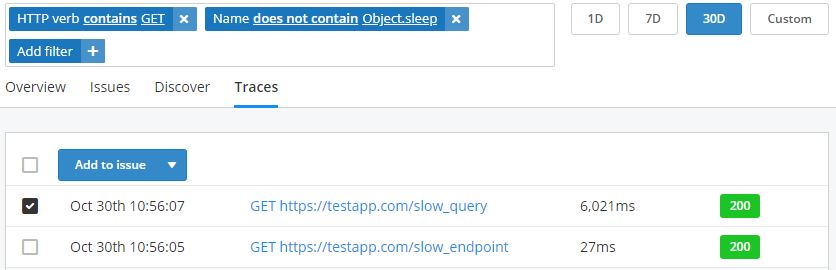
Traces can be filtered and sorted by duration, name, and status using the header row of the table.
Select one or more traces and click the "Add to issue" button to manually add traces to an issue.
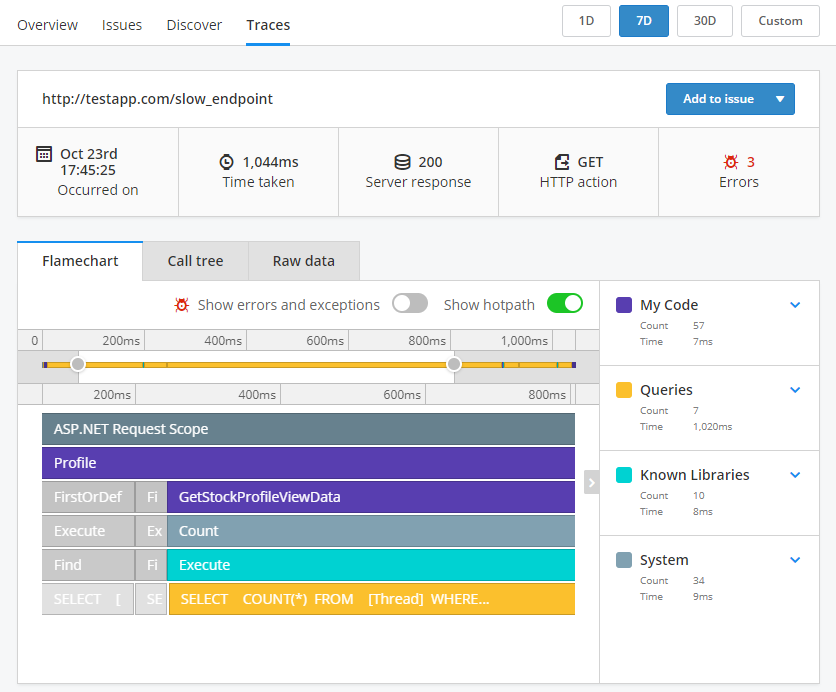
Flame chart
Click on a trace name to view a trace on the flame chart. This shows the state of the stack at every millisecond during the performance profile, how long each segment ran for, and where it was called from.
Use the mouse scroll wheel or adjust the two points on each end of the timeline chart to zoom in and out of the flame chart.
Click the "show hot path" toggle to view the hot path of a trace. This changes the colors of the flame chart to show the series of calls which made up the majority of the total time taken.
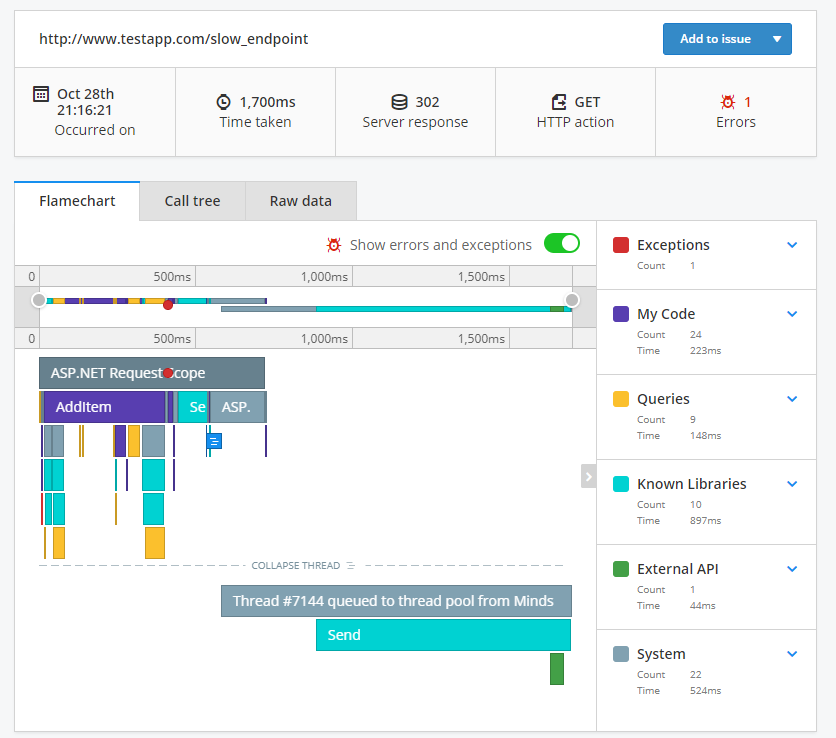
Multithreaded traces
Multithreaded traces are shown collapsed under the primary thread. Click on "Expand thread" to open the thread, click it again to collapse the thread.
Each thread of execution is shown in the time range bar at the top of the flame chart. Threads are transparent when collapsed and colored when expanded.
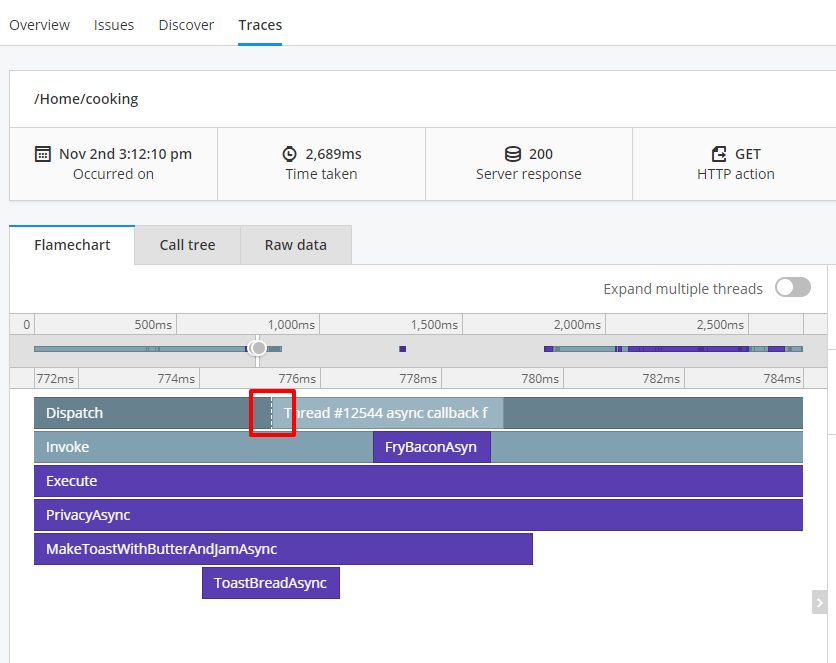
Async/await multithreading - .NET and .NET Core
Traces made up of only async/await code without any points of overlapping execution will display as a single thread. This reflects that code written in an async/await style is conceptually a single thread of execution.
When system code is being overlapped by other system code execution a dashed line will be inserted at the overlapping point. Click the "Expand threads" toggle to see each thread of execution represented as a distinct thread.
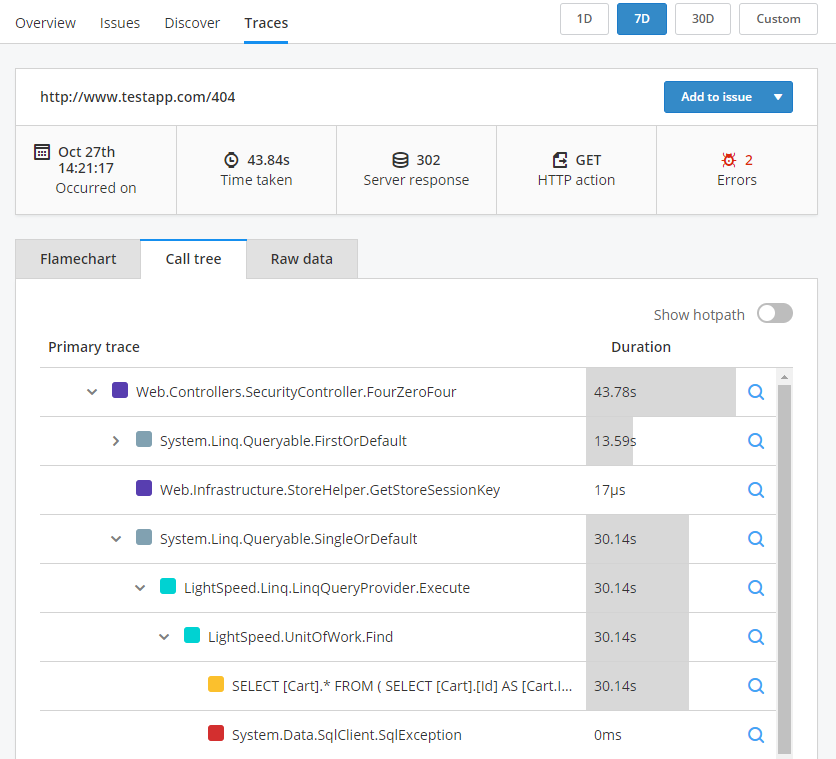
Call tree
The call tree shows where your application is spending the most time in aggregate. Click the parent name to expand and view details about its child traces.
To learn about a specific call click the magnifying glass icon on the right hand side to display execution time, parent %, and if it is in the hotpath.
Raw data
The raw data tab shows the raw trace data which can be downloaded as a JSON file.
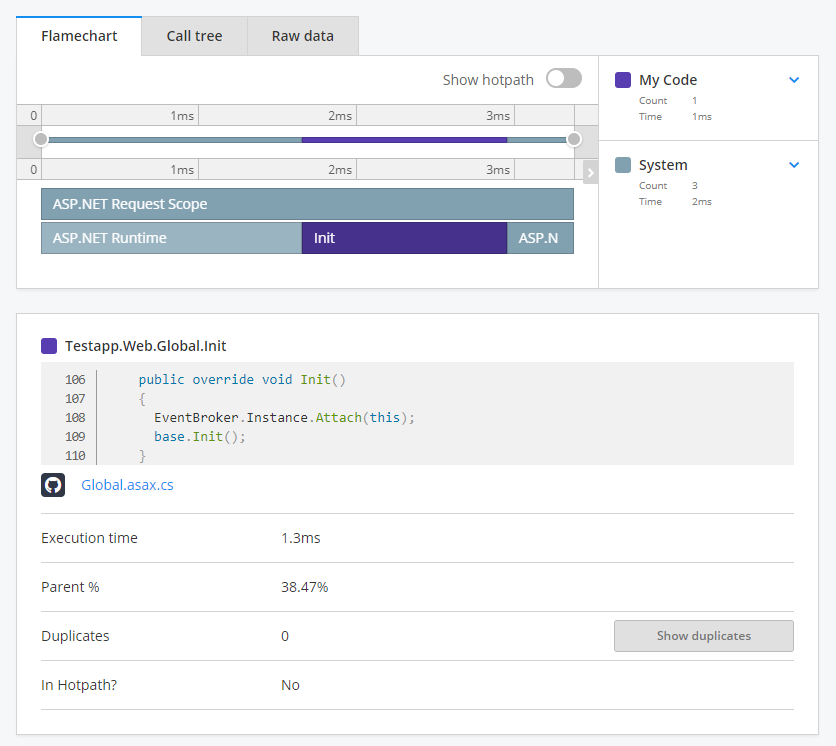
Link to source
With the link to source feature enabled your code will be displayed in the details section of the trace detail page. Click on a colored block on the flame chart or the magnifying glass icon from the call tree tab to display the line of code from your repository.