Windows
Experiencing high CPU
When restarting the application, there is an overhead that could cause the CPU to spike, but this high usage shouldn't persist. APM products will always have an overhead, but our goal is to ensure it's the lowest overhead possible.
The high CPU usage you're experiencing is likely caused by a high method call count. We recommend setting up code filtering for a selection of high count method calls and seeing if this improves the CPU usage.
If this issue persists, please reach out to our engineering support team via the contact page, or click contact us in the app.
No traces in the Raygun UI
What if everything is set up, but there are no traces in the Raygun UI? Try following the steps below to resolve common issues with receiving traces.
Run status checks
Run some basic status checks by loading the Raygun Profiler Configuration tool and switching to the "Help" tab (it can be found at %ProgramFiles(x86)%\Raygun\RaygunAgent\RaygunConfigurationUtil.exe or by searching "Raygun" in the start menu).
The basic status checks will automatically run and will display a traffic light for each check. Ensure that all status checks are showing green.
Alternatively, you can run these same status checks using the CLI tool.
Running rgc.exe -status will produce a result that should look similar to:
Running Raygun Agent status checks...
Agent status: Registered
Agent test: Connected to the Raygun Agent v1.0.0.0 on port 2790.
API test: Connected to the Raygun API at https://api2.raygun.com.
TLS test: TLS 1.2 is supported on this machine.
API key test: API key ***lIOlZs5L4Y31PwiC2UZiWA*** is valid
Profiler x86 test: 32-bit .NET Profiler found at C:\Program Files (x86)\Raygun\RaygunProfiler\latest\x86\RaygunProfiler.dll.
Profiler x64 test: 64-bit .NET Profiler found at C:\Program Files\Raygun\RaygunProfiler\latest\x64\RaygunProfiler.dll.
Troubleshooting failed status checks
When using the Configuration Util, you may see some status checks that are not green.
If any traffic lights are red, you will receive a message describing the problem. Here are some actions you can perform to resolve problems:
- Check that the Raygun Agent is running. It should be running as a service on your machine called "Raygun Agent". If the application you are profiling is on a separate machine from the agent, check that traffic is allowed on port 2790.
- Check that the machine running the Raygun Agent can access the Raygun API at https://api2.raygun.com/healthcheck, either using your browser or the
cURLcommand. If you're using a browser, look for a 200 response in the network tab of the browser's developer tools. - Check that your firewall is not blocking Raygun.
- Check that the API key is correct. If you haven't sent any traces yet, your API key is displayed at the top of the instructions page for your new application. Otherwise, you can find the key under "Application settings" in the menu on the Raygun dashboard. Ensure that this is the same key that you used when you registered your process in the Raygun Profiler Configuration tool. You can verify this by selecting your process and clicking "Edit":
![]()
All status checks are now green, nice! Traces should come to us shortly.
If you are still not receiving traces, you will need to run the profiler test and send us a diagnostic session as described below:
Run a profiler test
The Raygun Profiler Configuration tool runs a test that will validate that a local test application can be executed and profiled. When this test is run the CLI tool is run in test mode and profiled. If the test is successful, a single trace will be sent to your Raygun application with a name of "Mindscape.Raygun.Agent.Cli.Program.Main".
To run this test, open the Raygun Profiler Configuration tool, click on the "Help" tab and click on the "Run a profiler test" button.
If profiler test fails, please contact us with the resulting error message for further assistance.
Profiler test succeeded? Great! After a few minutes you should receive a test trace in you Raygun account.
To provide us with more information about the issue, please enable detailed logging and send us a diagnostic session as described below:
Register an app with debug mode enabled
- Deregister your application.
- Locate rgc.exe in the Raygun installation directory.
- Run
rgc.exe -enable <raygun.com.apppool> -type IIS -apikey <APP-API-KEY> -startup 0 -debugmode
- The application will be profiled in debug mode. This step is required to maximize details that are sent to us in the diagnostics session.
Run a diagnostic session
Before running a diagnostic session, please enable debug mode for your application using the CLI. We also recommend that you deregister all applications other than the one you're wanting to capture the diagnostic information for.
Running a diagnostics session will capture the following information and will help us troubleshoot issues you're having:
- Snapshot of log files
- Snapshot of agent settings
- Agent log files with Log level of Debug automatically set
- Trace package and source files generated during the session
- A trace of data being sent from the profiler to the agent
- Profiler log messages (only captured if debug mode is enabled)
Using the Configuration Tool UI (Windows only)
- Start Raygun Configuration Tool and open Help tab.
- Click Start diagnostic session button
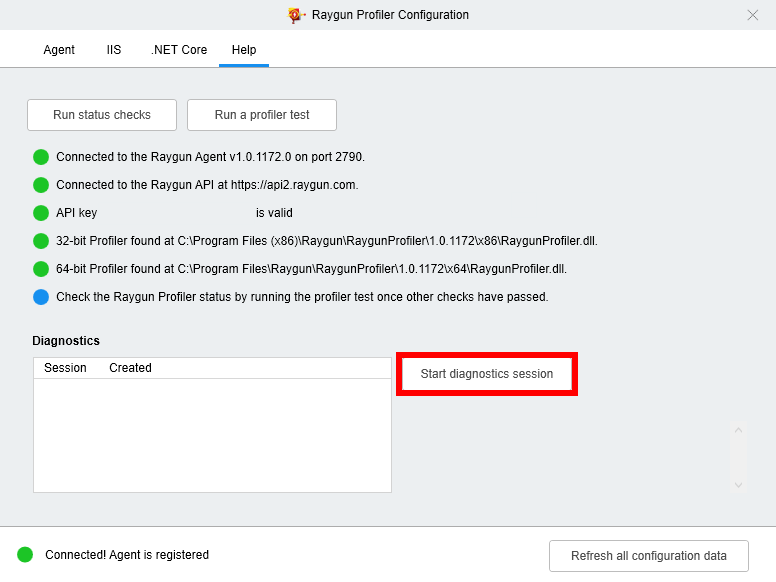
- Make a few requests to the application having issues
- Click Complete diagnostic session button
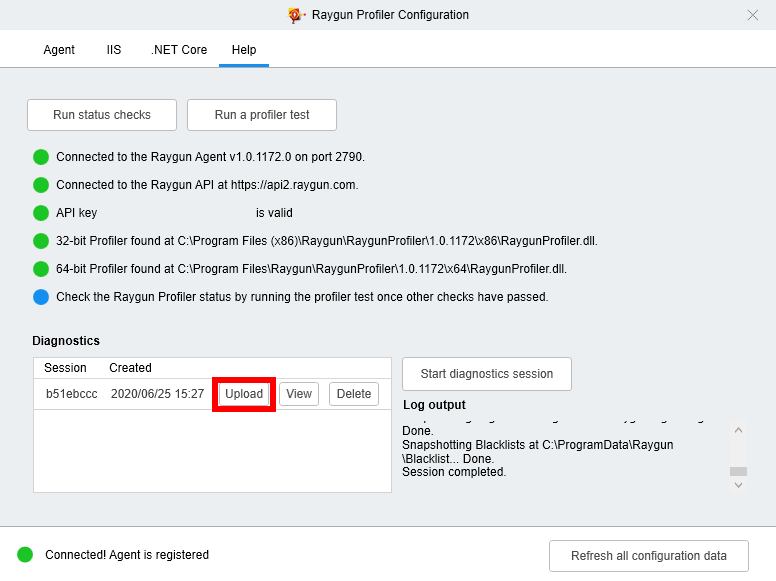
- The session should now appear in the list to the left. Click Upload button. The session will be sent to us.
Using the CLI
Start a diagnostics session, which will be uploaded to Raygun when complete
rgc.exe -auto-diagnostic 300
For more information on diagnostic command options, see the CLI documentation.
Contact us
If you're still experiencing issues or have any questions, please contact us.
Please provide as much information as possible, for example:
- The diagnostic session identifier
- Hosting type - cloud, on premise, Azure App Service etc
- OS Version, 32 or 64 bit
- Web Server (i.e., IIS or Node) version
- Framework type (i.e., .NET Framework, .NET, node.js, or Rails)
- Framework version
- For .NET under IIS - InProcess or OutOfProcess hosting type