Users
The ‘Users’ tab provides metrics to show how your users are interacting with your application. See trends in new and returning users, view the percentage of crash-free users, understand user satisfaction and more.
Metrics
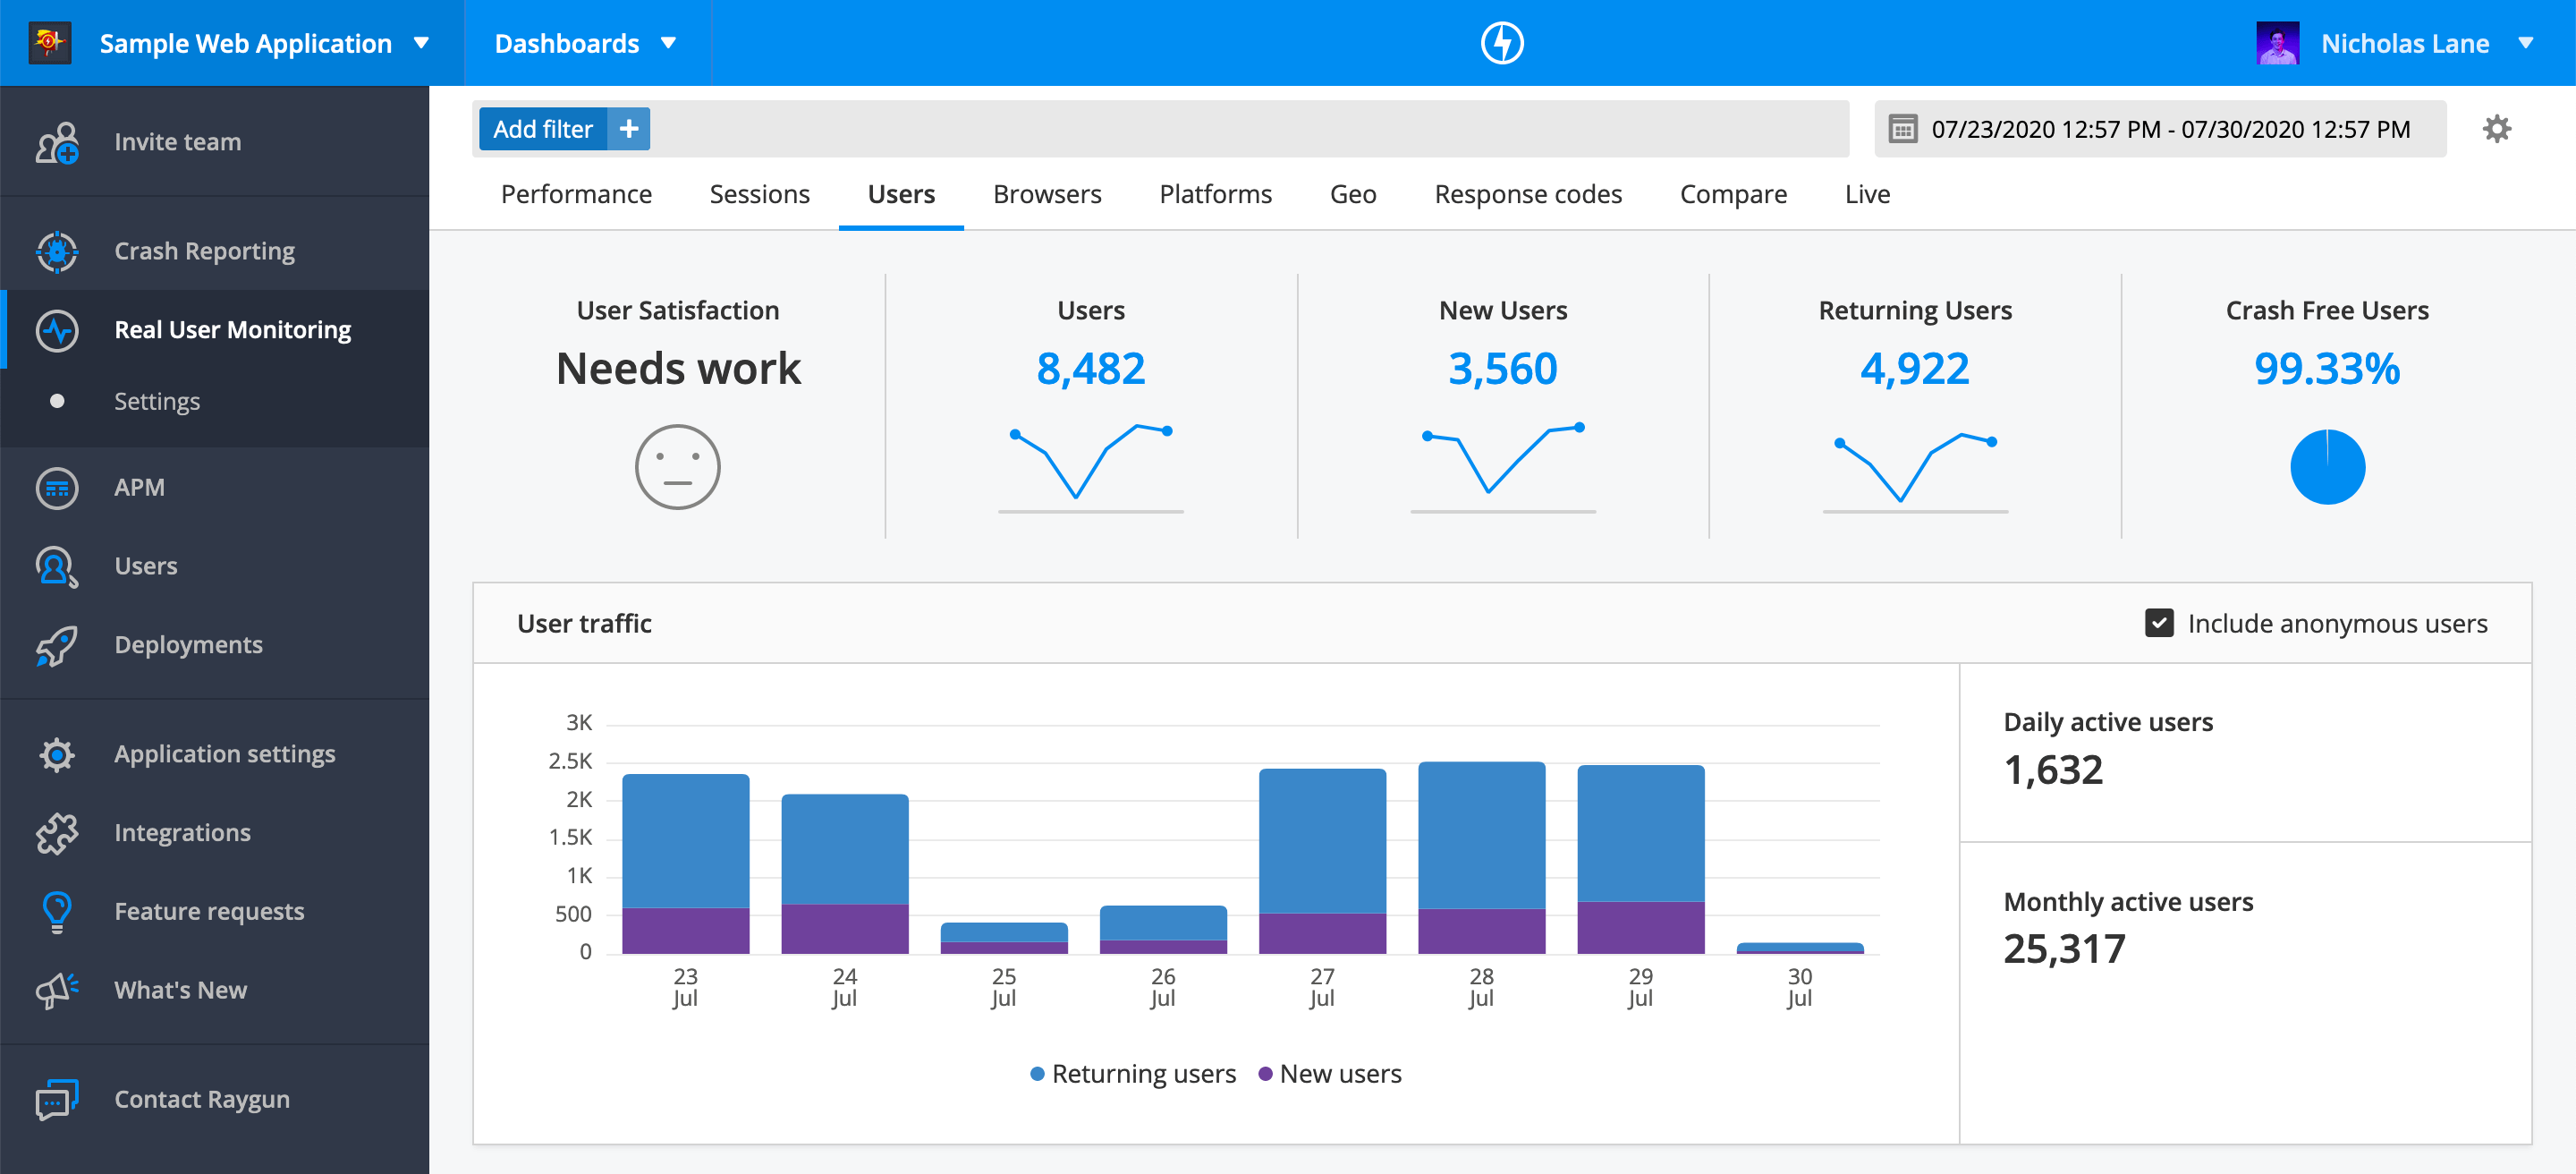
The Users tab displays key metrics from a specified date range to give an overview of usage across your application.
- Users: total number of unique users
- New users: total number of unique new users
- Returning users: total number of unique returning users
note: All metrics include anonymous and identified users, unless filters are applied.
Crash-free users
To resolve the errors that have the greatest impact on user experience, monitor the crash-free users score in conjunction with Crash Reporting. This metric is calculated based on users impacted by any kind of errors which includes any exceptions, unhandled exceptions, or any other errors that are sent to Raygun Crash Reporting.
note: To see the crash-free Users percentage you'll need both RUM and Crash Reporting to be set up in the same application.
We recommend setting a benchmark around this metric to ensure as few users as possible are encountering errors. You can use the date picker to see how this metric is changing over time.
The crash-free users percentage doesn't denote the severity of the errors that have occurred in your application. We also recommend actively monitoring Crash Reporting as part of your workflow around this metric. This allows you to determine the severity of errors so you're not missing a critical error affecting a small number of users.
For example, you could have a 500 error that is only affecting 1% of your users. This error is more detrimental to the overall user experience than a script error, that wasn't visible to the user, but is affecting 10% of users.
Using filters with crash-free users
Filters are a powerful way to understand how the crash-free users percentage varies for different segments of your users.
- Operating system
- Versions
- Tags
- Browser
Crash-free users uses data from Crash Reporting and RUM. RUM specific filters will not be applied to this metric
For example, you could use Tags to filter out exceptions that were unhandled, which would allow you to narrow down the set of users that were severely impacted.
User satisfaction
User satisfaction provides insight into the user experience with your application based on load time.
- Excellent: average load time is under 1000ms
- Needs work: average load time is between 1000ms and 4000ms
- Poor: average load time is over 4000ms
The user satisfaction over time graph measures how user satisfaction is trending based on the number of users that fell into each category of user satisfaction.
Improving the load time of the most viewed pages your application is the best way to improve the user satisfaction score.
User traffic
The user traffic graph shows the trend in total user count, split between new and returning users.
You can also see Daily active users and Monthly active users numbers for the date range next to the graph.
To include/exclude anonymous users from these data points, click the checkbox on the upper right corner.
Users tables
There are two tables on the Users section to help you understand users in your application:
- New users: count of new users in the time range.
- Active users: count of active users in your application, sorted by session count.
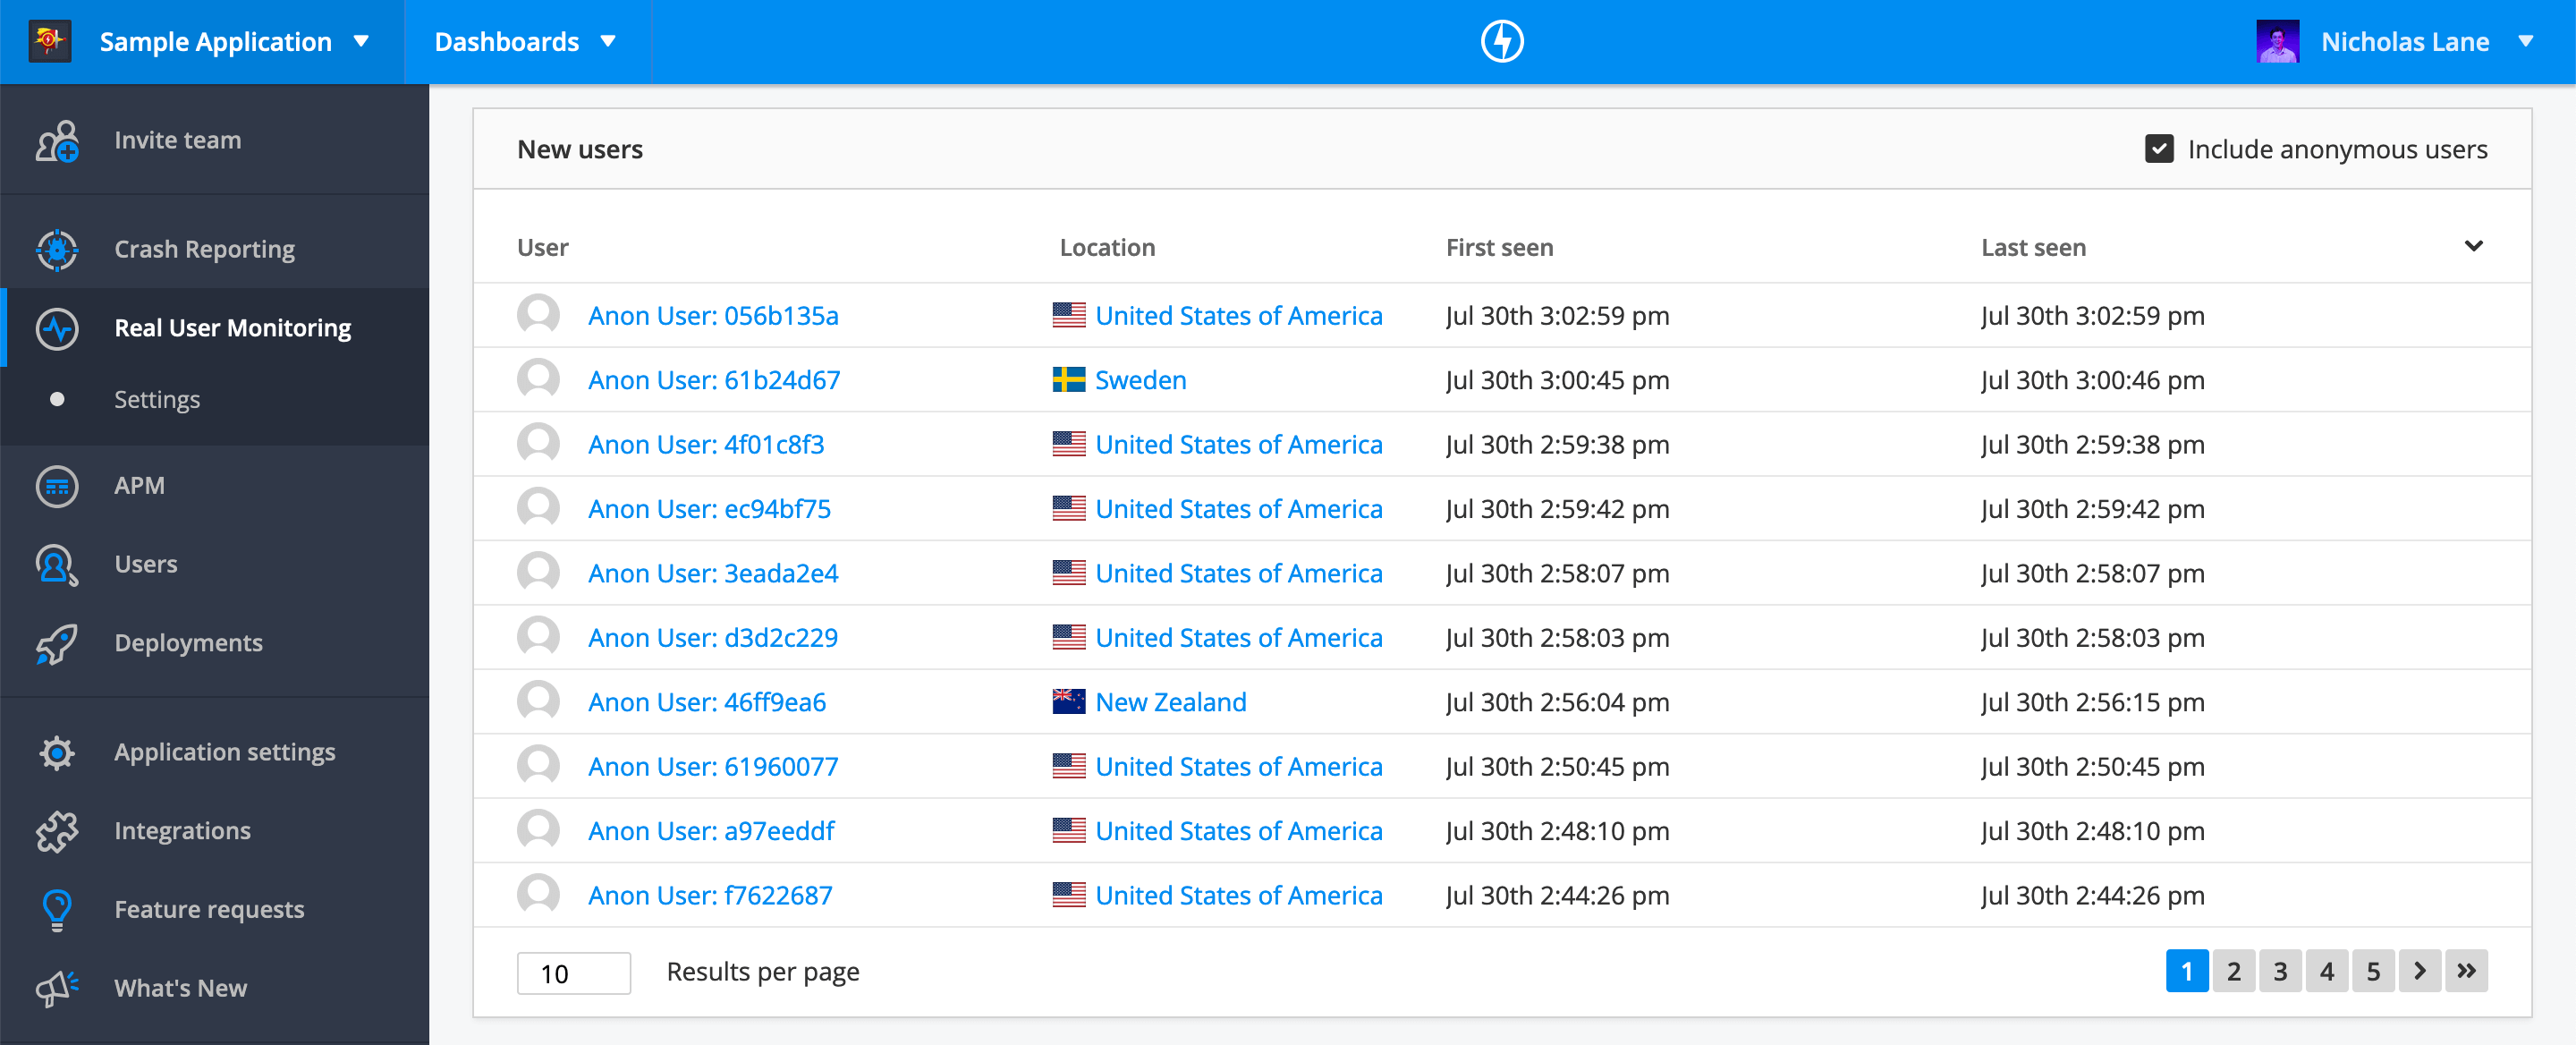
To drill into a user profile and see their session history, click on the user identifier (name or anonymous ID) from one of these tables. This will take you to their user profile within the [Users], where you will find the following information:
- Location
- IP address
- Browser
- Operating system
- Session history
- Error history (with Raygun Crash Reporting enabled in the same application)
By default, all users are anonymous in Raygun. You can choose to identify your users by attaching authenticated user data to session information. See the setup guide.