Performance metrics
Real User Monitoring captures performance metrics from real user experiences with your application. The following documentation lists the performance metrics captured for pages, virtual pages (Single Page Applications), and XHR/AJAX calls.
Pages
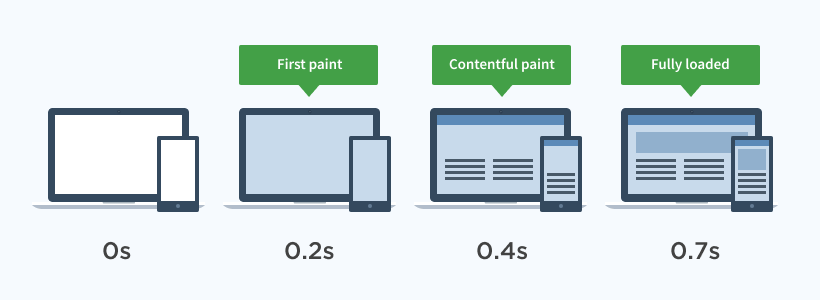
Load time: The time it takes for the entirety of the page to load.
First Paint (FP): Measures the time between navigation and when the browser renders the first pixels to the screen, rendering anything that is visually different from what was on the screen prior to navigation.
Web Vitals
For detailed information on Web Vital metrics please see the Web Vitals documentation.
Web vital metrics include: FCP, LCP, FID, CLS and INP.
Virtual Pages
View Duration: The duration of time which the user has spent viewing this virtual page.
XHR Response Time: The time it took to receive a response for all XHR calls made on the page.
XHRs
Load time: The time it took for the XHR request to respond.
Page Speed Rating
Real User Monitoring displays a Page Speed Rating on the performance tab. The rating is based on average page load time, and follows these categories:
- Excellent: <500ms load time
- Good: 500ms - 1000ms load time
- Needs work: 1000ms - 4000ms load time
- Poor: >4000ms load time
Load time breakdown
When drilling into the performance diagnostics for a specific page, you can see a colored chart breaking down the portions of load time spent in DNS, Latency, SSL, Server, Transfer, Render and Children. This data is an average of the values for each page view within the time range. The section below outlines how RUM calculates these datapoints.
Load time details:
All of the timings listed below access values from the window.performance.timing object.
This means in the context of timing we are referring to window.performance.timing.
note: These formulas have been simplified to make for better reading. Additional checks and data validation is done under the hood.
DNS
The time it takes for the nameserver lookup to resolve.
We calculate this using the following formula:
(timing.domainLookupEnd - timing.fetchStart) - (timing.domainLookupStart - timing.fetchStart)
Latency
The time it takes for the host server to receive and process a request for an asset.
We calculate this using the following formula:
(timing.connectEnd - timing.fetchStart) - (timing.connectStart - timing.fetchStart)
SSL
The time to complete an SSL handshake.
We calculate this using the following formula:
(timing.secureConnectionStart - timing.connectStart) - timing.fetchStart
Server
The time it takes for the server to compute your code.
We calculate this using the following formula:
timing.responseStart - SSL - Latency - DNS
Transfer
The time the page has to wait for assets to load from the server.
We calculate this using the following formula:
timing.responseEnd - timing.responseStart
Render
The time it takes the browser to apply stylesheet rules and compute JavaScript.
We calculate this using the following formula:
timing.domContentLoadedEventEnd - timing.responseEnd
Children
The time for asynchronous assets to process - this refers to all requests loaded by the page up until onLoad (includes scripts, stylesheets, images and XHR requests).
We calculate this using the following formula:
((timing.domComplete - timing.fetchStart) ?? timing.duration) - ((timing.domContentLoadedEventEnd - timing.fetchStart) > (timing.responseEnd - timing.fetchStart) ? (timing.domContentLoadedEventEnd - timing.fetchStart) : (timing.responseEnd - timing.fetchStart))