View performance details
View performance details provides insight into how different views in your mobile application are performing.
Navigating to view performance details
To view the performance details for a view, click on the view name from the 'Slowest Views' table on the performance overview.
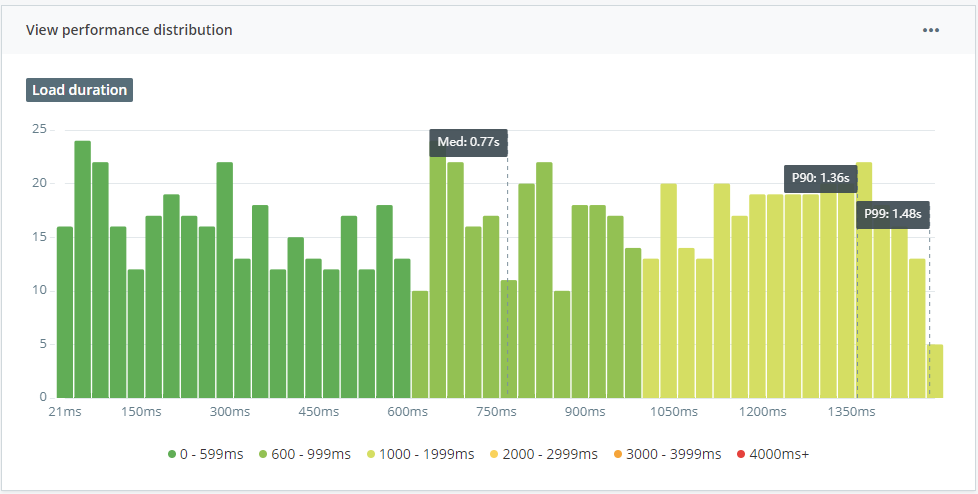
Load duration distribution
The histogram visualizes the distribution of load duration for that view. Enabling you to see how the majority of users experienced this view at a glance.
Controls:
In the top right-hand corner, within the three dots icon, you'll find the following controls:
-
Hide 10% slowest to hide the slowest 10% of the dataset. This helps if your graph has a particularly long tail due to outliers.
-
Logarithmic scale: switches the Y-axis into logarithmic scale. This helps if any bars containing a large count are flattening the graph.
Load duration trend
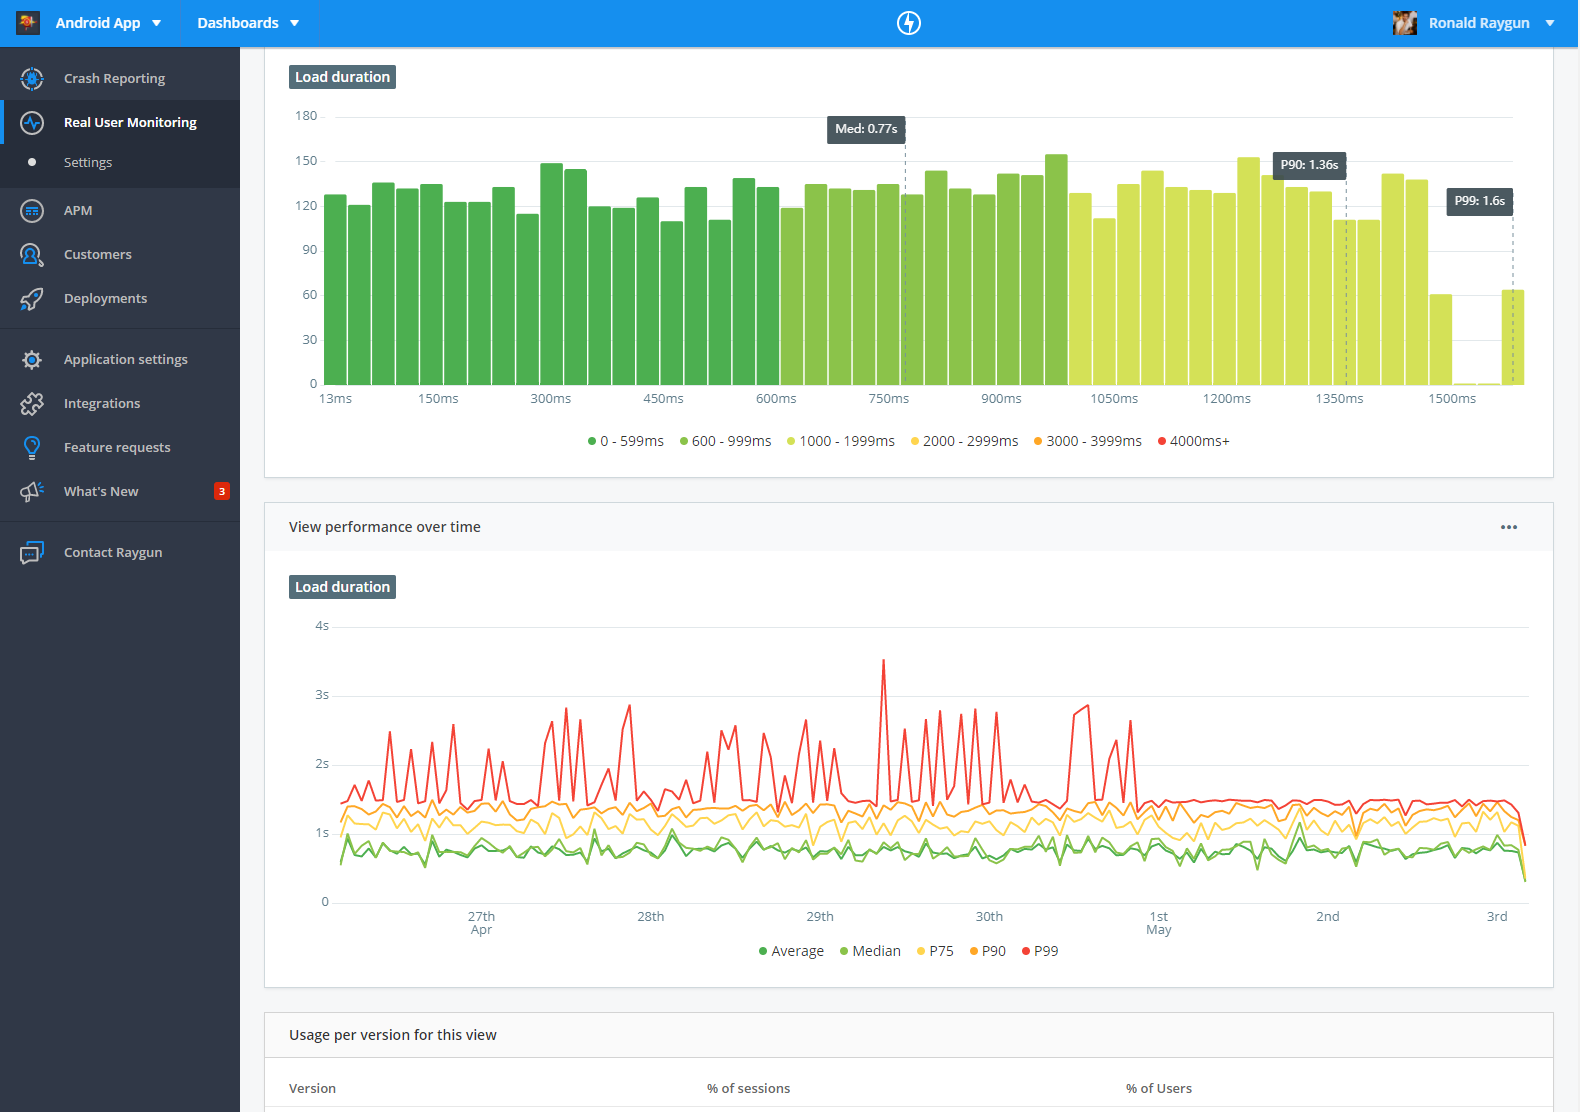
The line graph visualizes the Average, Median, P75, P90, and P99 load duration over time. Providing comprehensive visibility into the trend in performance for each view.
Controls:
You can hide each line by clicking the corresponding measure label in the key at the bottom of the graph.
Usage per version table
This table shows the usage of a view across different application versions.
You can find instructions for setting up version tracking in the language guides documentation.