Azure App Services
Welcome to the Raygun APM troubleshooting guide for Azure App Services. In this guide, we'll walk you through a series of steps to help you identify and resolve common issues with the Raygun APM. Please follow the suggested solutions based on the problem you're experiencing, and don't hesitate to contact Raygun Support if you need further assistance.
-
I'm not getting any traces
-
I get traces but they are not what I expect
-
Memory and/or CPU usage on the Raygun Agent is high
-
I have another issue or the above didn't help me
Check the Agent Status
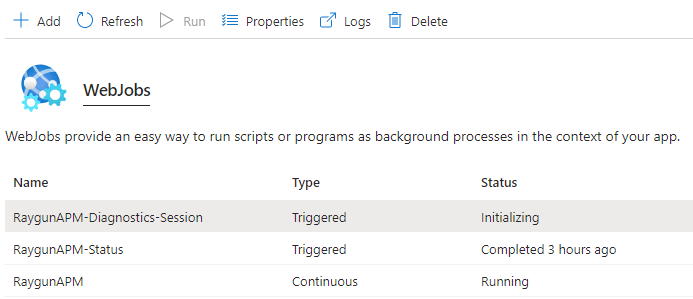
The Raygun Azure App Service Extension contains three Web Jobs. One of which is RaygunAPM-Status.
In the Azure Portal, navigate to the Web Jobs and locate the Status job.
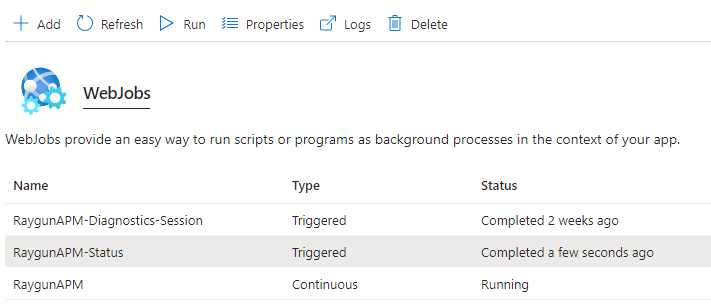
Run the job and then check the logs to ensure the Agent can communicate with the Raygun API and the profiler, and that the API key is valid.
Example Logs:
[... INFO] Running Raygun Agent status checks...
[... INFO] Agent status: Registered
[... INFO] Agent test: Connected to the Raygun Agent v1.1.7.0 on port 2704.
[... INFO] API test: Connected to the Raygun API at https://api2.raygun.com.
[... INFO] TLS test: TLS 1.2 is supported on this machine.
[... INFO] API key test: API key KA5.............LJr6w is valid
[... INFO] Profiler x86 test: 32-bit .NET Profiler found at C:\home\Raygun\Profiler\1.1.7\x86\RaygunProfiler.dll.
[... INFO] Profiler x64 test: 64-bit .NET Profiler found at C:\home\Raygun\Profiler\1.1.7\x64\RaygunProfiler.dll.
note:
If the status fails for any reason the agent may not be installed correctly. Please try uninstalling the extension, then re-installing it following the steps outlined in Installing Azure App Services.
If problems persist, please contact us.
Check the profiler is attached
To check the Profiler is attached:
- Ensure the environment variables are correct
- Check the loaded modules
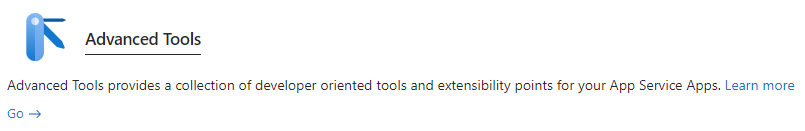
Perform both these checks in the Kudu tool. To open the Kudu tool, navigate to the Advanced Tools section under Development Tools in the Azure Portal and press Go to load the Kudu tool.
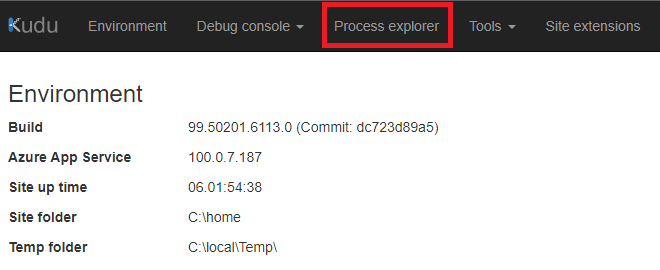
Navigate to the Process Explorer in the top navigation.
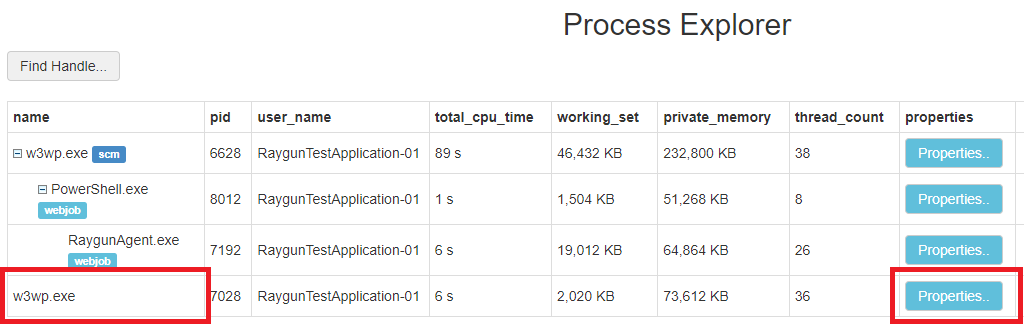
In the process explorer, find the w3wp.exe process without scm in the name, and go to Properties.
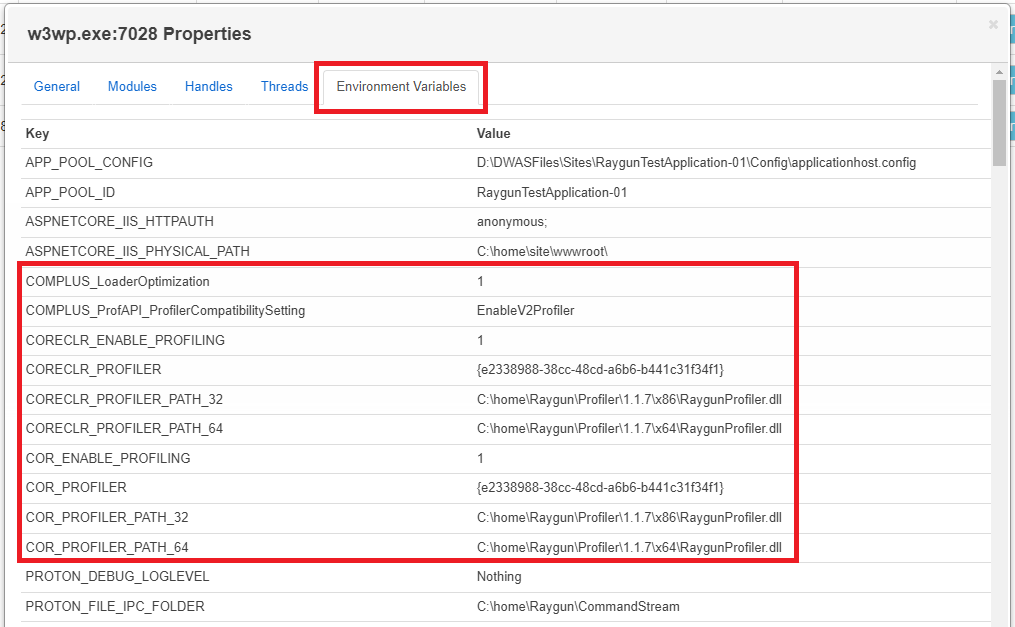
Checking Environment Variables
Under the Properties tab navigate to the Environment Variables tab and verify that the Environment Variables for enabling the profiler and the location of the profiler .dll file have been correctly set.
note:
If the environment variables are not found, this could indicate the applicationHost.xdt file has not been applied. Try stopping/starting the application, then checking again. After a stop/restart it will take up to 60 seconds for the transformation to be applied before the variables will be visible.
If problems, persist please contact us.
Checking Loaded Modules
In the same Process explorer navigate to the Modules tab.
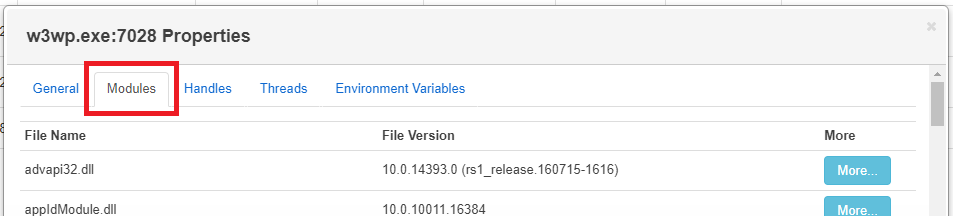
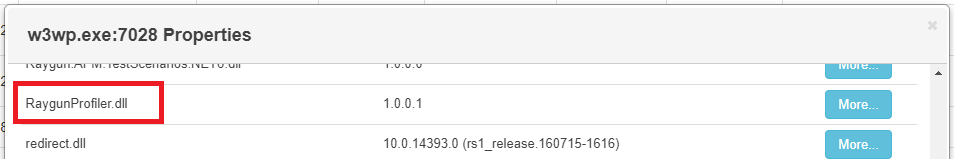
Scroll down the list to R and verify RaygunProfiler.dll is in the list.
note:
If the RaygunProfiler.dll is not found in the modules list, there may be a conflicting profiler enabled, such as Application Insights. Please ensure no other Profiling extensions are enabled, if they are, disable them and restart the application.
If problems persist, please contact us.
Check Application Insights is disabled
In the Azure Portal, find the Application Insights section under Settings.
If enabled, this will need to be disabled.
note: It is only possible to attach one profiler to an application. If Application Insights is enabled, the Raygun Profiler will not attach. If any other 3rd party profilers are enabled, you must disable them first.
Run a Diagnostics Session
If you are recieving traces and they are not as expected, you can run a diagnostics session, which will capture the raw traces and allow us to analyze them.
In the Azure Portal, navigate to the Web Jobs and locate the Diagnostics-Session job.
Select the job and run it.
The Diagnostics-Session will run for 2 minutes, once the job moves from Initializing to Running (please allow 20-30 seconds to ensure the capturing has started), you can navigate the website, invoking URLs that cause unexpected traces to occur.
Once the job has completed, you can navigate to the logs.
Example Logs:
[... INFO] Raygun Agent for Windows
[... INFO] Diagnostics session started.
[... INFO] Starting diagnostics session for 2 minutes
[... INFO]
[... INFO] Message: Diagnostics session is currently running.
[... INFO]
[... INFO] Message: Diagnostics session is currently running.
...
[... INFO] Message: Diagnostics session is currently running.
[... INFO]
[... INFO] Message: Diagnostics session is currently running.
[... INFO]
[... INFO] Message: Diagnostics session has ended.
[... INFO] Session Id: 9575dd96
[... INFO] Duration: 120 seconds
[... INFO]
[... INFO] ----------------------------------------
[... INFO] Diagnostics session complete
note:
After the diagnostics session has run and completed, you will receive a Session Id such as 9575dd96.
Please contact support and inform us of the issue and include the Session Id from the diagnostics session.
Generate a Process Dump
The Raygun Agent shouldn't use much CPU, and its memory footprint should be relatively low. If this is not the case, please send us a process dump.
Memory Dump
Both these checks need to be done in the Kudu tool, to open the Kudu tool, navigate to the Advanced Tools section under Development Tools in the Azure Portal and press Go to load the Kudu tool.
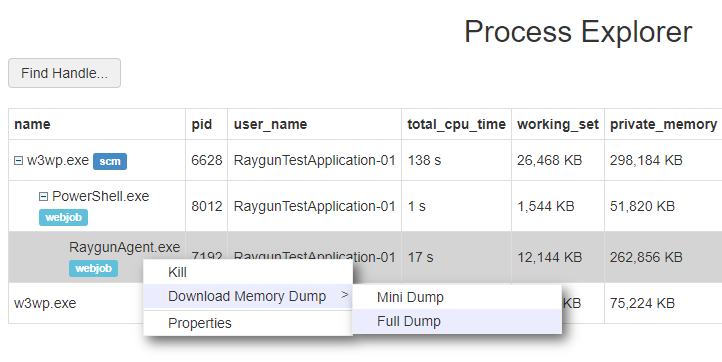
Open the process explorer and find the RaygunAgent.exe process, right click and select Download Memory Dump > Full Dump
Process Session
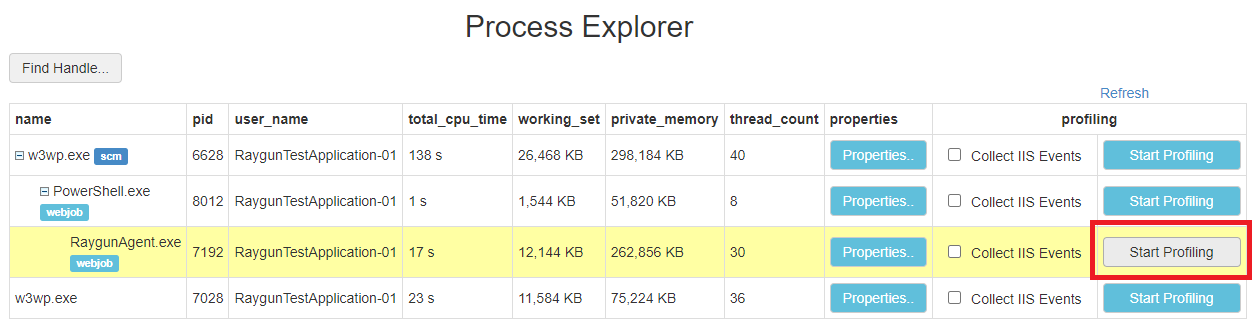
In the same process explorer, find the RaygunAgent.exe and click Start Profiling on the right hand side.
Allow the profiling session to run for a couple of minutes (2-5 minutes should be enough time providing the CPU utilization is high during profiling)
note: After downloading the Memory Dump and/or the Process Session, please zip up the files and contact support.
Contact Raygun Support
If you need further help please contact us.