Performance
Performance provides all the front-end performance data you need to speed up your application and improve the user experience.
Performance will help you:
- Identify poor performance
- Diagnose the root cause
- Measure the impact of performance optimizations
Performance Metrics
Real User Monitoring captures the load duration for particular views and network calls in your mobile application.
You can use this data to identify poor performing parts of your application and measure the impact of optimizations.
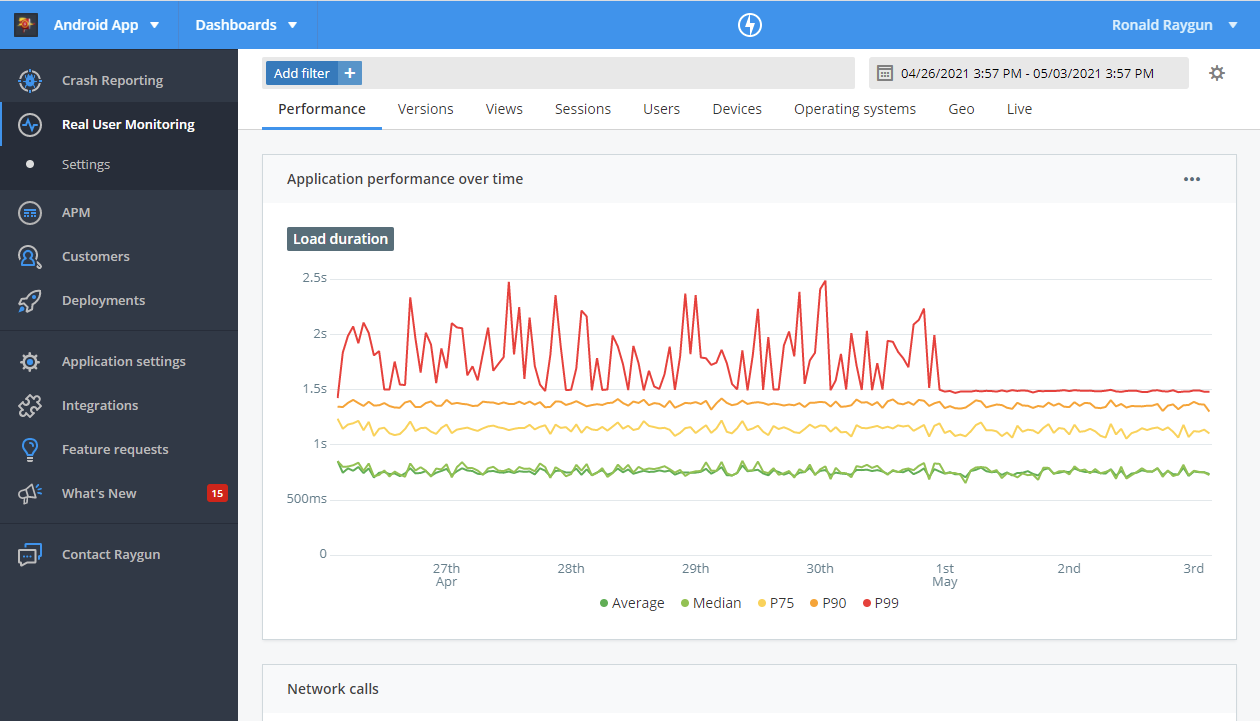
Line Graph
The line graph visualizes the Average, Median, P75, P90, and P99 of load duration over the time range selected, enabling you to see the trend in performance for your mobile application.
Controls:
You can hide the Average, Median, P75, P90 or P99 lines by clicking the corresponding label in the key at the bottom of the graph.
Next to the dropdown is the options menu, within the three dots, where you'll find the following control:
- Logarithmic scale: switches the Y-axis into logarithmic scale. This helps if you have a particular high outlier which is making the lines hard to interpret.
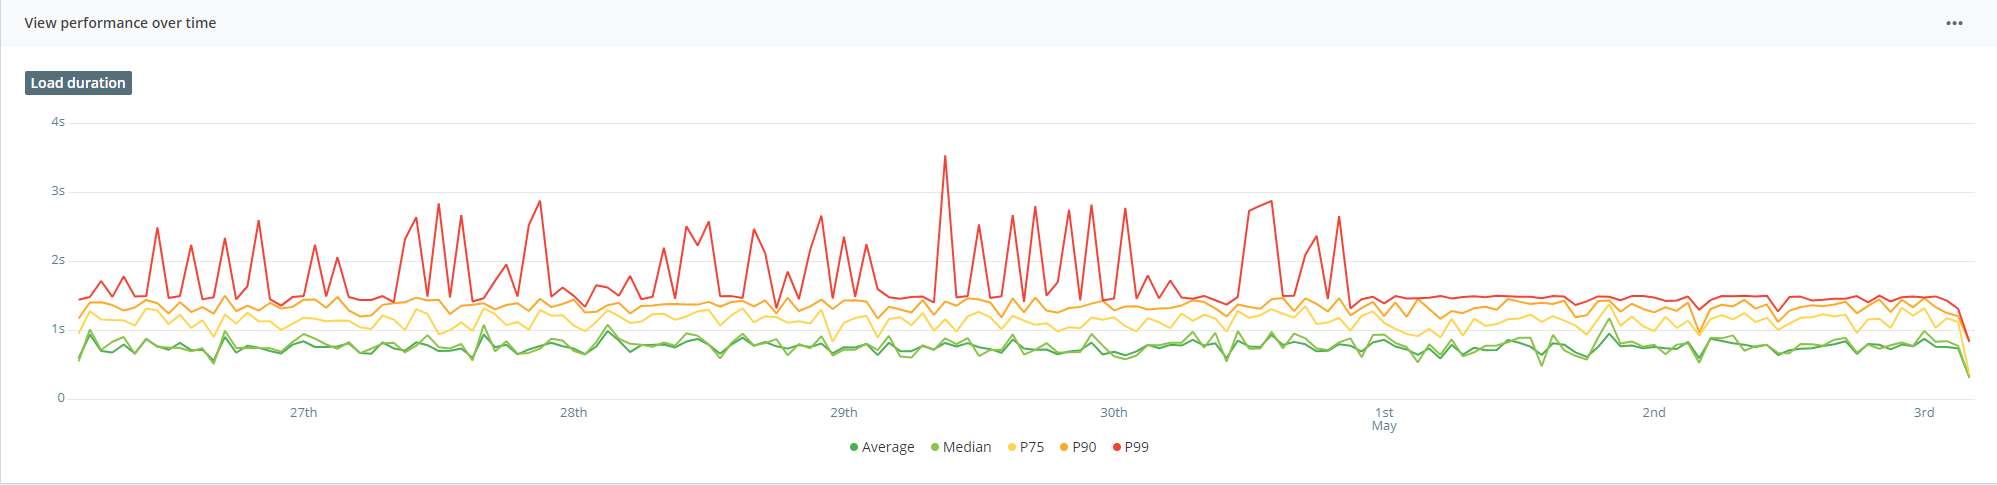
Understanding performance for views
You can find view performance details by clicking on the view name from the 'Slowest views' table.
Network calls table
This table shows the following information for each network call you've logged to RUM:
- Number of requests
- Load duration
Logging Network Calls
The documentation for logging network calls for each provider can be found with the following links.
Using Filters
The filter bar at the top of the performance page can be used to refine the dataset, helping you identify performance issues based on particular parameters such as geography, device, operating system and more.
For more information, see the documentation on using filters in Real User Monitoring.