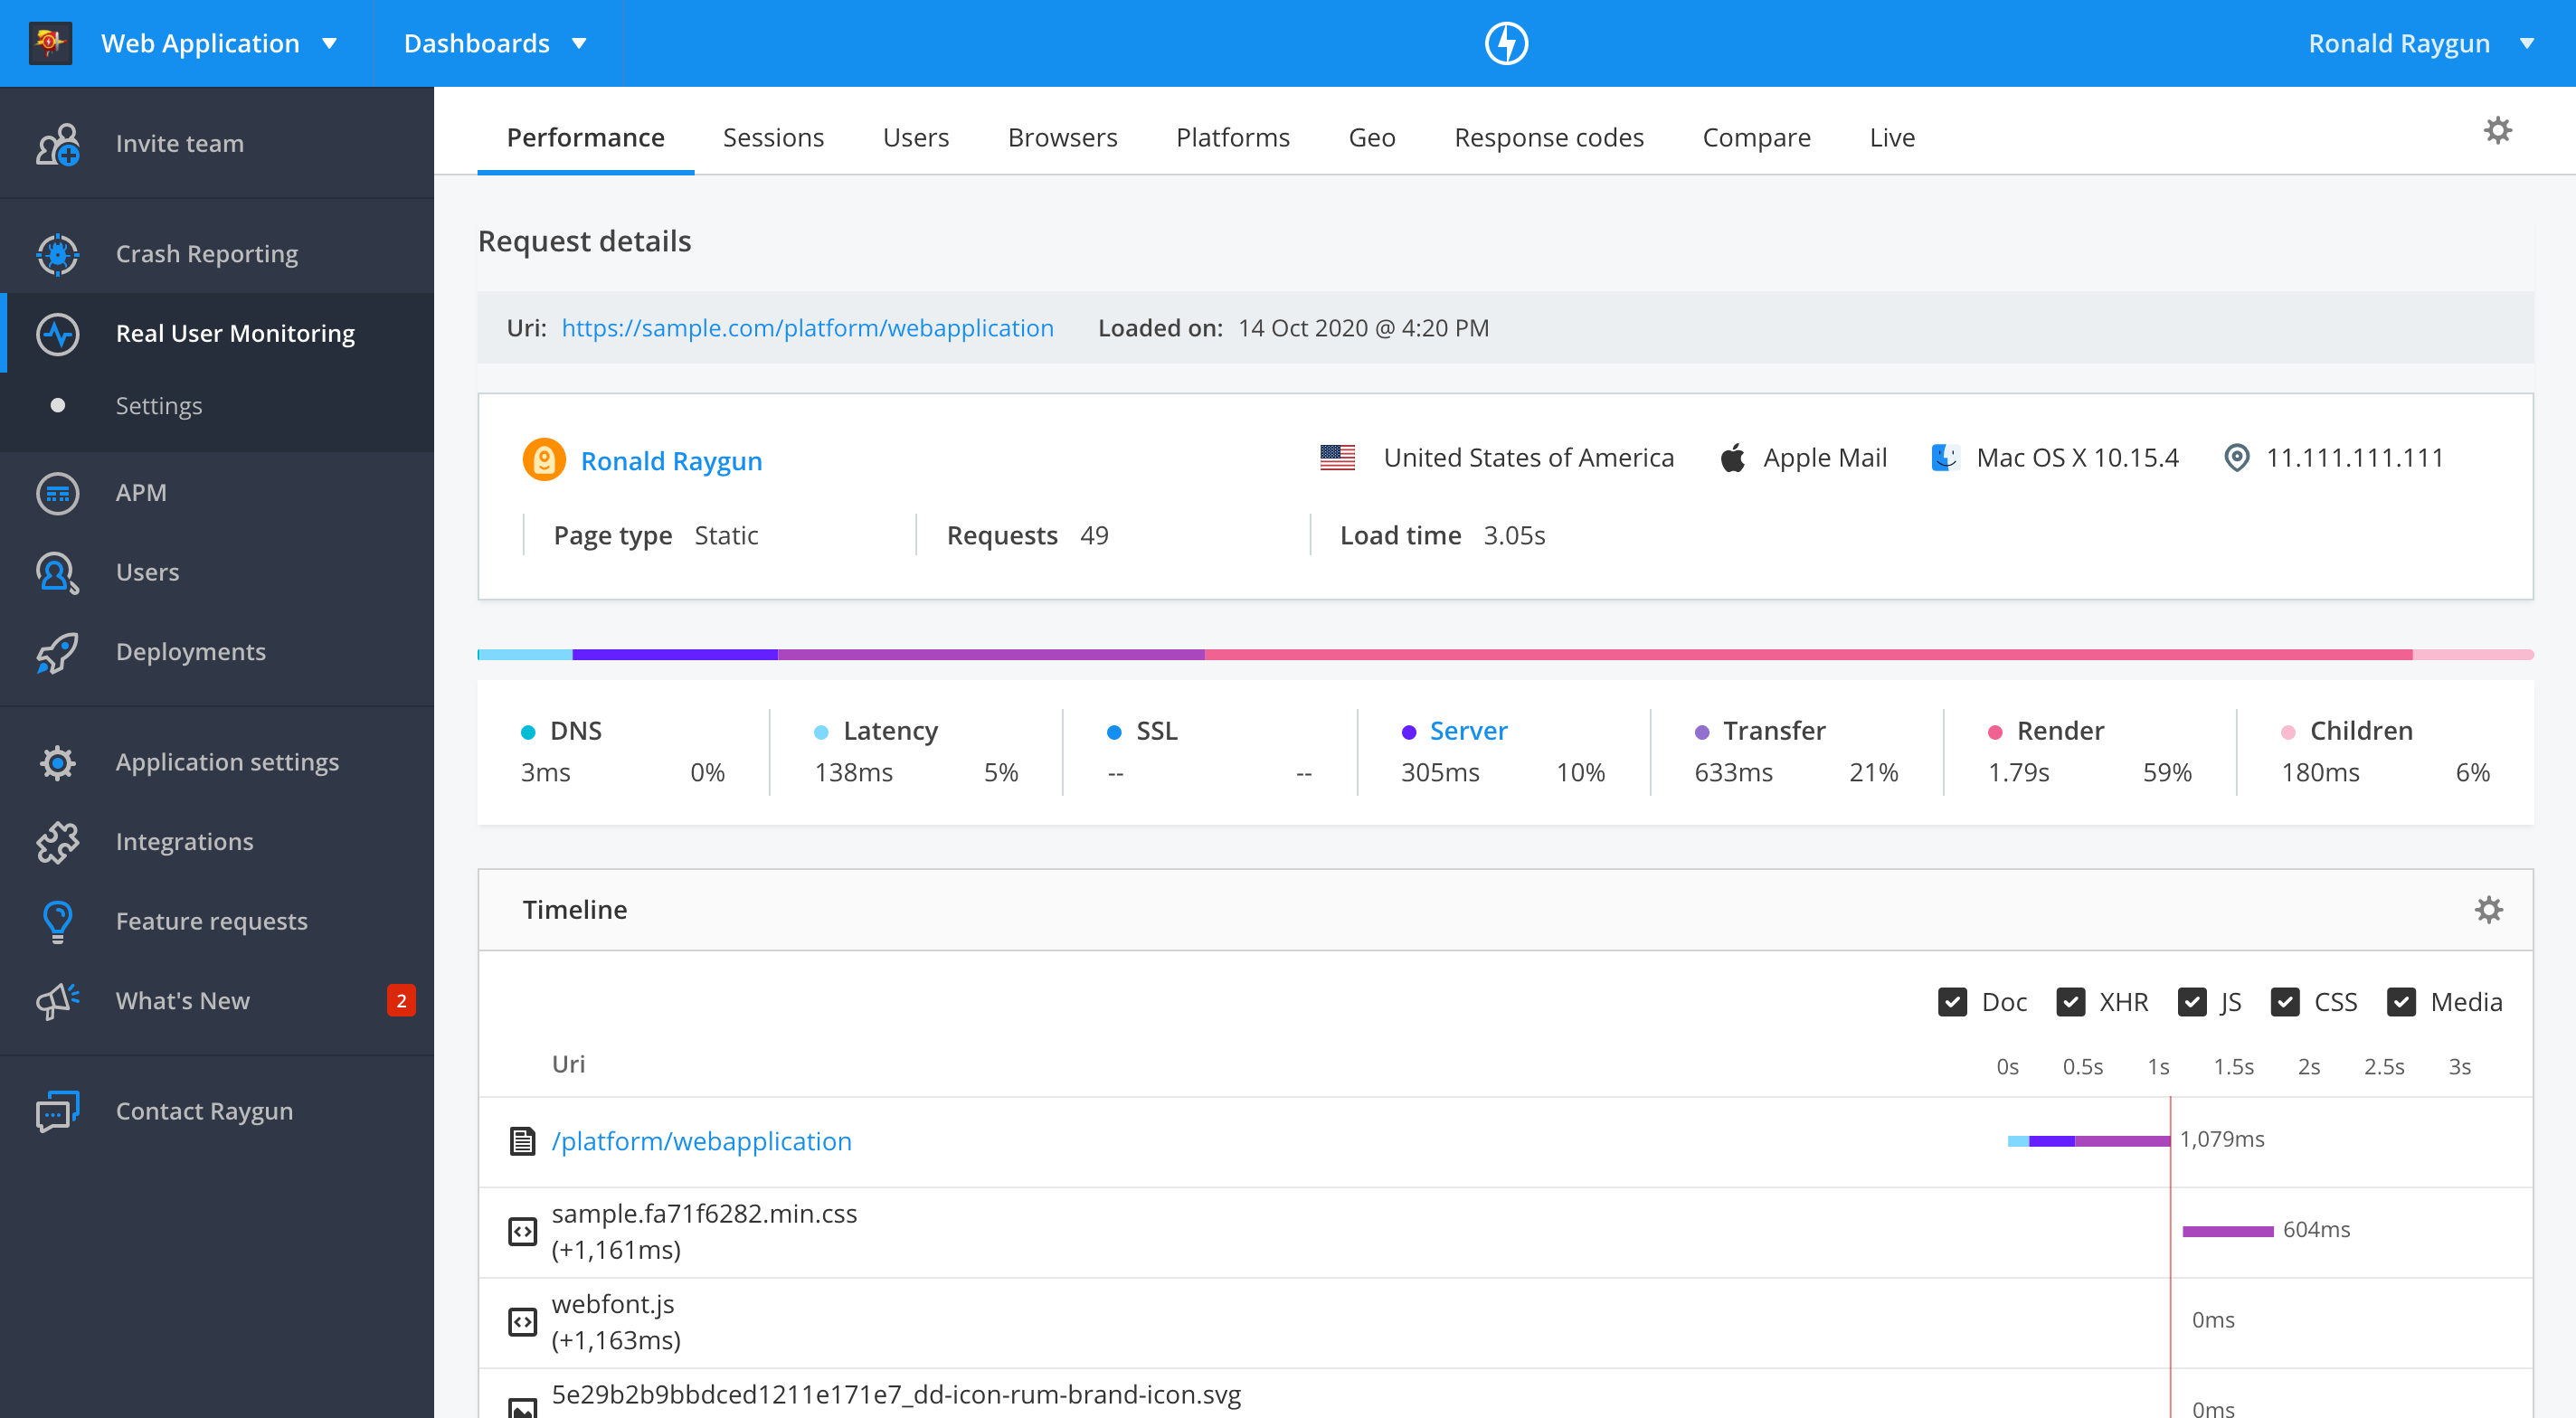
Request details
The request details page provides instance-level performance information about any given page request within a user session. Helping to diagnose the root cause of poor performance in your application.
Navigating to request details
There are two ways to view the request details for a specific page request:
- Click on the URL of any page within a session trace.
- Click on the URL from the 'Latest slowest requests for this page' table on the performance details page.
User and session details
The header at the top of the request details page displays key information about the user who performed the specific page request. Including:
- User ID
- Geography
- IP address
- Device type
- Operating system
- Browser
All users are anonymous by default. You can choose to attach user information from your authenticated users by setting up users.
Load time breakdown
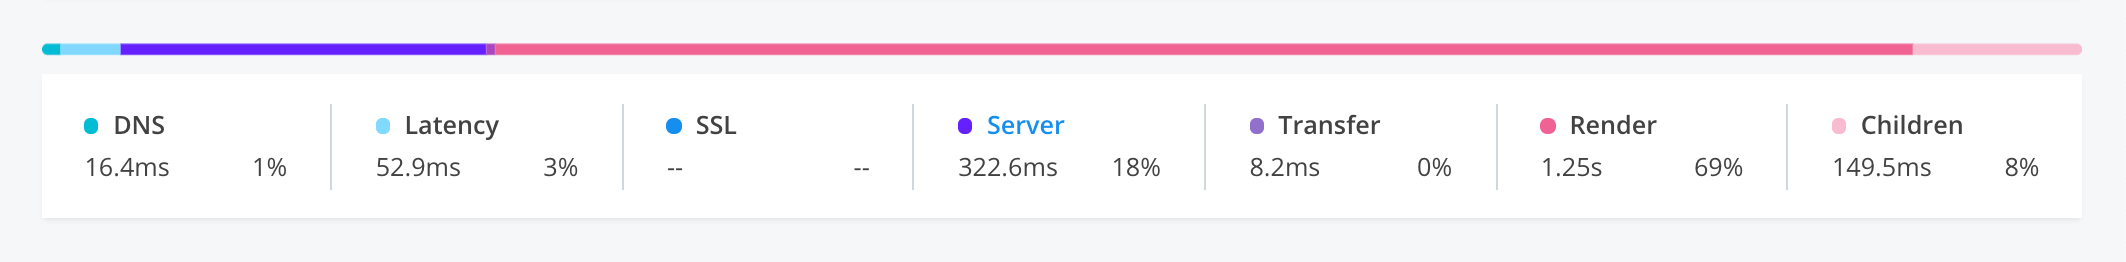
This chart visualizes the time taken in each portion of load time (DNS, Latency, SSL, Server, Transfer, Render, Children) for this specific page request. This allows you to see where the largest portion of load time was spent.
For more information on how each portion is calculated, see the performance metrics documentation.
Waterfall timeline
This chart shows a list of the requests made to load the page, and the time taken with each for this specific page request. Showing you how the page loaded for this user, and where the longest amount of time was spent.
The offset timing (shown underneath each request in the timeline) shows the point within the page load where a particular request started.
note: For virtual pages (in single page applications) the waterfall timeline shows subsequent requests made to load the virtual page.
You can show/hide different request types using the toggles at the top of the timeline.
XHR requests
This table shows a list of XHR calls made from the page, the number of requests for each XHR, and the average response time. Click the URI to see the full distribution of response times.