Geo
Geo provides visibility into the distribution of application performance and usage by geography. Helping you identify how performance differs across countries, and understand where your users are located.
Regions breakdown
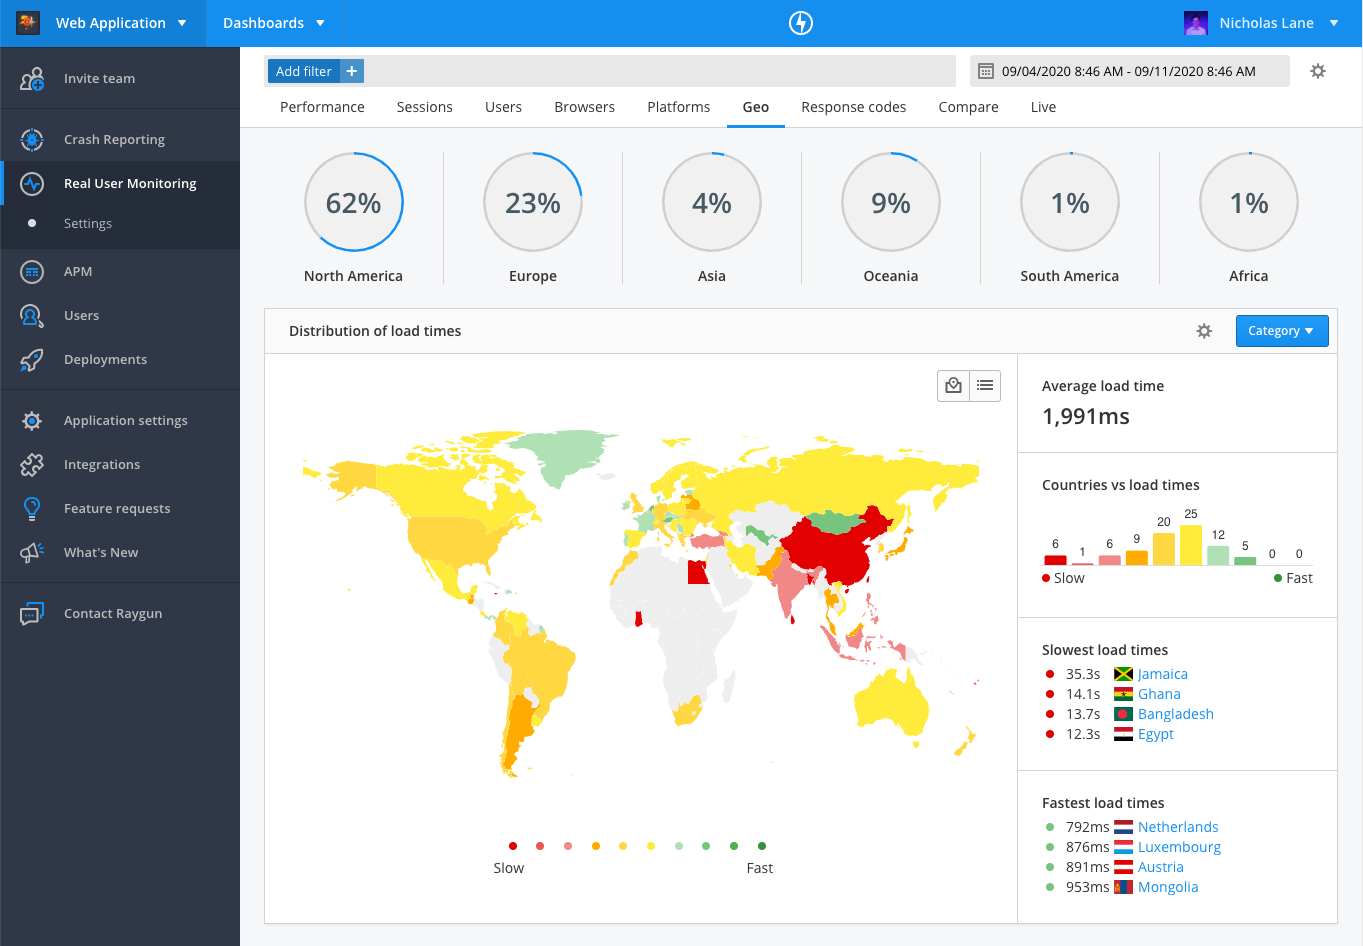
You can view the percentage breakdown of application usage across different regions at the top of the page. This is calculated based on the number of page views in each region.
Load time distribution
To view the distribution of average load times in countries across the world, select 'load time distribution' from the category drop down on the top right-hand corner of the map.
Countries are color-coded according to average load time:
- Green: < 1.5s
- Yellow: 1.5s - 3s
- Orange: 3s - 4s
- Red: > 4s
The following metrics are displayed on the side panel next to the graph:
- Average load time (across all countries)
- Distribution of countries by load time buckets
- Top 4 slowest countries by load time
- Top 4 fastest countries by load time
Session distribution
To view the distribution of user sessions in countries across the world, select 'session distribution' from the category drop down on the top right-hand corner of the map. This view visualizes the countries where the majority of your users are from.
Countries are color-coded according to the number of sessions.
The following metrics are displayed on the side panel next to the graph:
- Total sessions (across all countries)
- Distribution of countries by session buckets
- Top 4 countries with most sessions
- Top 4 countries with least sessions
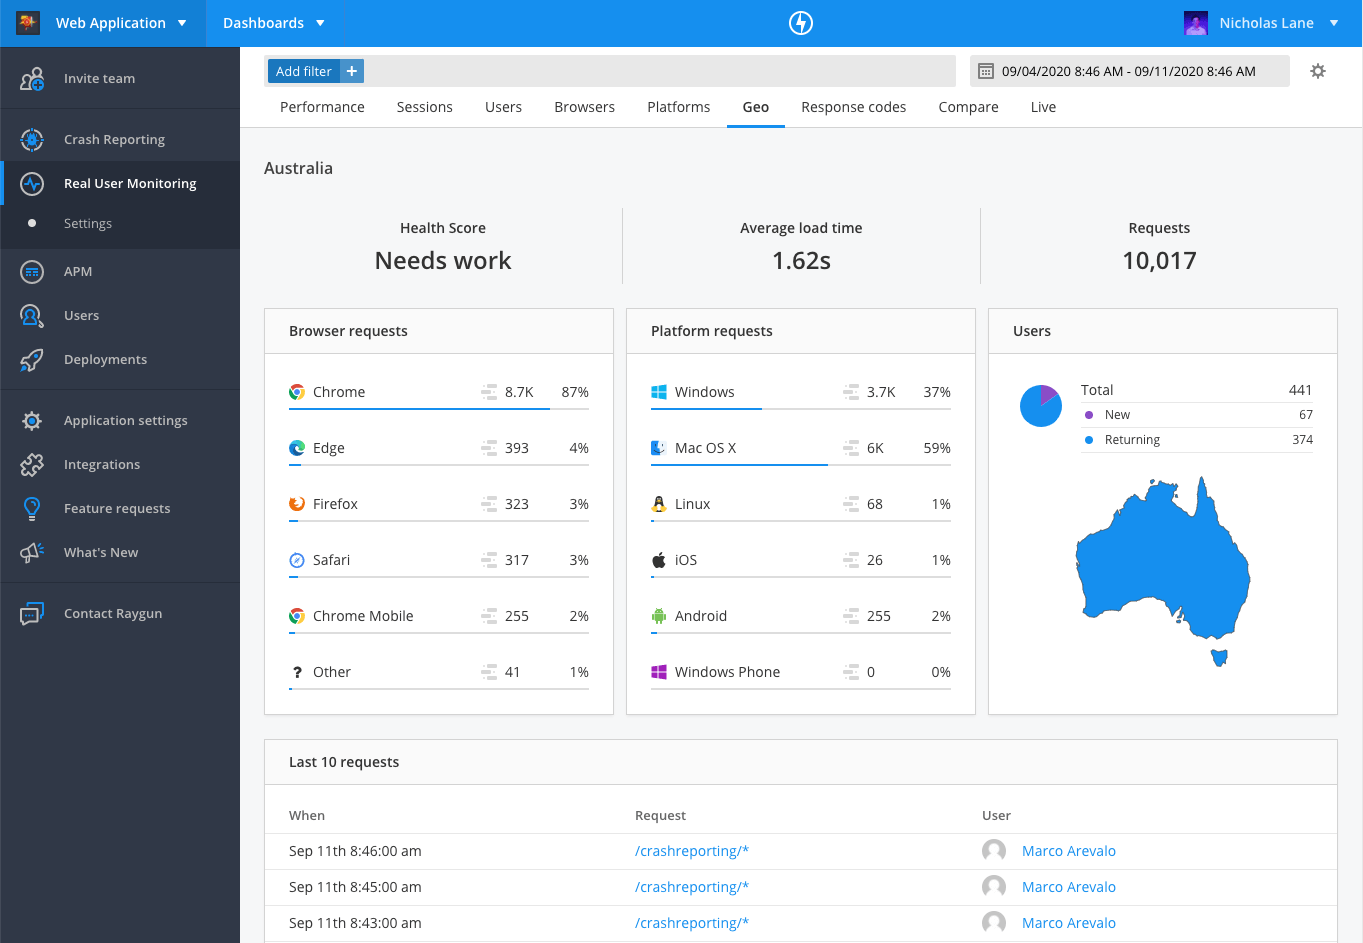
Country view
You can view information for a specific country by clicking on the country in the map or list.