Geo
Geo provides visibility into the distribution of usage by geography. Helping you understand where your users are located.
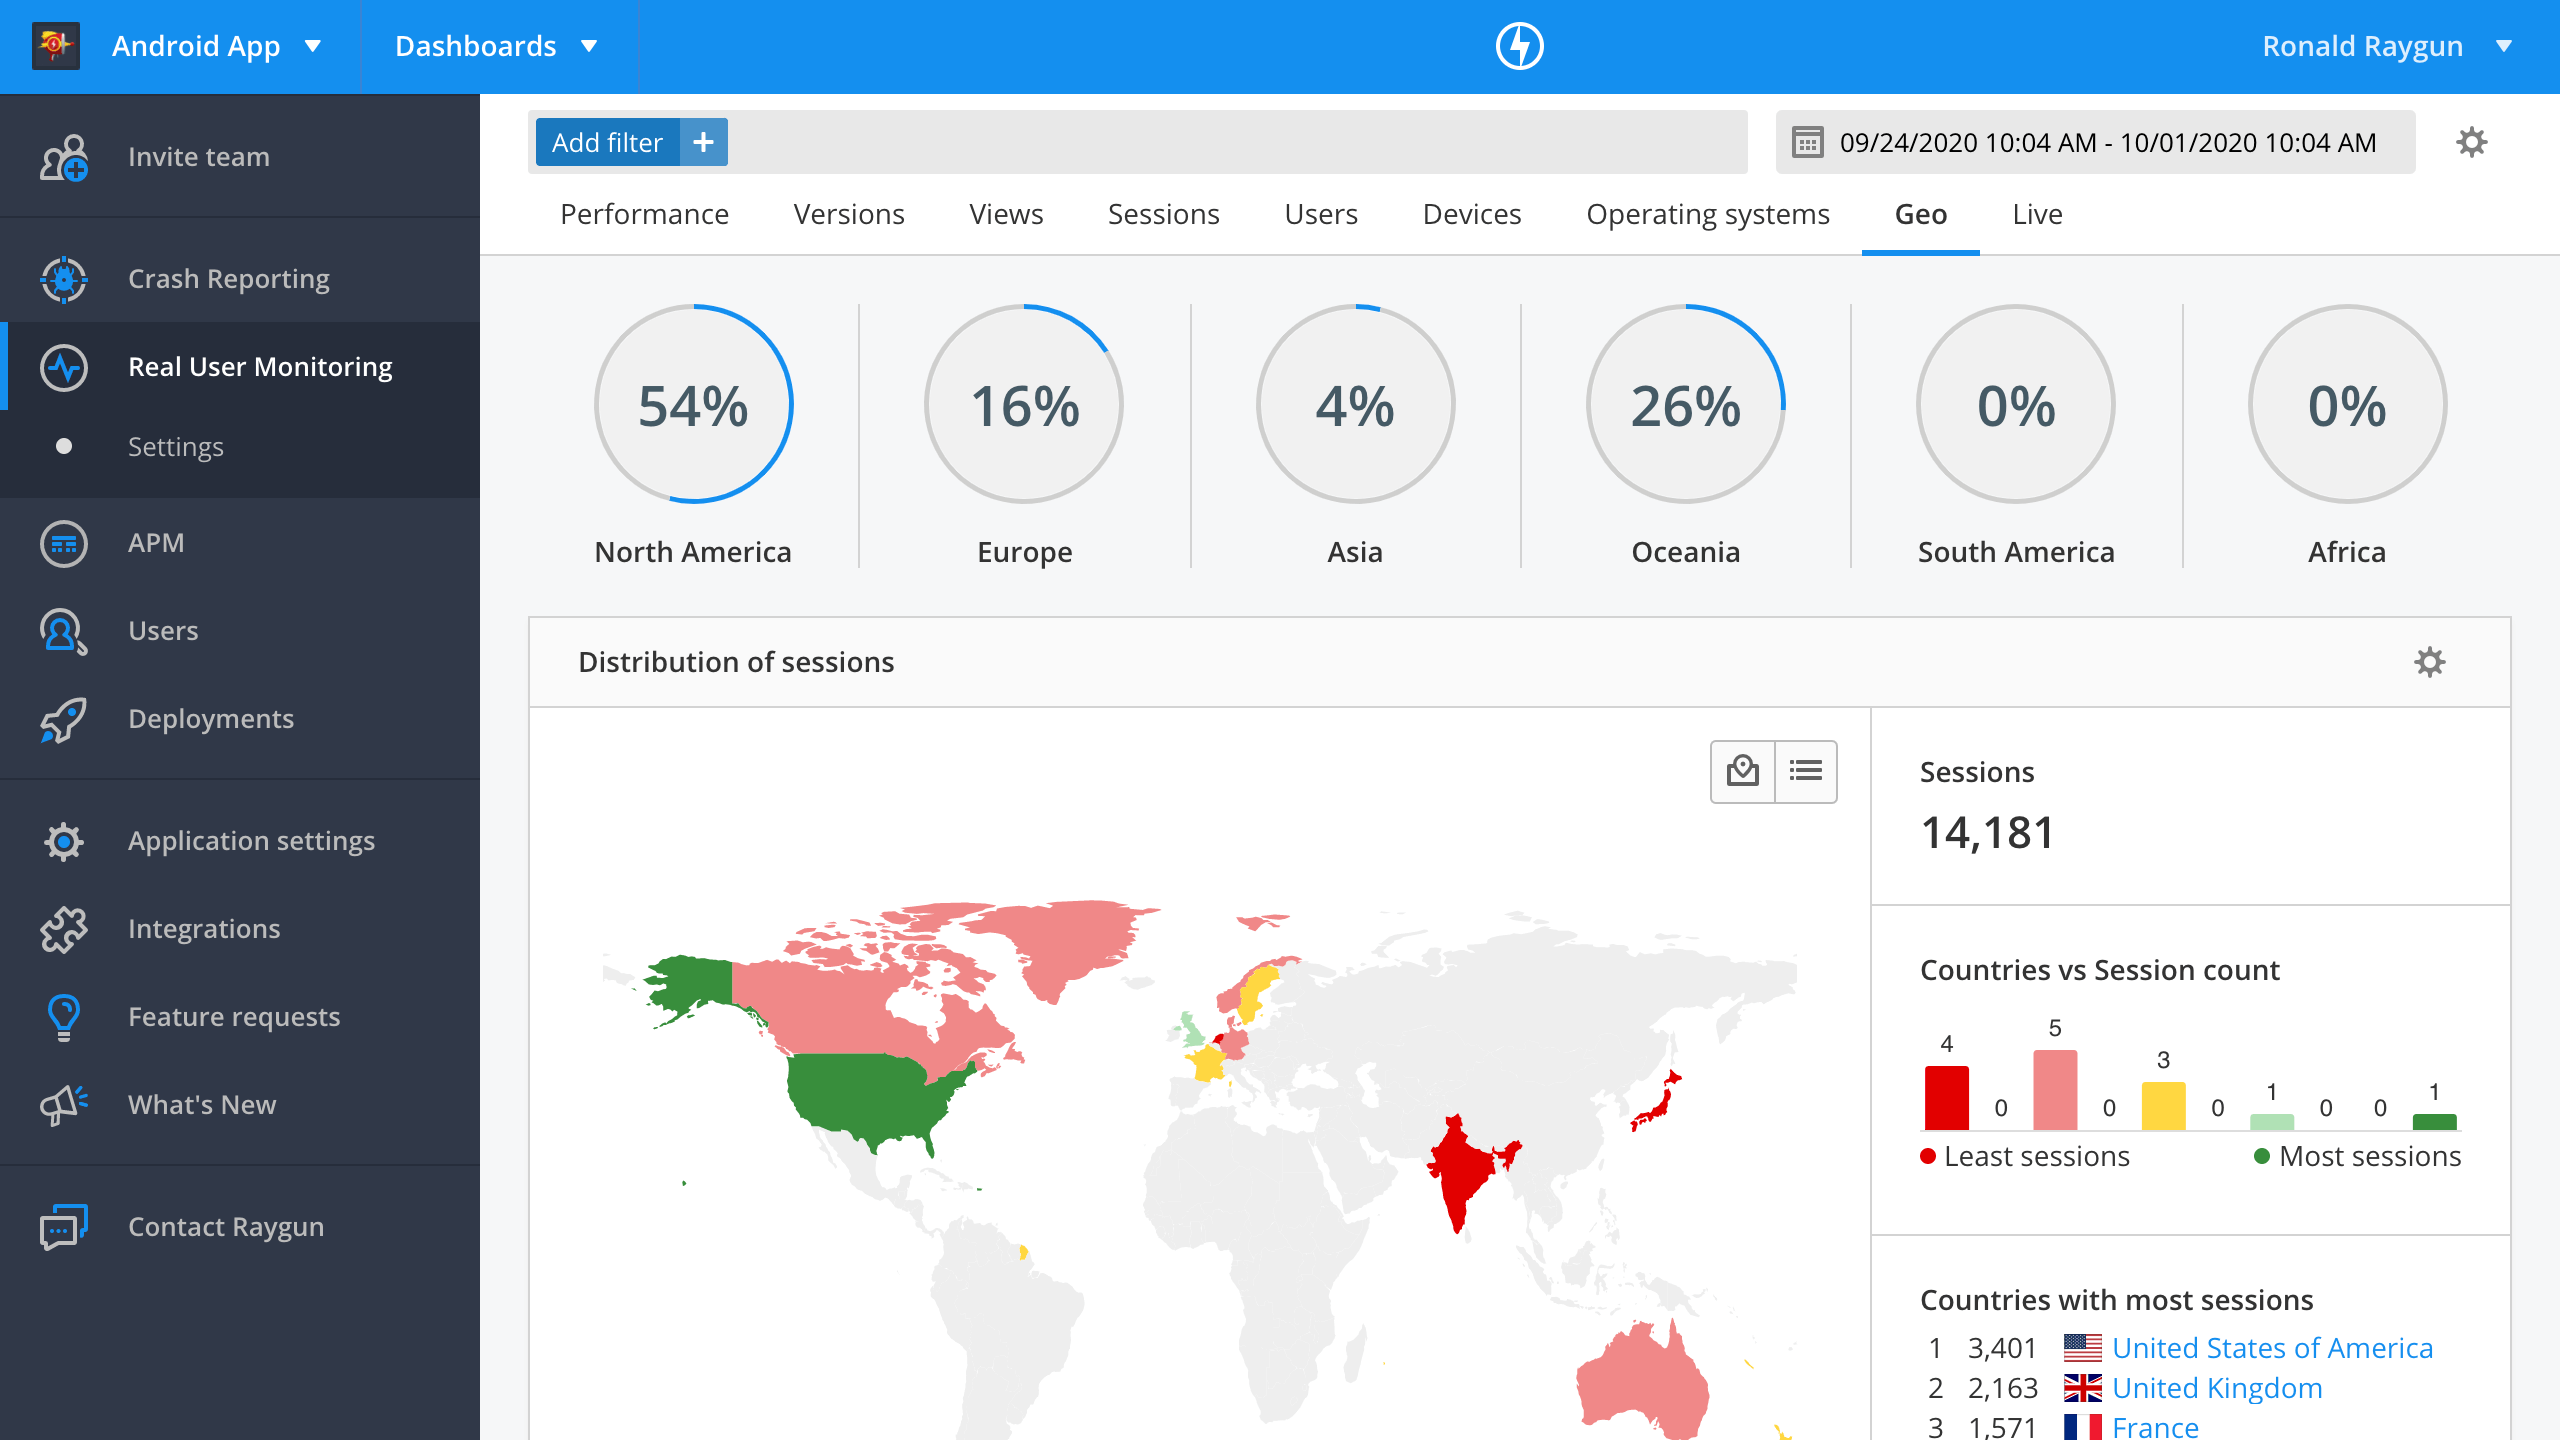
Regions breakdown
You can view the percentage breakdown of application usage across different regions at the top of the page. This is calculated based on the number of sessions in each region.
Session distribution
The map on the Geo tab visualizes the distribution of usage across the world.
Countries are color-coded according to the number of sessions.
The following metrics are displayed on the side panel next to the graph:
- Total sessions (across all countries)
- Distribution of countries by session buckets
- Top 4 countries with most sessions
- Top 4 countries with least sessions
Country drill-down
To drill into usage information about a specific country, select it from the map or list on the geo page. Here you will find:
- Total number of sessions
- Total number of users
- Total number of views
- Last 10 views
- Last 10 users