Response codes
Raygun Real User Monitoring collects the response codes from all XHR requests made within your application to give you insights into the trends in responses, an important indicator of the health of your application.
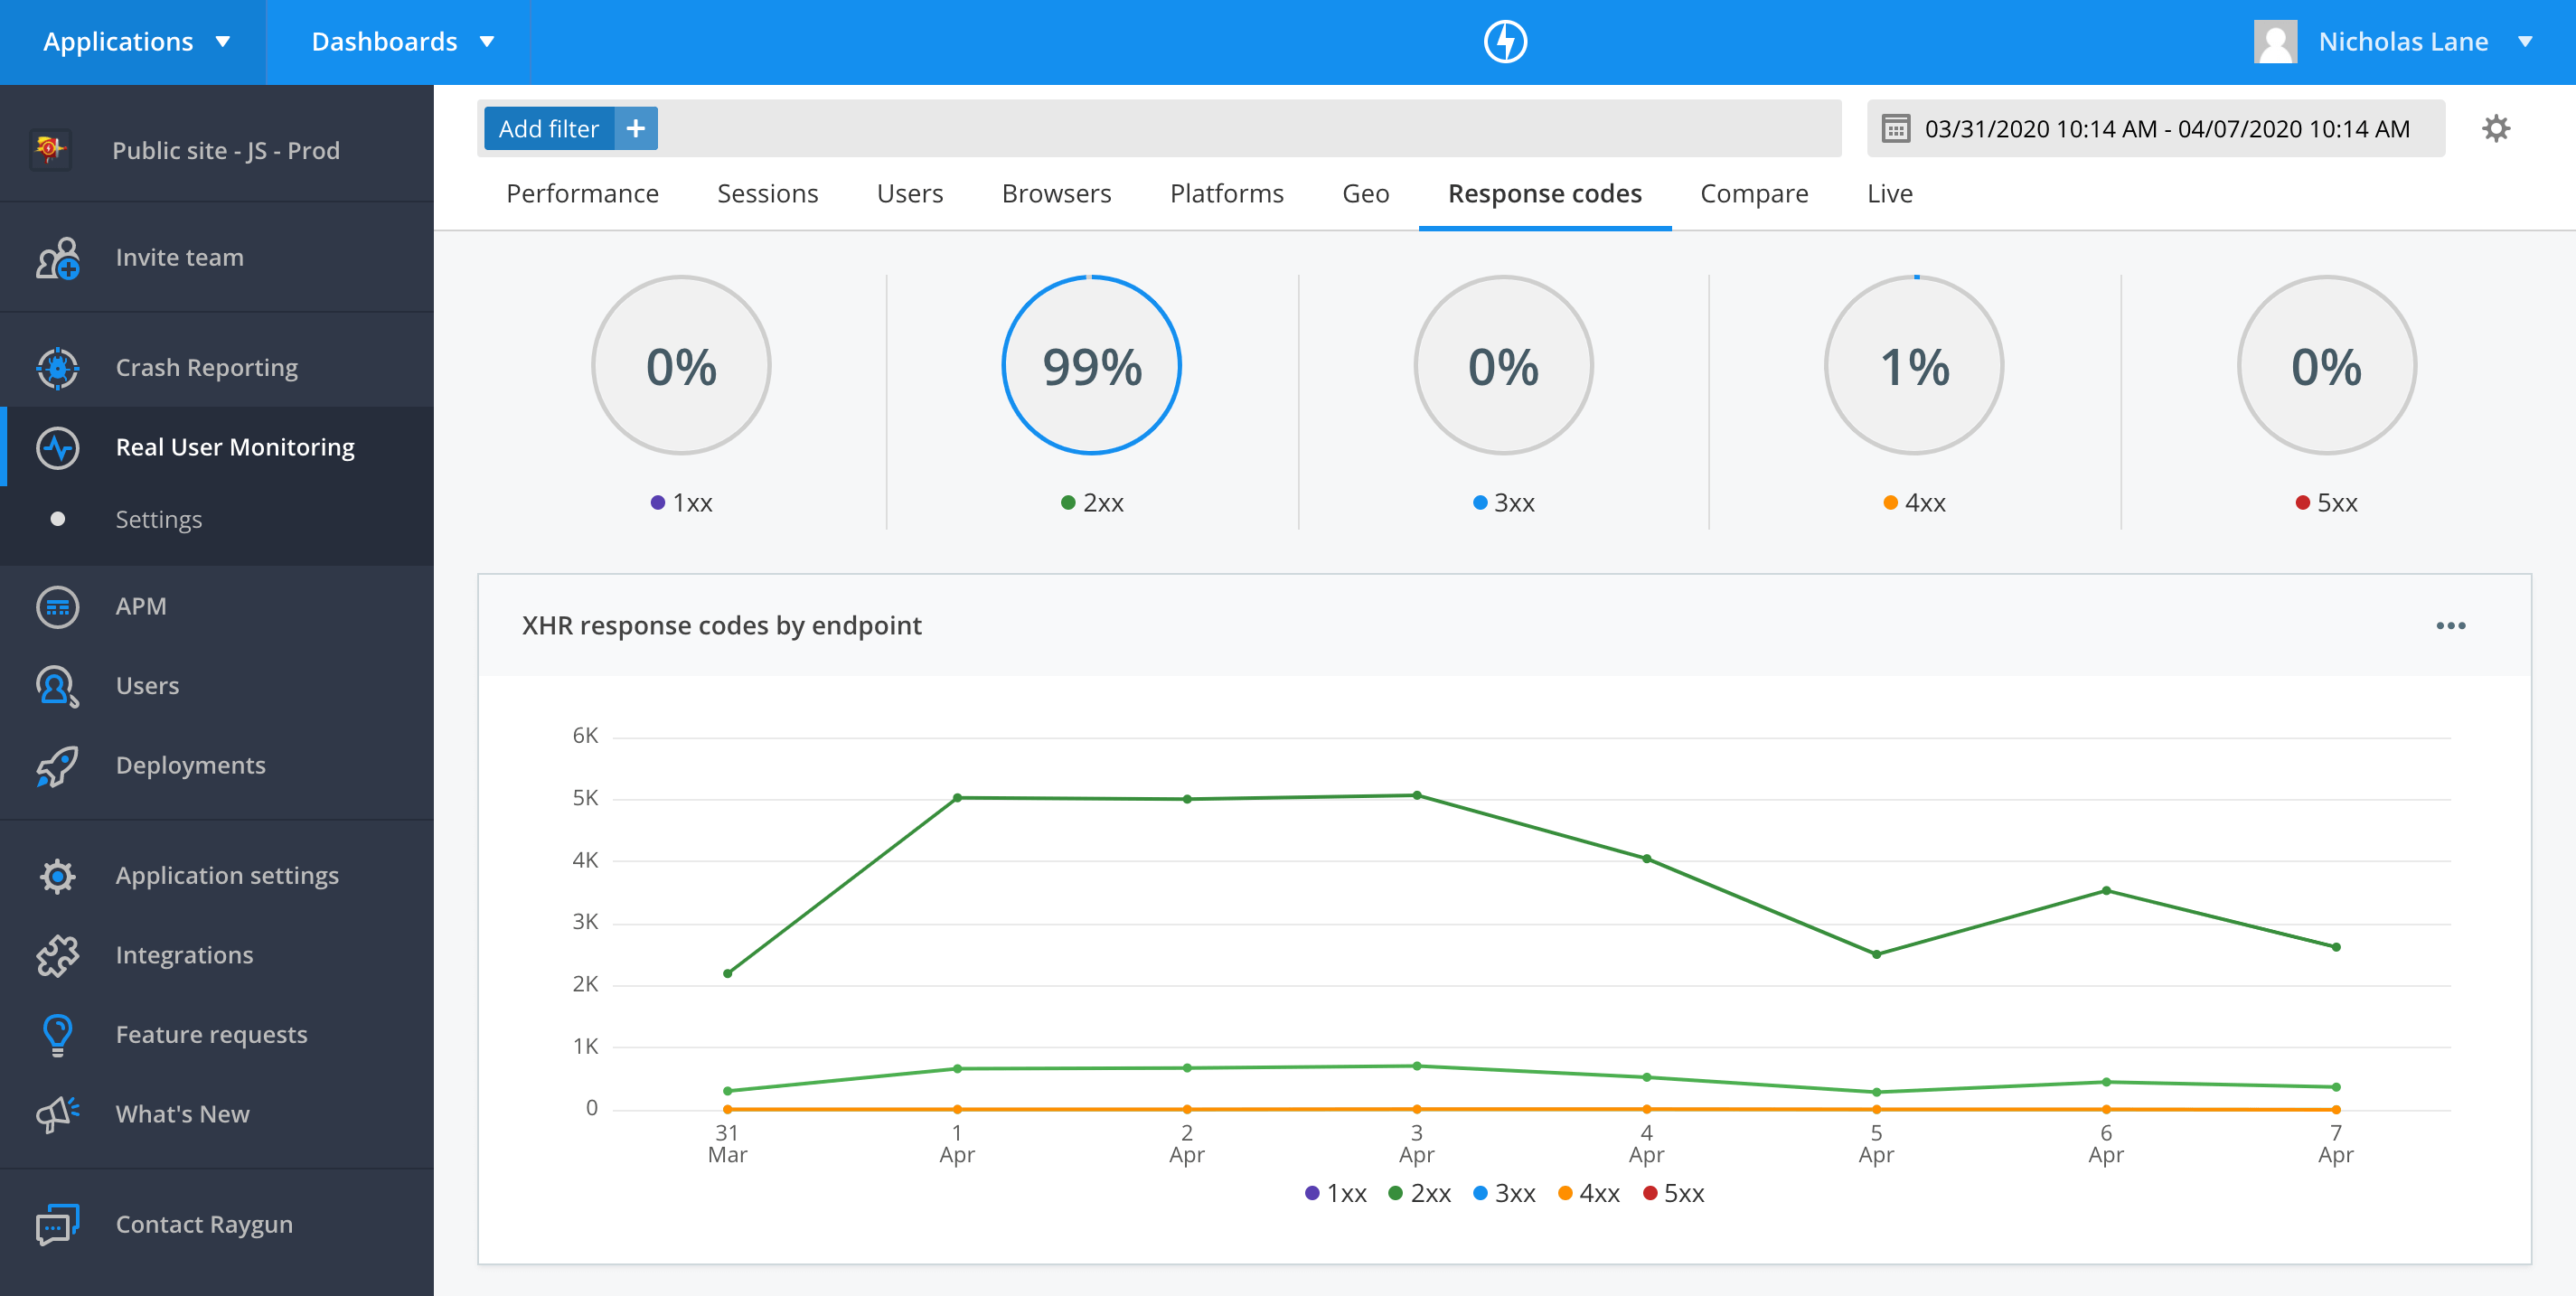
Grouped breakdown
The percentage of total response codes each response code group represents is shown in the breakdown gauges at the top of the page.
These groups are determined by the response code categories each response code falls within. Allowing you to see at a glance what the majority of responses are.
XHR response codes by endpoint
This chart shows you the trends in response codes from XHR calls in your application over the select time range.
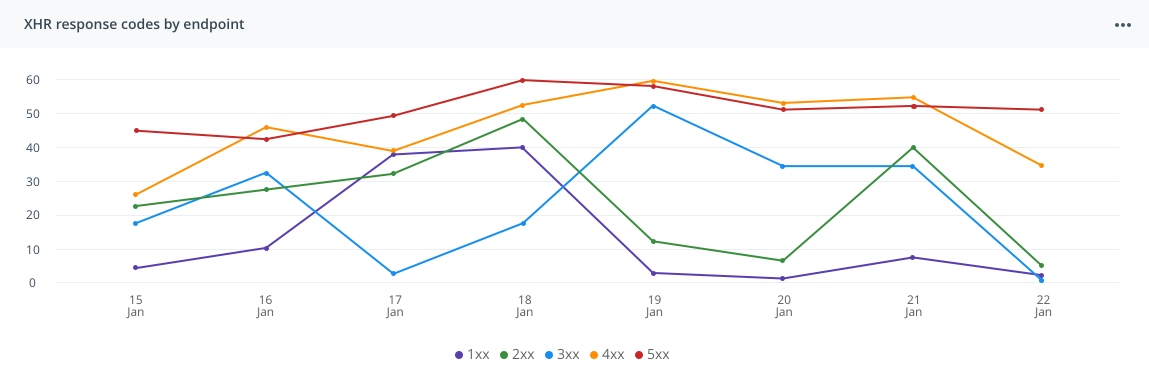
There are three toggles to provide different visualisations of the data, explained below. These toggles can be found in the three dots in the top right hand corner of the chart.
Top 5 occurring
This toggle can be used to show trends in the top 5 most occuring response codes.
Grouped
This graph groups response codes to visualise trends in a particular category.
Grouped & Stacked
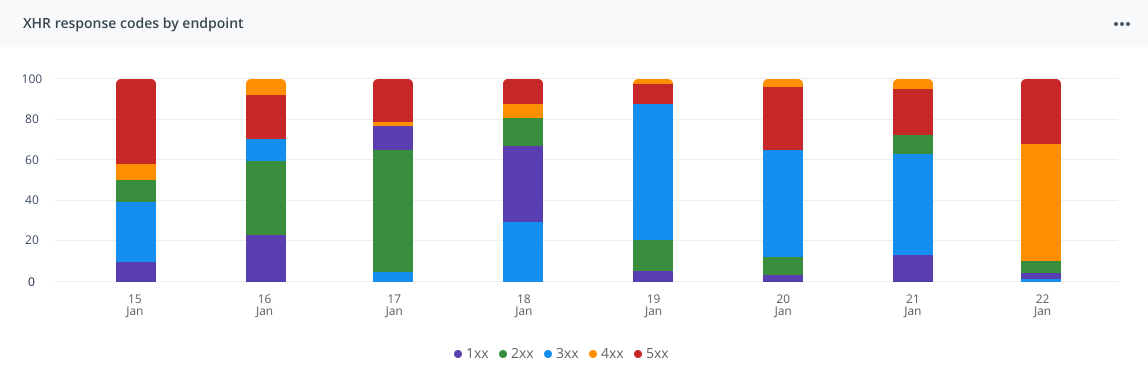
This chart visualises the trends in the percentage of total responses each response code group represents.
Response codes table
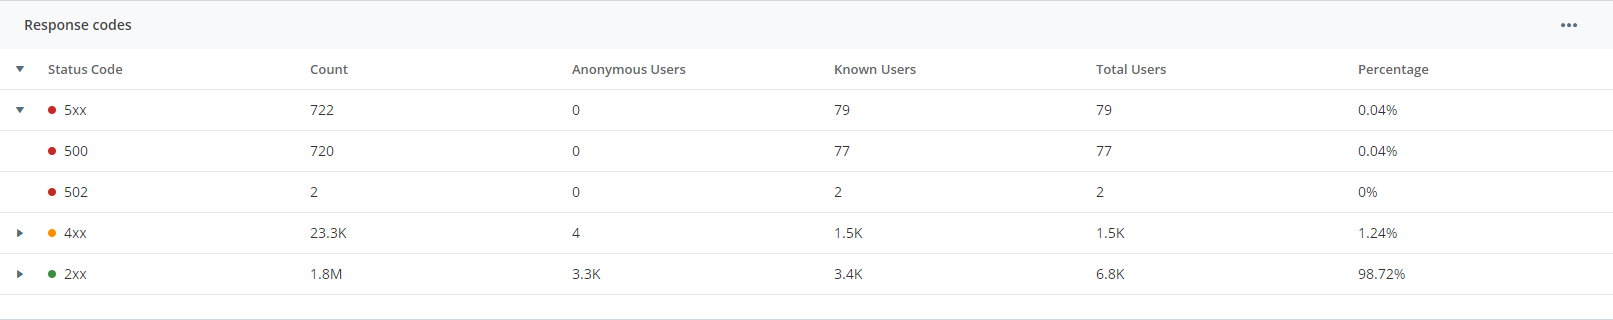
This table displays all response codes captured for the given timerange, along with the following statistics on each:
- Count (number of times that response code was returned)
- Anonymous Users (count of anonymous users who recieved that response)
- Known Users (count of known users who received that response)
- Total Users (total count of users who received that response)
- Percentage (the percentage of total responses that code or group represents)
Response codes by URI table
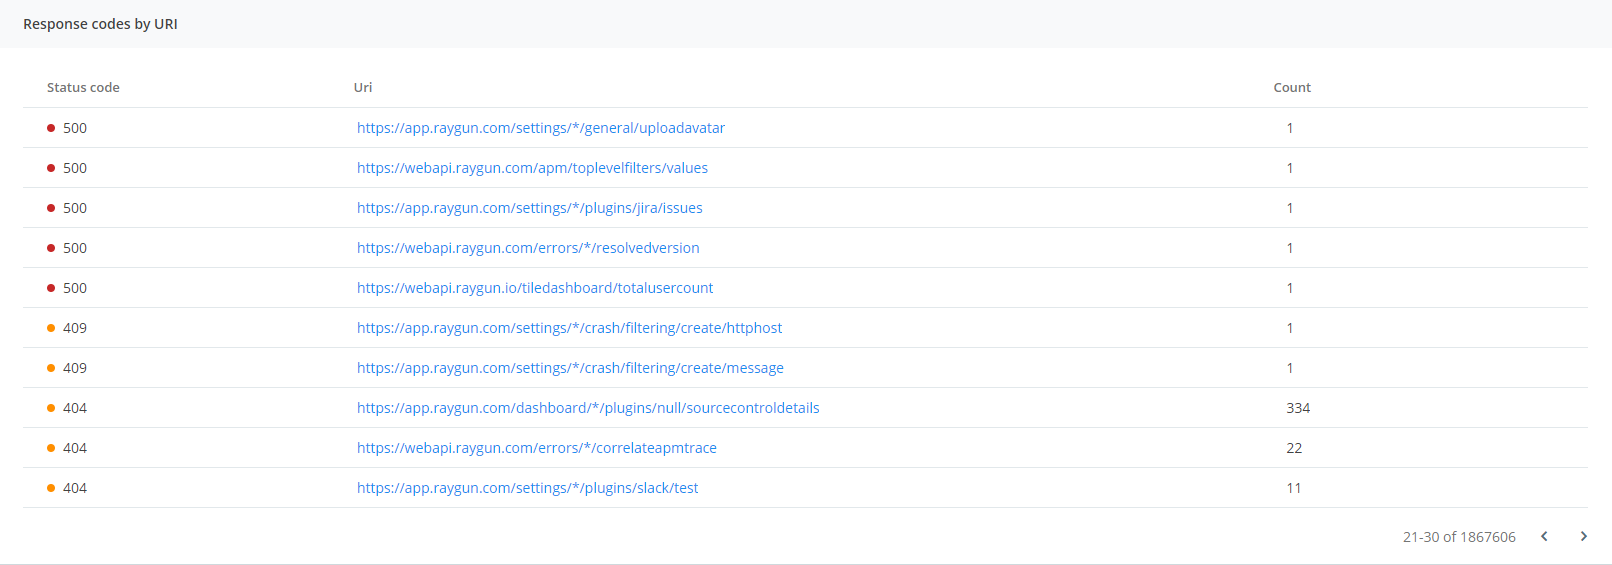
This table displays response codes grouped by URI and the number of occurences.
Click on the URI to see the performance over time for that XHR call.
Top level filters
To drill into response codes based on specific variables like the browser, operating system or location of a user you can apply top level filters to the response codes page.
You can find more information on how to use these filters in the top level filters documentation.
Capturing missing requests
RUM uses the window.performance API to track XHR timing information. Not all non-2XX XHR timings are recorded by this API, depending on the browser. This option enables the tracking of these missing XHR's calls by tracking the difference between send & success XHR handlers.
note: Note: We do not gaurentee the same accuracy with this method as the performance API. Hence this is an optional configuration.
To enable the capturing of missing requests, set the captureMissingRequests function to true.
rg4js('options', {
  captureMissingRequests: true
});