Error instance page
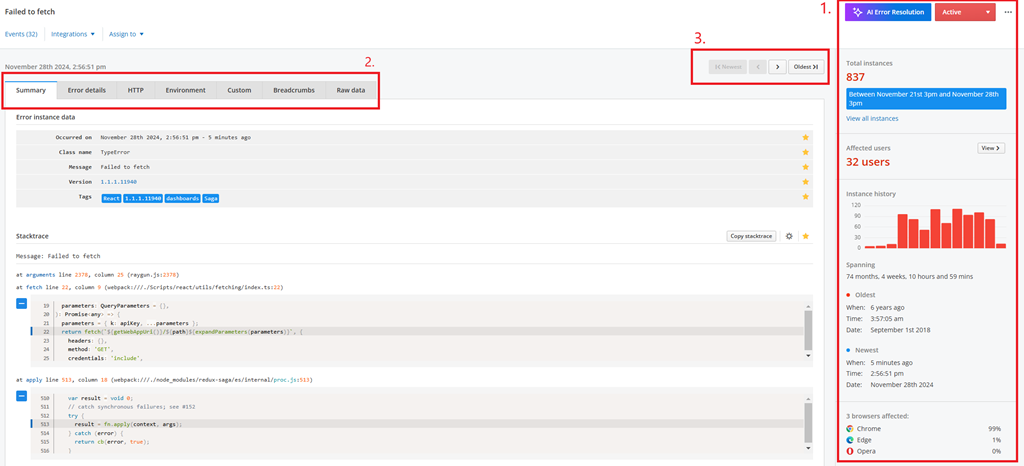
The error instance view gives a clear view of the crash details, the events that led up to it, and tools to manage the error group. Head to the Crash Reporting dashboard and select an error group to open its error instance page.
Location

The right-hand panel (1) provides general information about the error group and offers actions to resolve it. The central panel (2) is organized into sections (tabs) such as Summary, each showcasing specific details. Below each section, you’ll find error group status updates and comments from team members. Use the arrows (3) to navigate through all error instances in the group.
Summary
The summary tab briefly describes the error instance and is customizable.
Error details
The Error Details tab provides vital information, including the time, type of error, and full stack trace.
You can use the Copy stack trace button to copy the stack trace to your clipboard in a format compatible with tools such as JetBrains Rider and Visual Studio’s Stack Trace Explorer.
You can also reverse the stack trace using the Reverse stack trace option, letting you view the trace from bottom to top.
HTTP
If available, the HTTP tab shows information associated with the error instance.
Environment
The Environment tab shows details about the device, operating system, and browser where the error instance occurred.
Custom
The Custom tab lets you attach contextual information to error instances for better clarity.
Session
The Session tab offers an in-depth view of the user experience leading up to and following the error. This feature is part of Real User Monitoring.
Breadcrumbs
The Breadcrumbs section tracks granular events, such as DOM updates, to help pinpoint exactly where the error occurred. Check out the breadcrumbs documentation for more details.
Raw Data
The Raw Data section contains all the information about the error instance sent by the Raygun provider in its raw form.