Discover
The discover page shows a list of your application's slowest and most popular requests, methods, queries and API calls. Use this page to identify slow transactions that could benefit from a performance fine-tuning.
Getting started
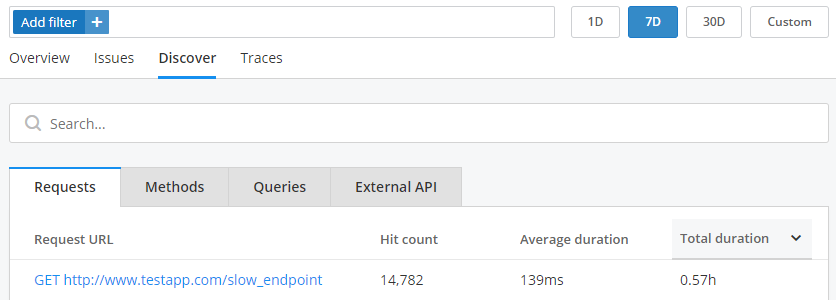
Requests, methods, queries and API calls during the given period are sorted by total duration. To learn more click on a request URL, method, query or API name to view its detail page.
Requests
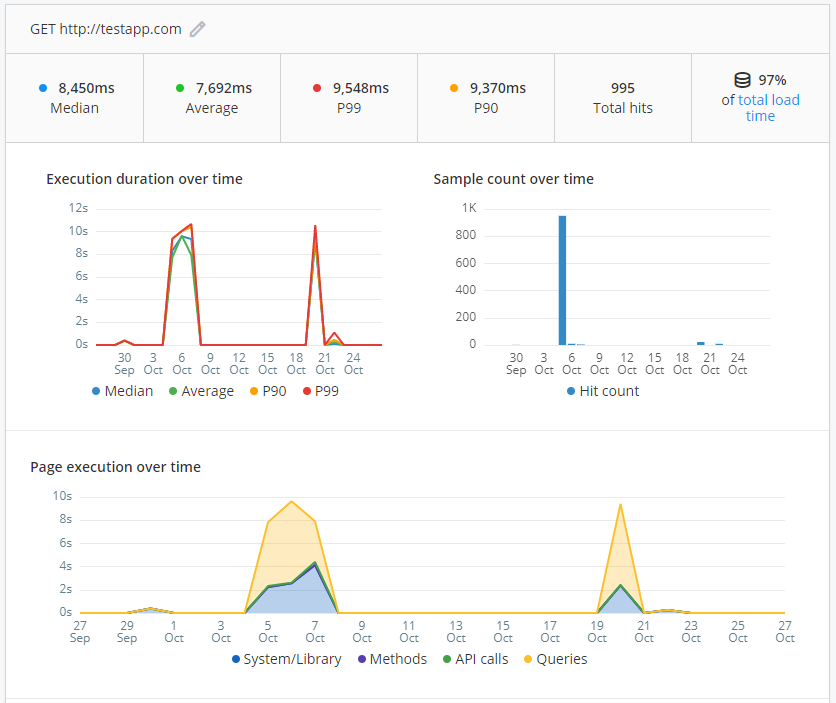
On the request detail page you will see the execution duration over time, sample count over time, page execution over time, call tree distribution, and the traces associated with this request.
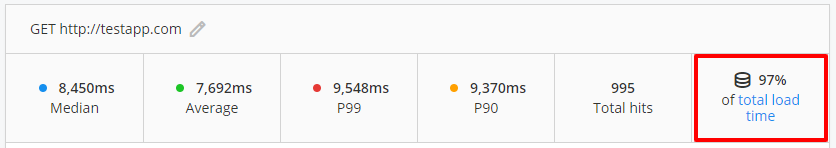
Server load time
If Real User Monitoring is enabled the server load time metric will be fed automatically into Raygun APM. This metric is used to determine if a slow request was caused predominantly by your server or your front-end/mobile layer.
Clicking the blue link will take you to the page performance details in Raygun Real User Monitoring where you can view the full load time distribution information for this request.
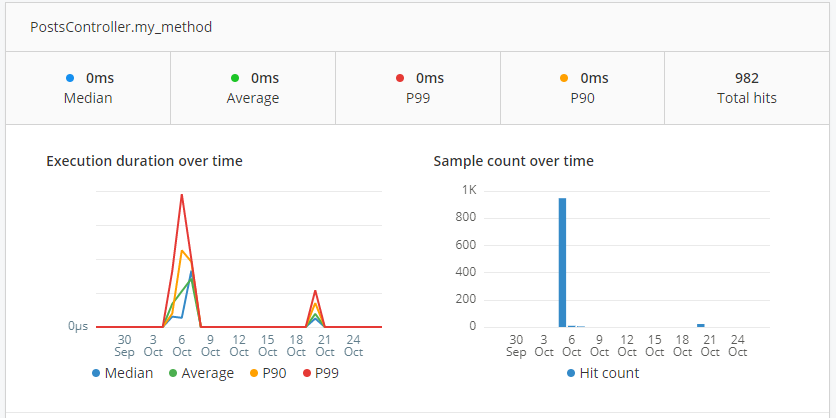
Methods
On the method detail page you will see the execution duration over time, sample count over time, and traces associated with this method.
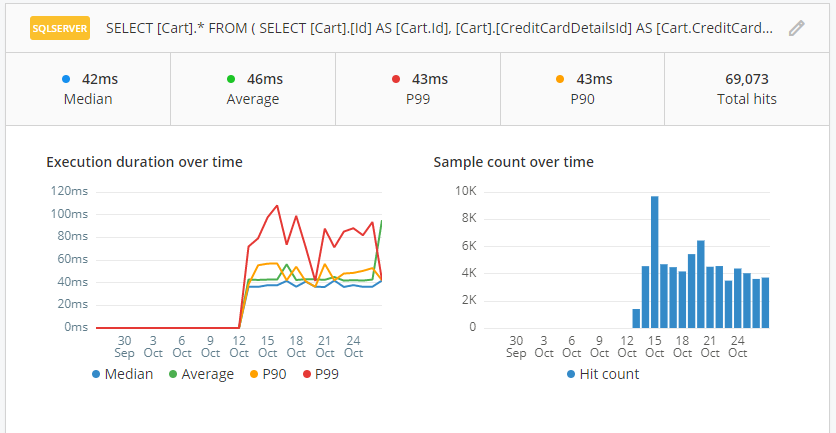
Queries
On the query detail page you will see the execution duration over time, sample count over time, and traces associated with this query.
External API
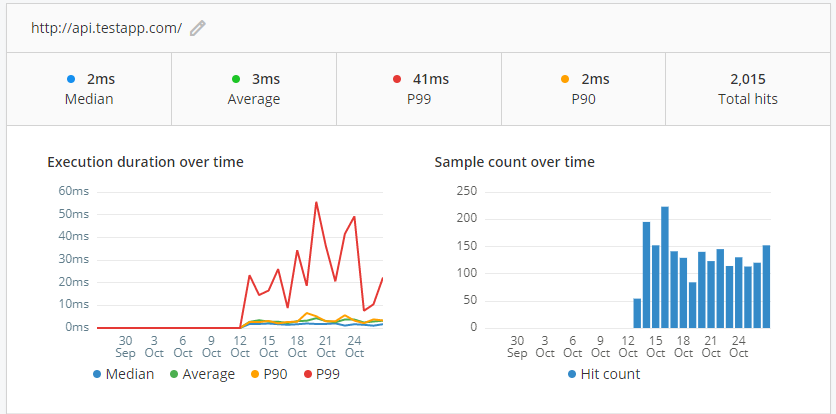
On the API call detail page you will see the performance details of this API call including execution duration over time and sample count over time.