Custom timings
Custom timings in Real User Monitoring (RUM) enables you to track the exact performance metrics which are relevant to your software. This documentation provides an overview of custom timings alongside examples of how you can use it with common libraries.
Custom timings works for all web applications, static pages and single page applications.
Custom timings graph
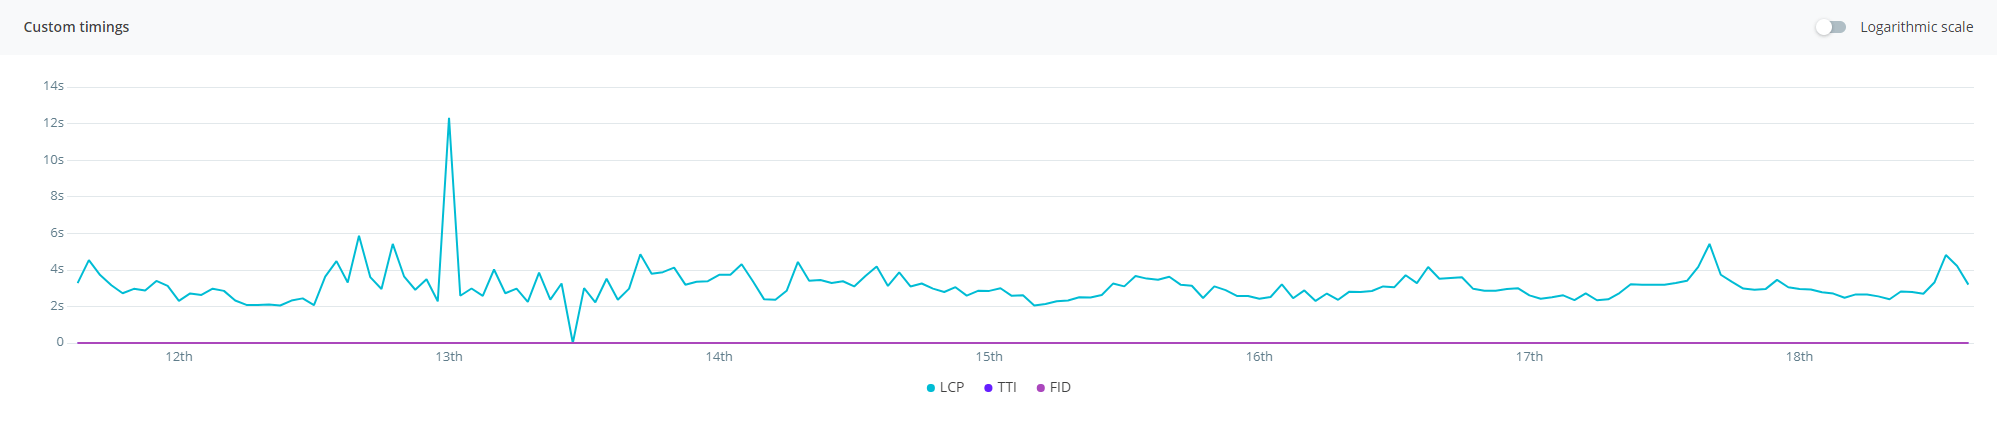
tip: You can view custom timings by drilling into a particular page or virtual page in the performance tab.
Each timing displayed is an average. You can hide each timing by clicking the corresponding label in the key at the bottom of the graph.
The logarithmic scale switches the Y-axis into a logarithmic scale. This helps if the graph contains large timings which are flattening the graph.
We support a maximum number of 8 custom timings per application.
Tracking custom timings
Adding a custom timing is straight-forward, requiring just a name and duration.
rg4js('trackEvent', {
  type: 'customTiming',
  name: 'timeToInteractive',
  duration: 1200,
});
Further instructions for setting up custom timings can be found in our language guide.