Link back to source from GitHub, Bitbucket and GitLab
Posted Jan 26, 2021 | 3 min. (618 words)Raygun Crash Reporting gives you the deep diagnostic details you need to fix an error quickly and efficiently. When an error is thrown by your application, the error details appear in your dashboard under the ‘Summary’ tab where you can find the stacktrace details.
Having this information available is really important for efficient error management. However, some of our customers need better access to the stacktrace information for an even faster fix. For example, you may find moving between your repo and your stacktrace data tedious and messy, especially when dealing with lots of files and having to copy and paste the path.
Raygun Crash Reporting has made this easier by creating a link back to source for GitHub, Bitbucket and GitLab to make error resolution easier and faster. As an extra bonus, if you have deployment tracking set up in Raygun Crash Reporting, these links back to the source will also point to the correct revision of the code in your hosting service.
Before we get started, make sure Crash Reporting is integrated with your web-based hosting service for source code. Here are the detailed instructions:
- Integrating Raygun Crash Reporting with GitHub
- Integrating Raygun Crash Reporting with Bitbucket
- Integrating Raygun Crash Reporting with GitLab
Once you’re integrated, you’ll be able to see the link back to source inside your Crash Reporting stacktrace data. Here’s where to find the link for GitHub, Bitbucket and GitLab:
Link back to source: GitHub
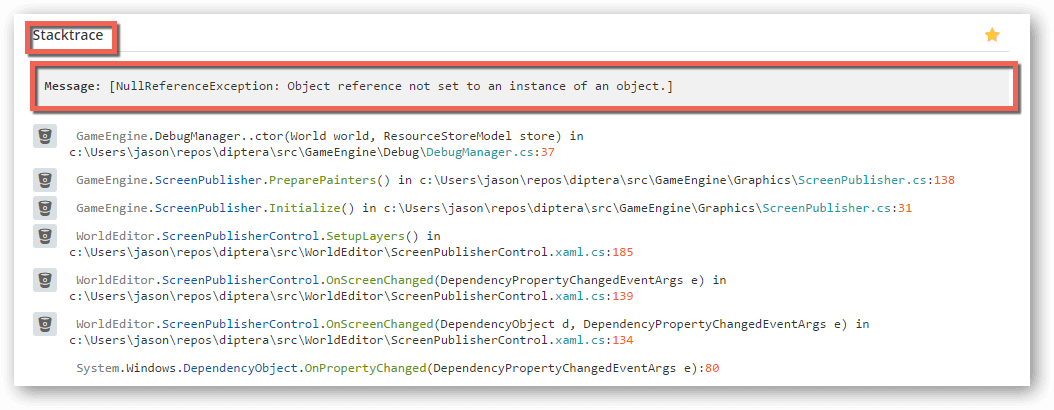
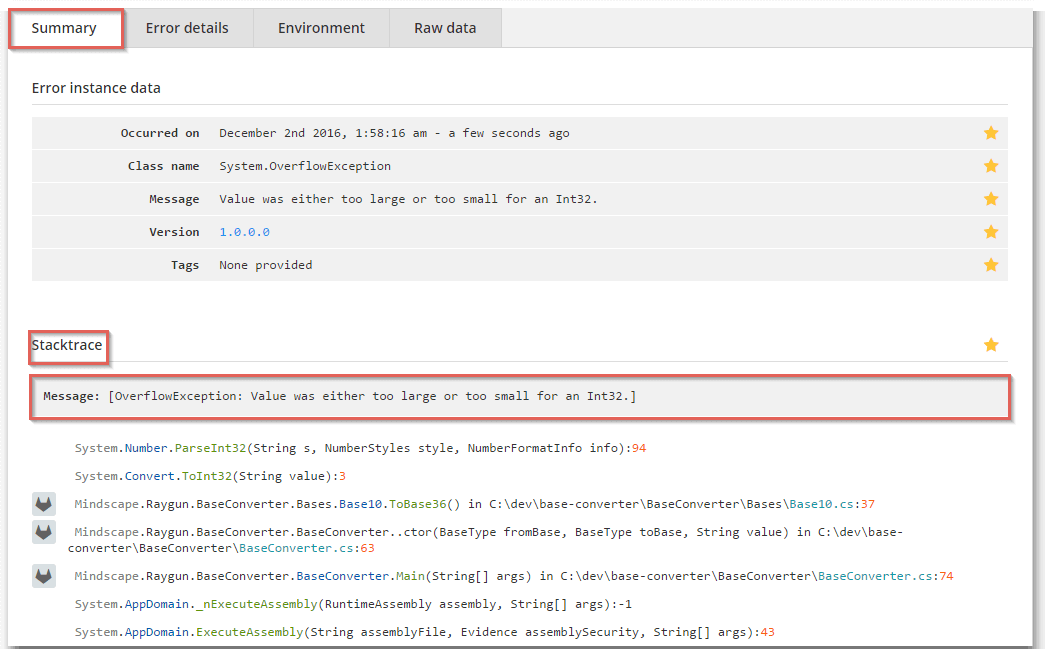
Inside your Raygun Crash Reporting Summary tab, you can see the stacktrace information:
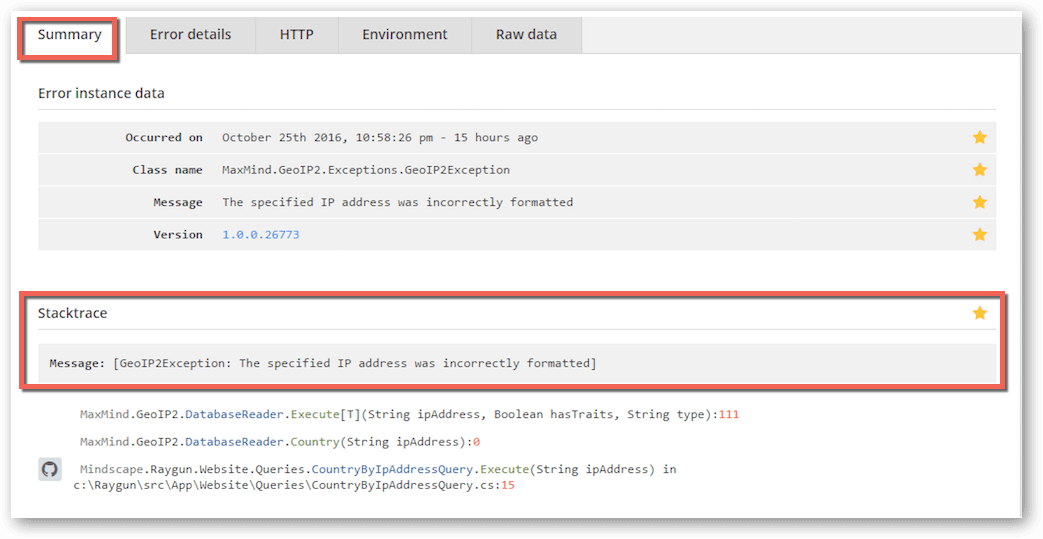
If you have the GitHub integration enabled, you will see the GitHub icon to the left of the stacktrace:
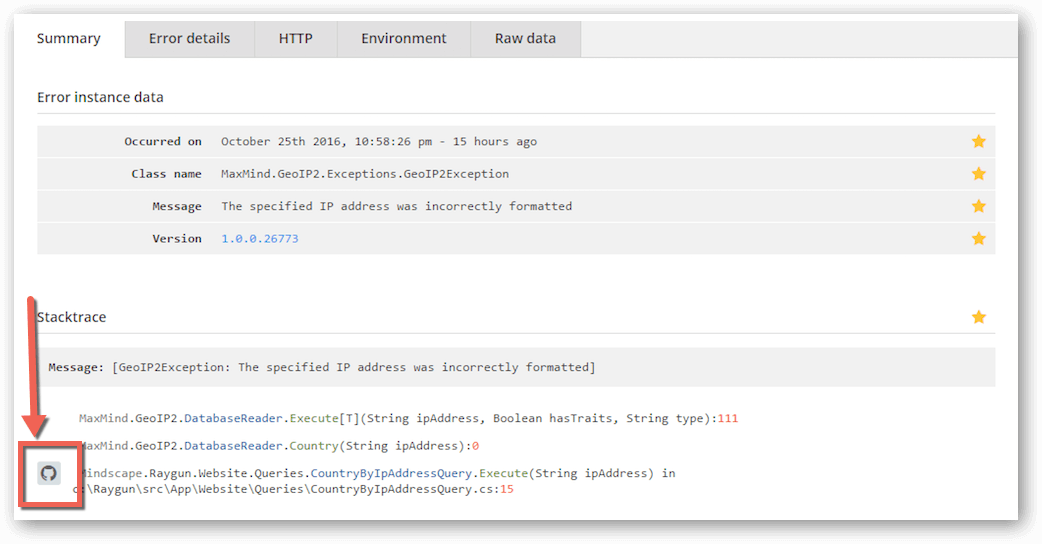
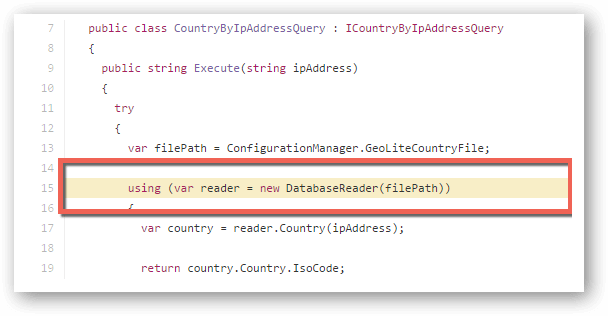
Click on the GitHub icon (which acts as the link back to source.) A new browser tab will open in GitHub which clearly highlights the line of code for that particular stacktrace frame. In this example, you can see the error has occurred on line 15:
From identifying the error, it’s easy to go ahead with your usual debugging process.
Link back to source: Bitbucket
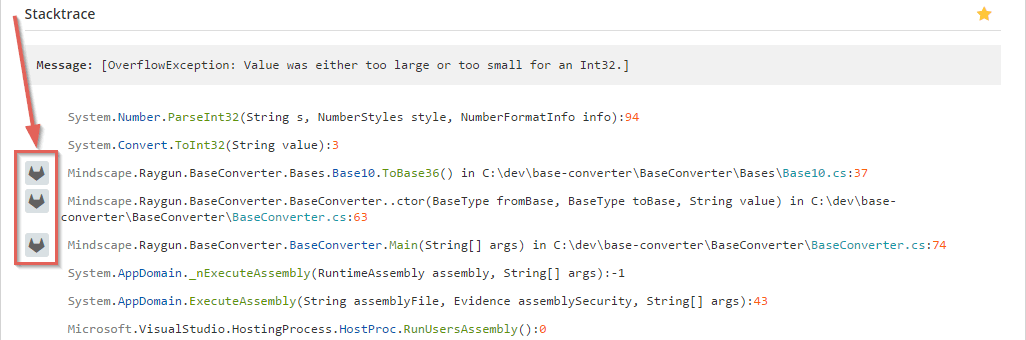
Inside your Raygun Crash Reporting Summary tab, you can see the stacktrace information:
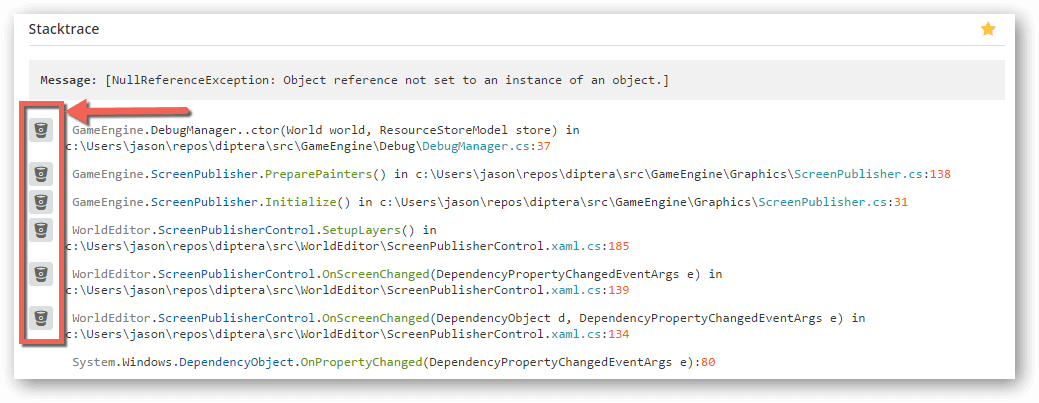
If you have the Bitbucket integration correctly enabled, you will see the Bitbucket icon to the left of the stacktrace:
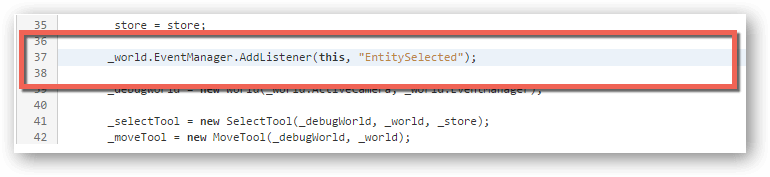
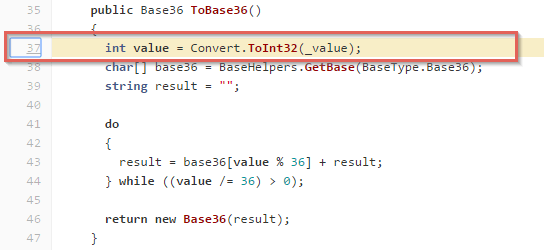
Click on the icon (which acts as the link back to source) to open a new browser tab in Bitbucket. Bitbucket will clearly highlight the line of code for that particular stacktrace frame in the new browser tab. In this example, the error has occurred on line 37:
Now you can go ahead with your usual debugging process.
Link back to source: GitLab
Inside your Raygun Crash Reporting Summary tab, you can see the stacktrace information:
If you have the GitLab integration correctly enabled, you’ll see the GitLab icon to the left of the stacktrace.
Click on the icon (which acts as the link back to source) to open a new browser tab in GitLab. GitLab will clearly highlight the line of code for that particular stacktrace frame in the new browser tab. In this example, the error has occurred on line 37:
From identifying the error, simply go ahead with your usual debugging process.
Whether you use GitHub, Bitbucket or GitLab as your hosting service, getting the information you need for a fast fix is even easier. With GitHub, GitLab and Bitbucket links back to source, opening the frame information in separate browser tabs allows for faster movement between the high level overview and stacktrace information. No need to get lost when resolving errors; the source code is now integrated to your stacktraces.
Do you need help setting up link back to source? Get in touch with a friendly team member here. We’d be happy to help.