Announcing Ruby support for Raygun APM
Posted Oct 6, 2020 | 7 min. (1338 words)We’ve built Raygun APM to be the best solution on the market today, with more code-level detail, better visualization, and powerful infrastructure that helps developers discover and diagnose performance bottlenecks in a fraction of the time — and for a fraction of the cost.
That’s why we are thrilled to launch the next chapter in our ongoing support for Application Performance Monitoring: Ruby support for Raygun APM. Ruby teams can now get end-to-end monitoring with features like detailed trace transactions, dashboards, code execution, and more.
These features normally cost thousands per month with a traditional APM tool. But with Raygun’s usage-based pricing model, you can now get sophisticated Ruby performance monitoring for a more efficient price — no matter what your environment looks like.
How is Raygun APM different?
When we first launched APM, we knew we needed to be better than other APM solutions on the market.
As a technical team ourselves, we know that many APM tools fail to give meaningful data to developers, making debugging and troubleshooting time-consuming. What’s more, current pricing models make traditional APM tools inaccessible to companies operating in modern development environments.
We built Raygun’s APM from the ground up with these problems top of mind, which is why we can say that we are different. Raygun is a developer-friendly product that excels in delivering the necessary details needed to fix problems quickly, without the heavy restrictions traditional tools carry.
Our latest support for Ruby also reflects that.
“With our previous APM tool, we struggled to correlate the problem to cause. Raygun APM doesn’t just tell you what is slow, it tells you why.”
Vidar Sømme, Chief Development Officer, Vetserve
Find and solve Ruby performance problems fast
We’ve put a lot of thought into how developers will use this every day. We know that when there’s a lot of data flowing, charts can get overwhelming and it can be difficult to discover, prioritize, and resolve issues.
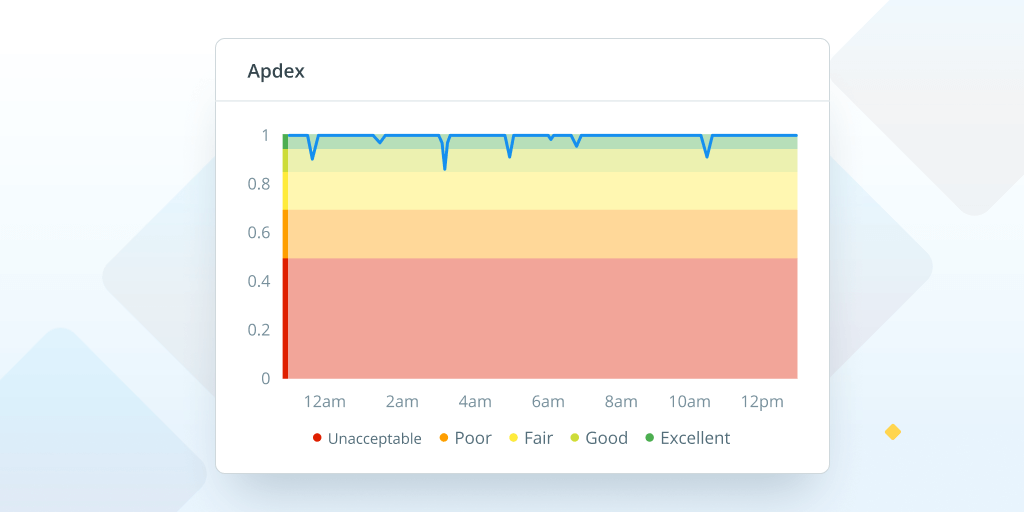
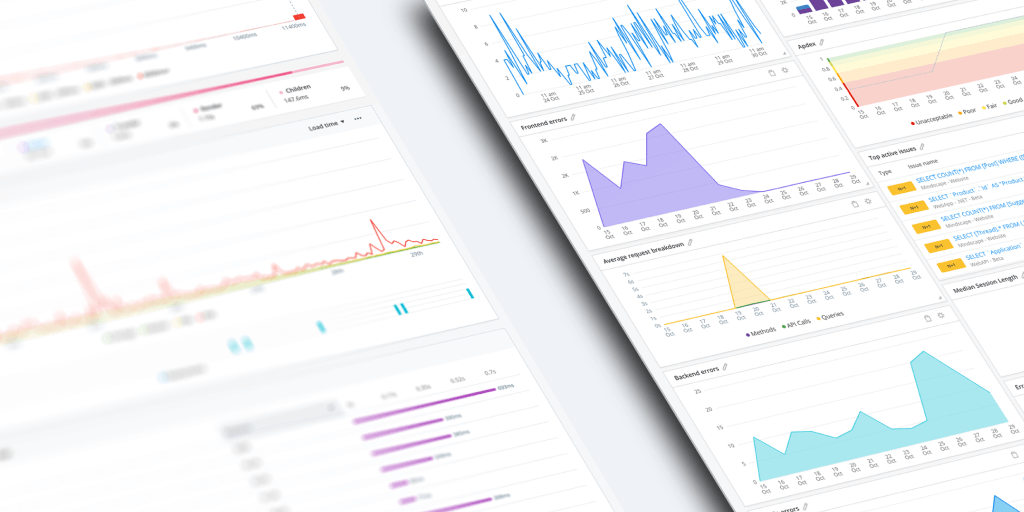
When you’re in the discovery phase, the customizable Overview page visualizes all the high-level data you need to spot performance trends over a certain time. Monitor Apdex score, slowest requests and methods, active issues, and more for full visibility into your application performance.
If you’re not sure where to start, our unique automatic issue creation engine curates a list of your most urgent performance issues for you, sorted by priority.
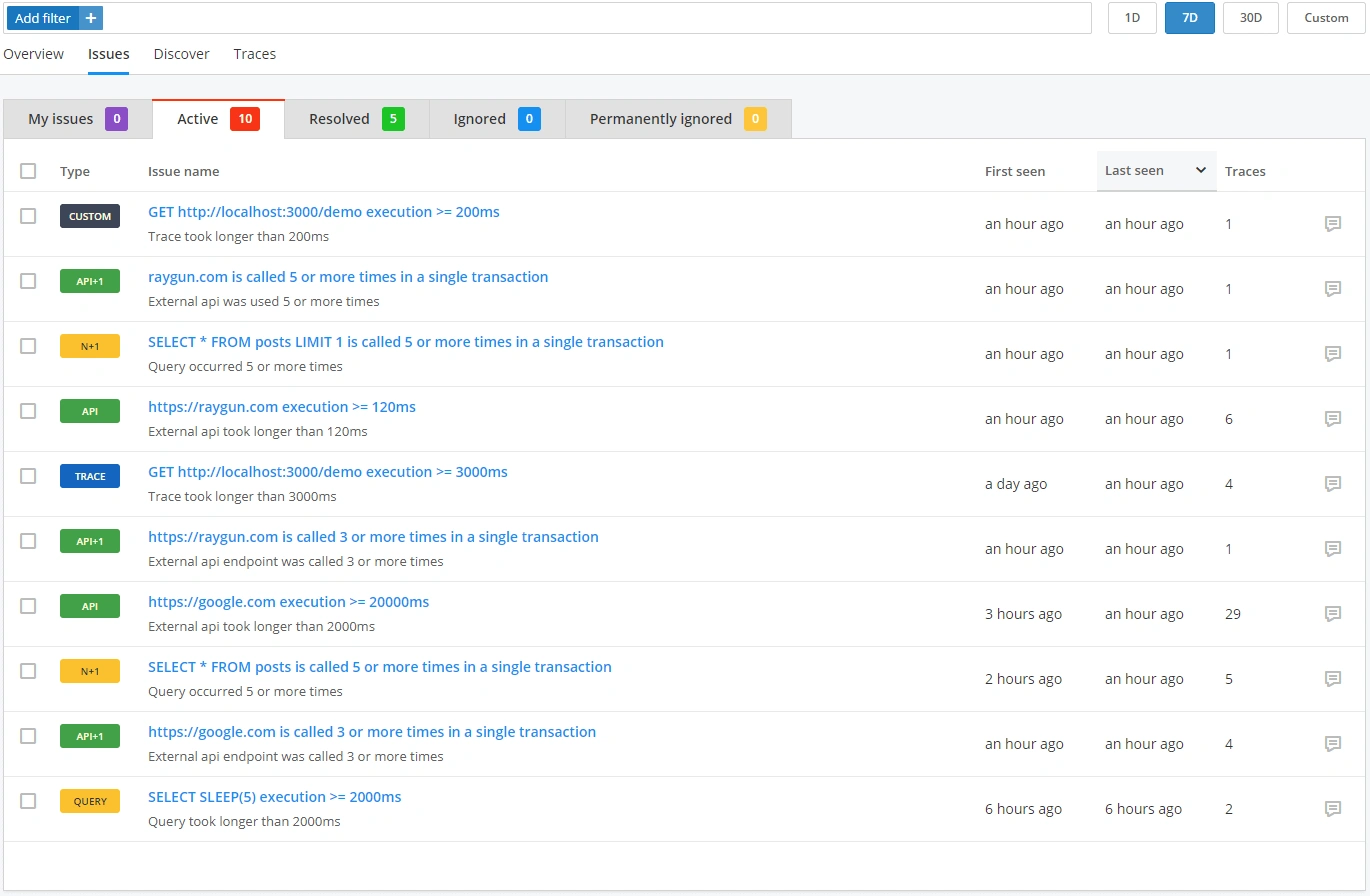 Raygun’s issue detection engine helps you to prioritize and sort issues
Behind the scenes, there are many causes of poor performance, and you’ll want to find and resolve them as quickly as possible before they affect your customers. With Raygun APM, getting more actionable detail into an issue has never been easier.
The Traces page of Raygun APM is where you can find all the traces for your application so you can start to drill down into the specifics.
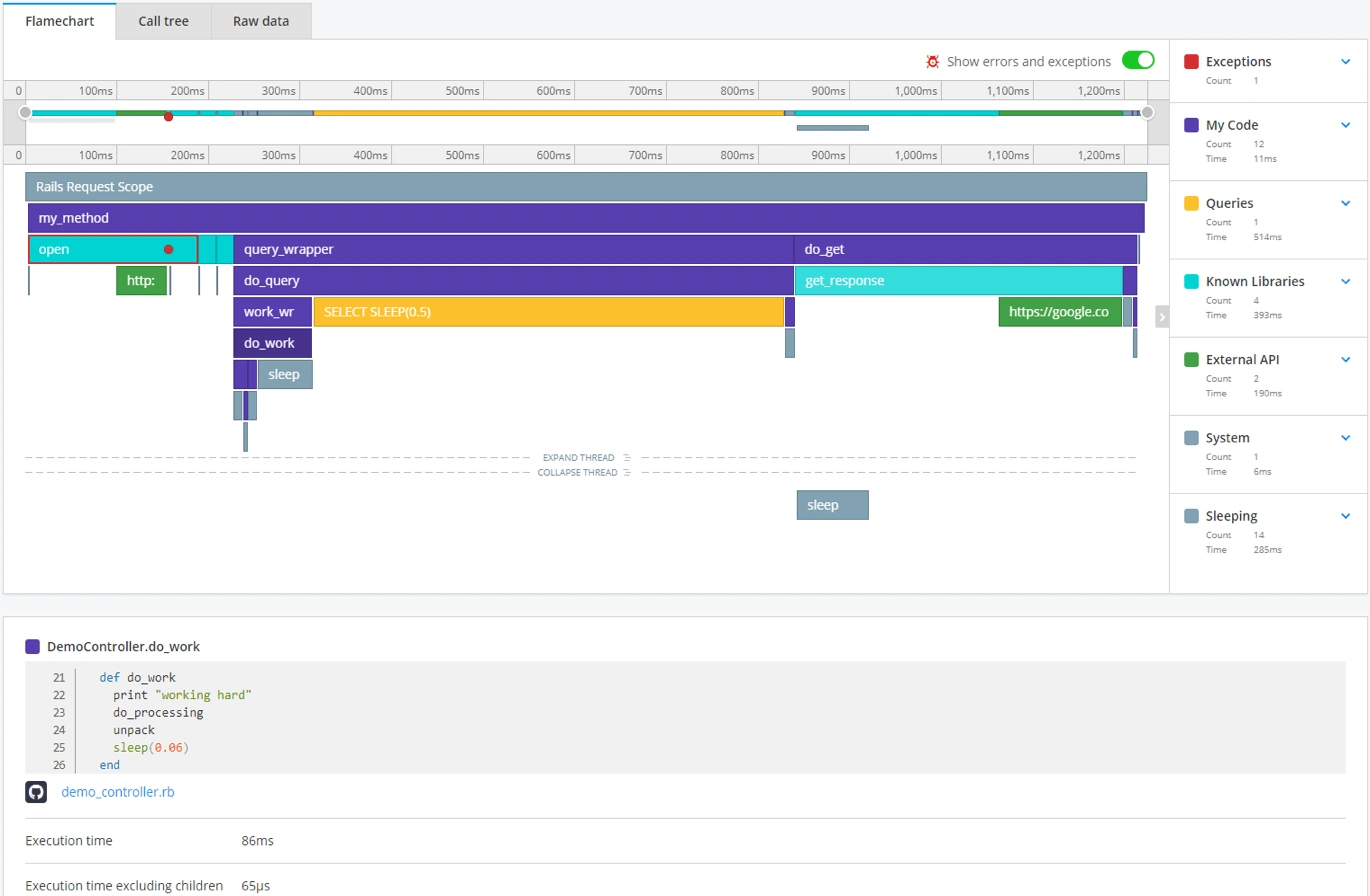
Clicking on an individual trace will take you to the flame chart which shows you the state of your code at every millisecond during the performance profile. This gives you a way to know exactly which function was executing at any point during the recording, how long it ran for, and where it was called from.
The flame chart allows you to visualize your code rather than just using a call tree view. Once you’ve isolated the issue, drill down into the details of the call, such as the execution time, parent percentage, duplicates, and hotpath. The detail doesn’t end there — the GitHub integration will link you to the exact line of code.
At the end of the day, Ruby developers want to build fast and efficient applications. This resolution workflow helps you deliver great work and avoid spending too much time debugging and tracking down issues.
Raygun APM is built for Ruby
Raygun APM works harmoniously with Ruby so you can optimize application performance. With this release, we’ve baked in specific features that support faster trouble-shooting for Ruby apps.
Monitor SQL queries
Raygun APM provides excellent support for filtering and drilling down into SQL performance metrics.
Keep tabs on HTTP API calls and how it affects your application
Services and applications, especially in modern cloud computing paradigms and microservices oriented deployments, coexist with others. The Raygun APM platform has great support for tracking and creating rules for external HTTP API calls.
Support for tracing Sidekiq background jobs
Sidekiq uses threads to handle many jobs at the same time in the same process. Discover performance problems in Sidekiq threads quickly.
Support for Heroku with a Buildpack
Raygun APM offers seamless integration with the Heroku platform via a Buildpack, so you can get all the benefits of APM for your Rails app.
Reduced overhead
We built APM using a fast communication protocol and optimized code to reduce the profiling overhead. This allows us to emit detailed trace information for Ruby apps with a low performance impact.
While these features help to get granular into performance problems, how do you know if they have made an impact on the real people using your website? Our Real User Monitoring (RUM) solution enabled alongside APM answers these questions and more.
Understand how server-side performance impacts users with APM and RUM
With Raygun APM, you can combine server-side timings with front-end performance data from RUM to get a complete view of your user experience. Once you integrate with RUM for a small additional fee, you won’t be left trying to manually correlate user data between tools, and you’ll be able to assign dev resources to where it matters the most.
In the video below, you can see that Raygun APM detected a problem. Watch how you can click through to Real User Monitoring to see the performance breakdown of the page, including the server percentage of load time.
Accessible pricing for modern development teams
Raygun offers sophisticated yet cost-effective application performance monitoring across the whole stack, no matter if you are using microservices or monolithic architectures. Our usage-based pricing starts at just $8 per month.
Integrations available on release
Raygun APM for Ruby works with your current development environment and already has all of the features you need to diagnose issues quickly. Slack, Jira, and GitHub integrations are all available today, with more being released soon.
Slack
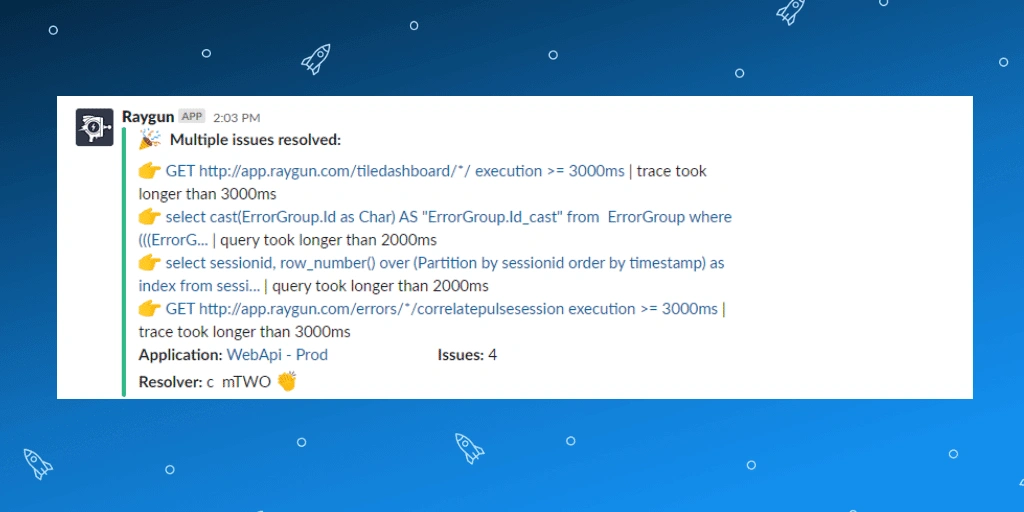
Report issues directly into a specific channel where you can assign, ignore, or resolve issues directly in Slack. Advanced filtering makes sure you are only alerted to the issues that matter.
Jira Software
There’s no need to copy-paste contextual information about errors into tickets in Jira. Create a new issue or add information to an existing issue in just a couple of clicks. All the information you and your team need to resolve the error will appear on the ticket.
GitHub
Raygun’s source code integration with GitHub links the diagnostic details captured to the source code in your GitHub repository for faster resolution.
If you’d like to read more about our integrations, you can head to our documentation.
How to get set up with Raygun APM for Ruby
It’s easy to get started with our lightweight agent. Simply take a free 14-day trial today.
Here are some quick links for getting set up.
You can find all the below instructions in the Getting Started documentation:
- Agent installation guides
- Set up the Ruby profiling gem
- Best practices for adding Ruby APM to your workflow
If you need any additional help getting set up, contact our team here.
Raygun’s latest support for Ruby provides end-to-end monitoring capabilities across your entire tech stack. We provide more detail and better data visualization than any solution on the market today. Thanks to our usage-based pricing, you’ll get sophisticated Ruby performance monitoring for a great price, no matter what your architecture looks like.
Raygun APM is currently available for Node.js, Ruby, .NET, Azure App Service, and .NET Core, but watch this space for Java support and more. Request to be notified when your language becomes available.

