SQL Performance tuning: 6 Tips for tuning SQL server
Posted Jun 20, 2019 | 8 min. (1618 words)SQL performance tuning can be a tricky thing. We spend so much time focusing on our business logic, it’s easy to leave the database behind in the dust. But it’s important to keep the DB in mind to maintain quality performance. We need tools in our toolbox to tune our SQL performance. In this post, we map out six tips to help you tune SQL Server.
Spot and resolve slow loading queries faster with Raygun APM
What is SQL performance tuning?
SQL performance tuning is the tried and true practice of changing how our application talks to our relational database so it can be more performant. We want to do this so we can meet our service-level objectives. Tuning also helps us run non-unit tests faster.
The big six
Before us, we have six tips for tuning SQL performance. Each piece of advice doesn’t stand alone. Many of them are connected.
Tip 1: Tailor queries based on business use
Our first tip is that the application should own the database. This allows us to evolve our system independently of other systems that need our data. If we couple with the DB, the chance of incidental breakages skyrockets. When an application owns the database, we want to start with the use cases of the app, not the data that’s being stored.
Below, I’ll describe many benefits of this approach. For example, the fewer fields we grab from the database at a time, the less bandwidth we use and sometimes the quicker the query becomes.
It requires strong collaboration between the development team and the business stakeholders to make this happen, but the payoff is almost always worth it. If we don’t understand our business use, we can actually tune the database to have worse performance. All tuning is subjective to our customer’s behavior.
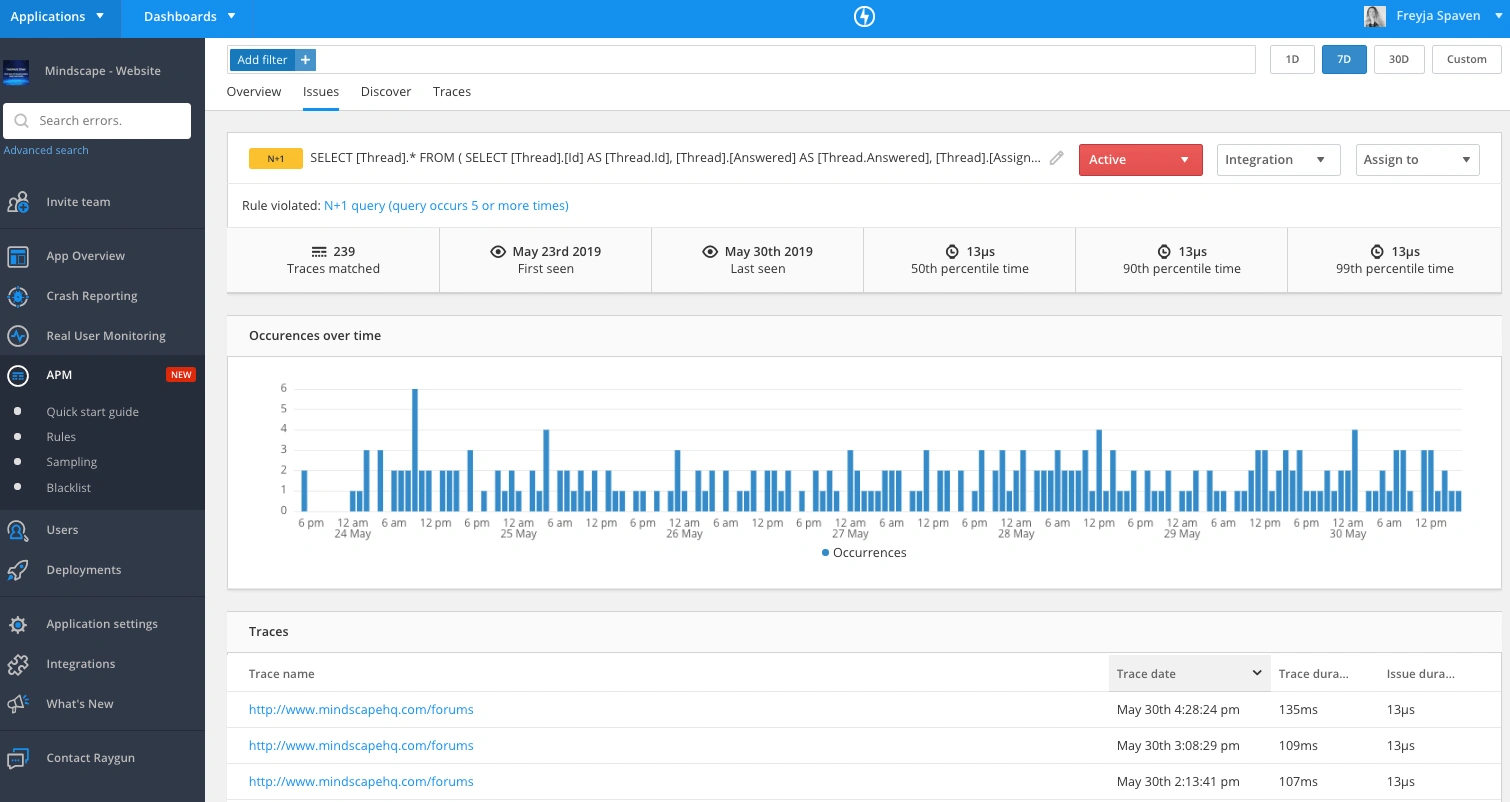
Tip 2: Set up monitoring to quickly identify SQL bottlenecks
All of these tips are quite useless if we have no way to see where our problems are. When we drive a car, we scan our mirrors and check our blind spots to ensure no cars are in our way to change lanes. In the same way, we want something that “checks the mirrors” of the application and can show us where potential database problems may lie. Key places to find DB bottlenecks in our monitoring tool are traffic rates and latency.
With Raygun, you can easily see both throughout your application and break traffic down by endpoints.
Tip 3: Index based on query fields
Indexing based on query fields is one of the most common pieces of advice you’ll get on SQL performance tuning. Indices will keep a list of fields for you to look up way faster than scanning the entire table. What’s the downside? Every index on a table slows down its time to write since we have to update the index every time we update the table. It’s healthy to only choose fields that are queried often across your application. With your monitoring tool in place, you can easily know what those are. They’re usually fields like foreign keys and natural keys.
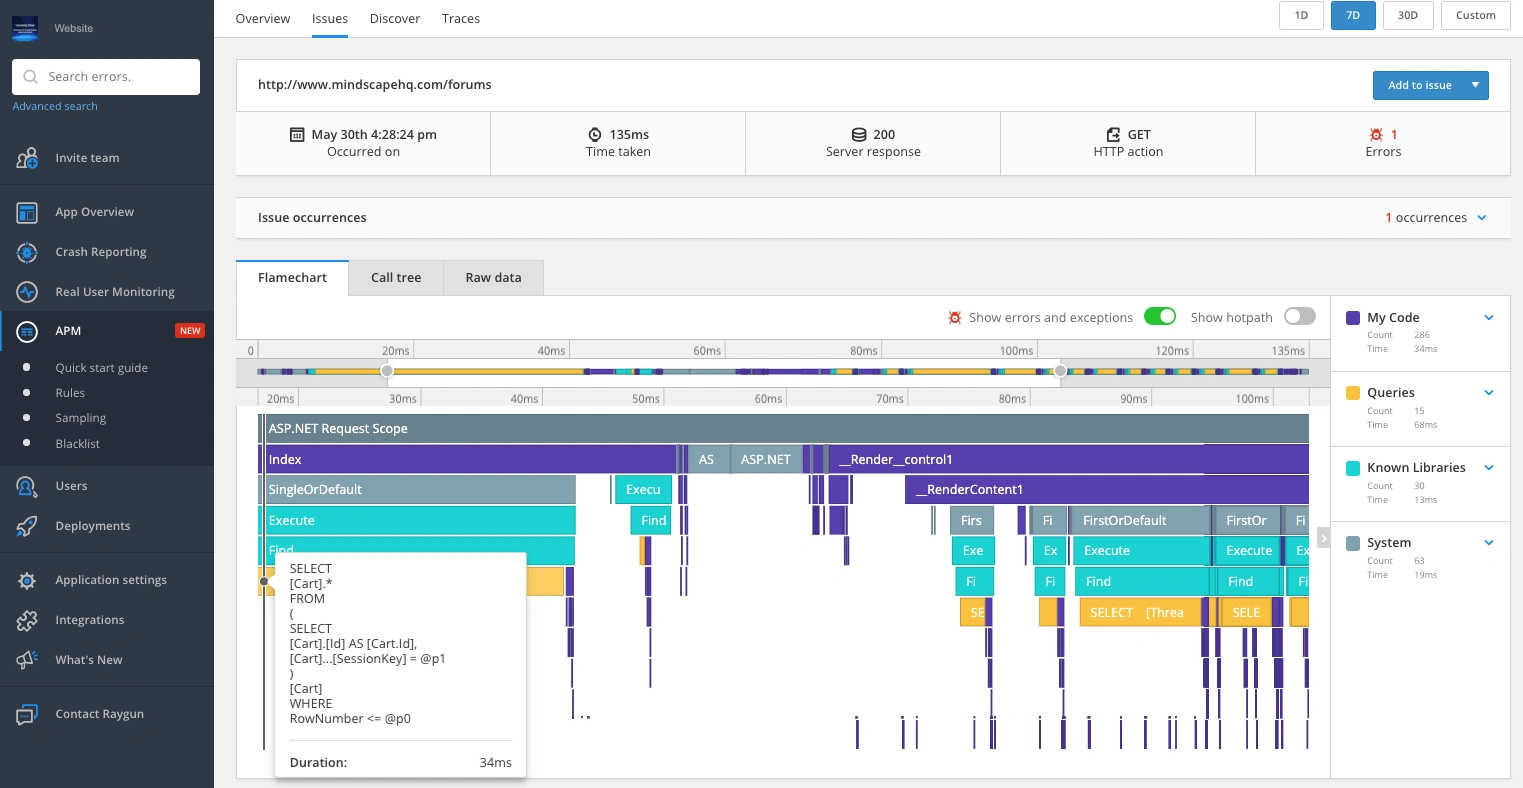
If you’re using SQL Server, you can look at your query’s execution plan to find table scans and replace them with indices. For other SQL providers, you may need to rely heavily on your monitoring.
Tip 4: Eliminate query per collection item
Queries per collection can manifest as the dreaded SELECT N+1 problem. If we see a similar or the same query running multiple times in the same application request, that’s a smell. We usually can optimize these many queries to get everything we need at once. For example, let’s say I wanted to get a list of products a customer ordered recently. I may have part of a query that loads orders for the customer:
SELECT number, ID from Orders where customerID = @customerIDThen I want to get all the products on these orders. For each order, I may have a query that looks like this:
SELECT name, part_number from Parts join OrderLines on part.Id = OrderLines.partId where orderId = @OrderIdI am now running this query for every order the customer has ever placed.
With long-term customers, this could quickly become a problem. Instead, I may want to batch the product retrieval into one query:
SELECT name, part_number from Parts join OrderLines on part.Id = OrderLines.partId where orderId IN (@OrderIds)I’m now sending the entire list of order IDs to query all at once. You may also be able to join to the orders table. Either way, this will fetch all the results you need with a significant performance gain.
Tip 5: Reduce deadlocks
Database deadlocks are a subtler, but more vicious, performance problem. It also can affect your functionality. In SQL Server, it can look like this:
Transaction (Process ID 62) was deadlocked on lock resources with another process and has been chosen as the deadlock victim. Rerun the transaction.Many a developer dreads seeing this message. Deadlocks can be hard to track down and you can’t actually eliminate them completely. Deadlocks are hard to track down because they result from multiple requests bumping into each other. And so no single request trace will expose the deadlock to you.
Fortunately, there is hope. First off, a way to mitigate these is right there in the description: Rerun the transaction. Assuming the request is idempotent, you can decorate the problem requests with retries. However, this is about performance tuning, and just retrying can decrease your performance.
Let’s tune down the pressure on the deadlock
To tune for deadlocks, we want to reduce the occurrence of them. The best way to do that is to change the design of the table that’s getting hit. The rate at which deadlocks occur correlates to the rate that things are updating the same row at the same time. As I said above, your monitoring tool should be able to easily sniff these out by showing you traffic per endpoint. In order to tune down the rate of deadlocks, we must decrease the rate the table gets updated at the same time. We have a few options for doing that.
First, we can look for a way to split the table from one entity into two entities. If we’re tailoring queries based on business use, we should already be doing this. But even then, our app can reach a scale where we should rethink our entity design.
The next option is to switch from updating the same row to adding a new row. If we version the updates, for example, we’ll have a new row per update, removing the lock. We still want to have some sort of optimistic locking in our application in this case so we don’t lose updates.
The final option is to shorten the transactions hitting the table. Many times we get deadlocks because we’re holding onto a database transaction for too long in our requests. We can follow healthy Unit of Work patterns to tune this issue.
Tip 6: Use bounded result sets
Just like a ticking time bomb, unbounded result sets are one of those things that will almost always blow up on you in the future.
It’s very easy to engineer software for the short term and lose sight of the mid-term or long-term tradeoffs in our design. Usually, this is OK. We want to design for the now and evolve our system for the later. But unbounded result sets can hit like a truck out of nowhere, taking your system down with them. Any query that has no guarantee of a max number of results is at risk.
Let’s go to our earlier example of retrieving orders for a customer.
If we get all the orders the customer ever ordered, we should be fine for the first few months, maybe even years. But what if the customer eventually places 1,000 orders with us of 100 products per order? This is easy to achieve in business-to-business transactions. All of a sudden, this query will start slowing down the request or timing out completely. In the worst-case scenario, this slowness will start queuing up other queries, eventually locking up your whole system.
Finding and fixing unbounded results
The key to fixing unbounded results goes back to tailoring queries for business use. By understanding the business process, you can have guidance on how to restrict results. Going back to our example of getting orders for a customer, If we knew that this query was to provide the customer with their most recent orders, we can define “recent” as the last 10, or the last three months worth of orders, etc. Now we have a bounded result set.
Unbounded results are subtle, but we can use our monitoring tool to hunt for requests that have slowly risen in latency over time to find them. It’s also healthy to check for this as a part of code reviews or a user story checklist.
Understand, monitor, and tune
There is an underlying theme in all of these tips. First, understand your users and your business process. If we start there, everything else can follow. But if we don’t have this fundamental understanding, then we risk making things worse, not better. Then we must monitor our application, down to the database, and you can do that with the help of Raygun. We can only fix problems when we see them. And it’s best to see a problem before it takes down our system or reaches the eyes of our customers.
I hope these tips give you the confidence and direction you need to make your application fast when talking to its database.