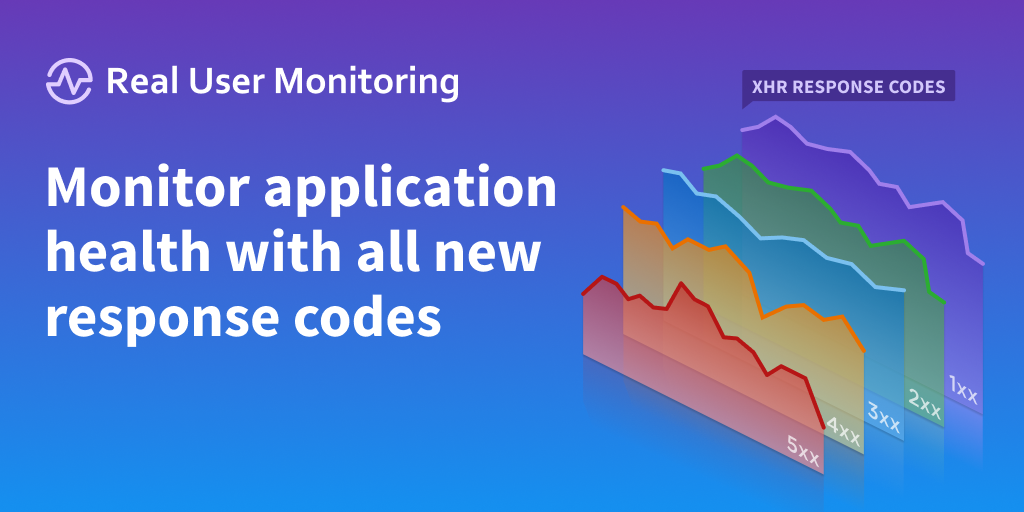
Gain actionable insights with XHR-level detail for response codes
Posted Sep 29, 2020 | 2 min. (375 words)A broken or poor performing XHR can significantly impact a user’s experience with a page by slowing down the load time or causing it to break entirely. Many of our customers monitoring web applications agree that monitoring and optimizing XHR calls is the biggest lever they have to improve application performance.
In April of this year, we announced that Raygun Real User Monitoring can now surface analytics into the response codes from XHR calls. In this latest release, we’ve added XHR level detail to the response codes tab in RUM. Now, you can see the XHRs causing a particular response code.
Drilling down into the exact response code allows you to diagnose where an uptick in a specific response code has come from in just a couple of clicks, so you can resolve it faster for any customers who may be impacted.
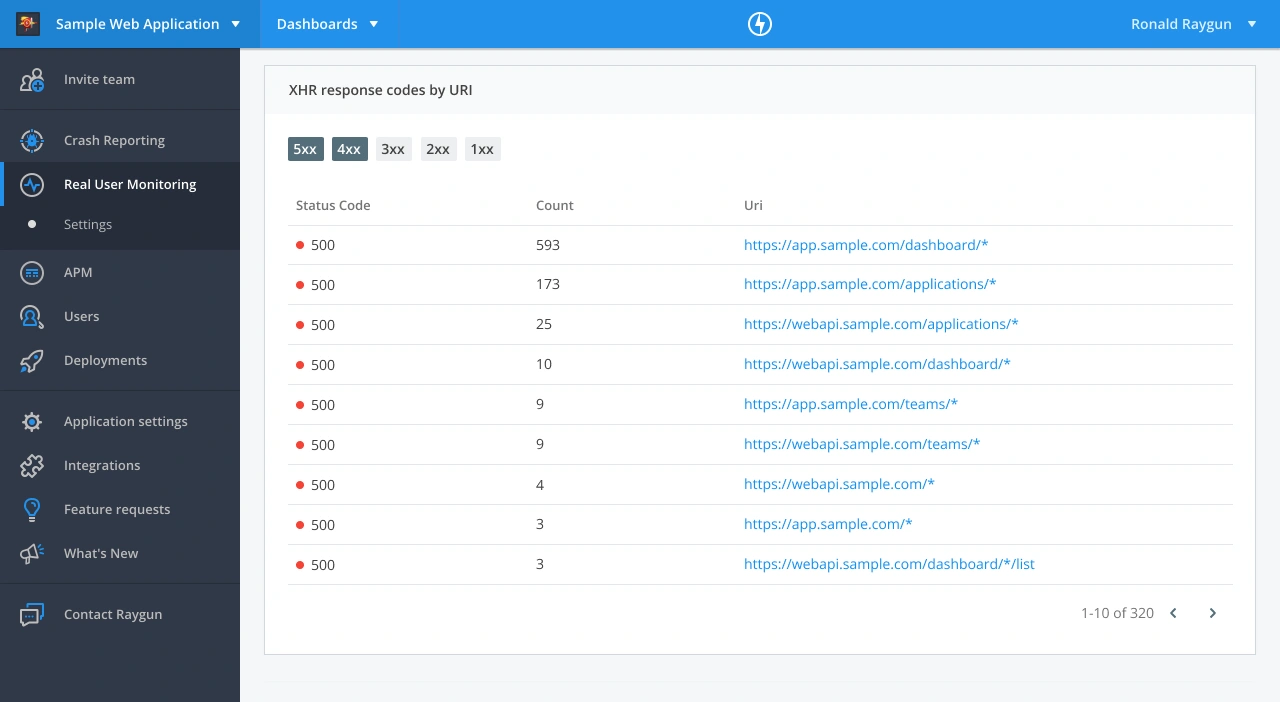
View the XHR causing specific response codes
The new module shows you the count of different response codes, grouped by the URI from which the code was returned.
For example, say you spot an uptick in 5XX response codes in the trend graph at the top of the page. Filter this new module to 5XX responses, and you’ll see the XHR/s that returned a 5XX response. The table is sorted by the number of occurrences, so you can quickly spot what’s caused that uptick.
With the new XHR-level detail module, there’ll be no more guessing what caused that 500 or 404. Quickly pinpoint the problem so you can resolve it quickly, and keep your application performing as intended for users.
Better support for single-page applications
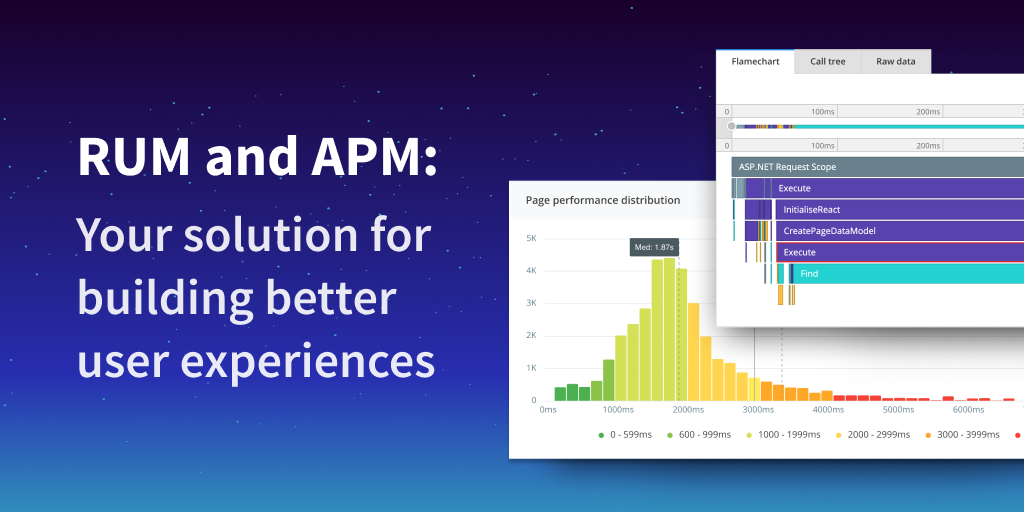
This latest release is part of developing more features in Real User Monitoring for folks monitoring single-page applications. These efforts include support for custom timings, instance-level performance insights, virtual page performance trends, and more!
XHR-level detail on the response codes tab is another way to ensure XHR calls in your single-page application are performing correctly. This new level of visibility into the health of XHR calls, along with the newly introduced XHR performance trends, gives you a full picture of XHR call performance with Real User Monitoring.
Monitor your XHR call performance today. Try Raygun Real User Monitoring free for 14 days, and start getting data in minutes.