Track any web performance metric with improved custom timings for Real User Monitoring
Posted Jun 23, 2020 | 4 min. (737 words)Over the past few years, we’ve witnessed a couple of key trends in the performance monitoring space.
Adoption of single-page applications (SPAs) has continued to grow and as such performance monitoring is evolving. SPAs don’t offer the same existing web metrics like load time or first paint from the browser performance API. As a result, developers require more flexibility to track the metrics that matter to their end-users and business.
We’re all seeing rapid growth in new performance metrics, measuring different stages of loading, rendering, and interactivity with a web app. Each team and business is going to focus on different metrics, so the flexibility to allow such is critical in a performance monitoring tool.
For these reasons, we’ve made some major improvements to our custom timings feature in Real User Monitoring. These updates mean:
- Custom timings are now supported for single-page applications. Track any page timing events on virtual pages.
- You can now send any number of custom timings, at any point in the application’s lifecycle. This means you can track performance timings, even after that initial load is complete.
- Custom timings are configured at the code level, allowing you to seamlessly integrate and manage timings in one place.
- We’ve updated the graph for better visualizations of custom timings, including giving you the control to decide what to display.
Note: If you currently use custom timings, you’ll need to update your implementation to take advantage of these improvements. Find out how in our documentation.
You can find the new Custom timings module by clicking into a URI on the main performance page. Here are some of the core benefits of the new improvements to custom timings.
Monitor load time for single-page applications
SPAs have long suffered from fewer performance timings available with the browser performance API. As most browser timing events are triggered within the first full page load, subsequent virtual page transitions have fewer native performance timings. For this reason, trying to define a universal load time for SPAs is not only complicated, but often inaccurate. We’ve long opted for tracking ‘XHR response time’ as an indication of SPA performance, but this alone is not enough.
The definition of load time will be different for every SPA, so you need the flexibility to track load time the way you or your team choose to define it. With easy code-level configuration, Real User Monitoring custom timings now offers you this flexibility.
You might choose to measure the response time of important XHR calls made to load a virtual page, or when a particular hero element has rendered. Or both! Custom timings gives you the flexibility to measure the performance metrics for your SPA that matter to your business and your users.
Send any number of timings at any point in the application lifecycle
Not every major page event happens at the beginning of the page load. You may wish to measure the performance of events happening after the initial load.
With these improvements, custom timings can be sent at any point in the application’s lifecycle allowing you to easily track events after the initial load. For example, you might track the time for a video to start playing once it scrolls into view, or the response time of a subsequent XHR call made after the load.
Easily instrument timings at the code level
rg4js('trackEvent', {
  type: 'customTiming',
  name: 'timeToInteractive',
  duration: 1200,
});
Custom timings are now fully implemented, named, and configured at the code level. No more administration or naming in the Raygun UI. Just instrument the code snippet and Raygun will begin capturing your custom performance timings as soon as your code is deployed.
Improved UI for easy visibility and digestion of custom timings metrics
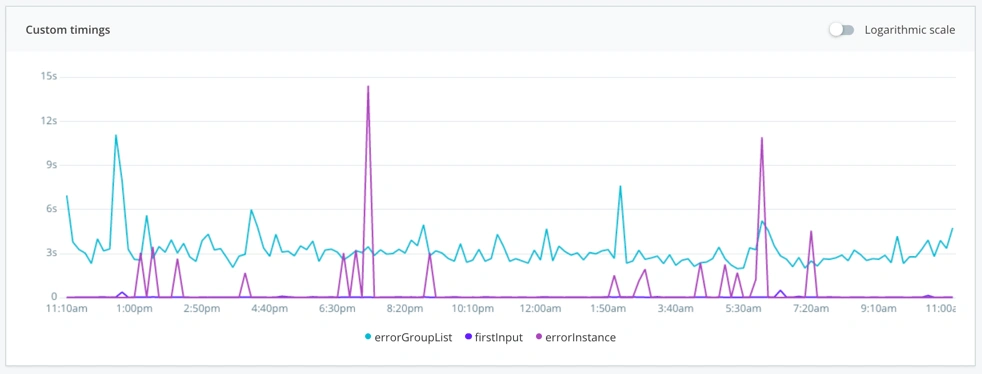
As part of this update, we’ve improved the visualization of the custom timings graph in RUM. This new graph brings a richer visualization of custom timings data, and the ability to show/hide different timings to focus on a specific metric or set of metrics that you’re interested in for your analysis.
Next steps
If you’re already utilizing Raygun custom timings in your application, you will need to update your implementation to take advantage of these new features. You can find instructions in the documentation.
If you’re new to Raygun Real User Monitoring and want to see how custom timings can help you track the performance metrics that matter to you, start a free 14-day trial of Raygun Real User Monitoring.