Monitor application health with the new response codes tab in RUM
Posted Apr 21, 2020 | 3 min. (558 words)In this release, we’re bringing an all-new section to Real User Monitoring to provide another way for you to monitor application health; the Response Codes tab.
Real User Monitoring now tracks the response codes from XHR/AJAX calls made in your web application using the JavaScript provider. You can now:
- Visualize trends in different response codes to monitor application health and spot any issues.
- See a breakdown of all the response codes and the number of users who have encountered each response code.
- View analytics in response codes for different browsers, geographies, custom tags, and more using our top-level filters.
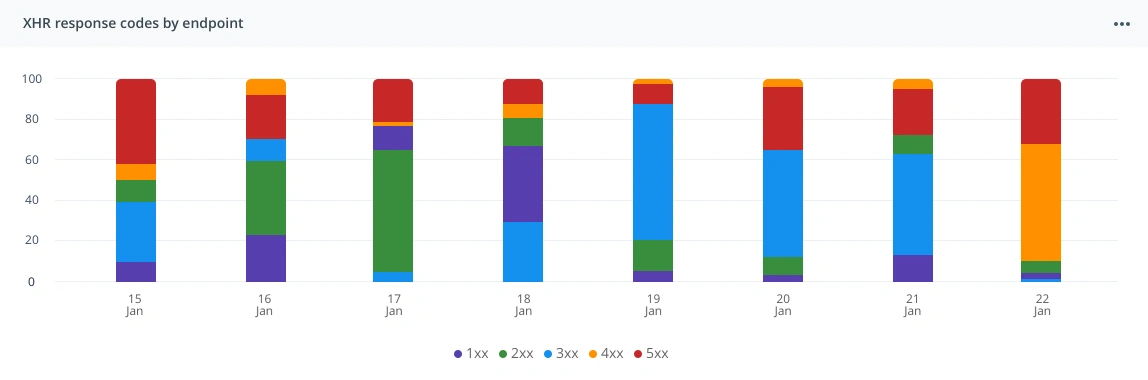 Stacked view of your application’s response codes
This feature brings vital insight into the health of your applications so you can deliver the software experiences your customers deserve.
Here’s a look at some of the best ways to use the Response Codes tab as a measure of application health.
Provide visibility into user experience
XHR/AJAX calls are made to transfer data from the server to the browser when loading or updating a webpage. If you have a failing or poor performing XHR call, that could mean parts of your application are not behaving as intended, leading to a poor user experience with your application.
Monitoring the response codes of XHR calls is an important factor in maintaining a finger on the pulse of your application health. If you see an uptick in bad response codes, you’ll know you need to investigate.
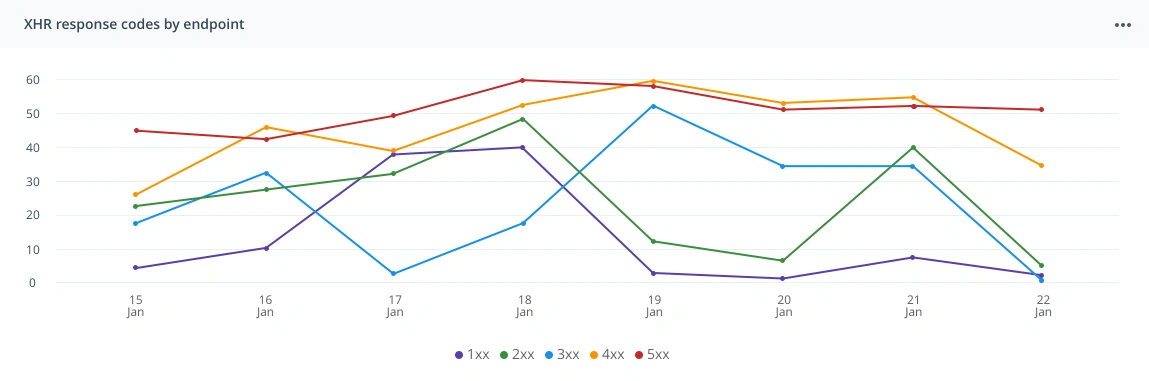 Easily spot trends with the grouped view in Raygun of your application’s response codes
Ensure your single page application experience is flawless
XHR/AJAX calls are heavily utilized in loading the additional page information required for virtual pages in a single page application (SPA). This is why poor performing or failing XHR calls are particularly detrimental to the user experience.
Therefore, it’s especially important when building a SPA to monitor your network responses to spot any uptick in bad network response codes quickly. For example, if you see the number of 500 responses increase, you’ll know there has been a server error that you may need to investigate.
The percentage of 2XX response codes is an important measure of the health of your application. Maintaining a finger on the pulse of this measure helps ensure your application is performing as intended, and you’re delivering a flawless user experience for your customers.
Try the new Response Codes tab today
The Response Codes tab is another way for you to understand how your application is performing for users. Paired with other Real User Monitoring features like instance-level performance insights, you can easily identify performance issues and know exactly where to focus to deliver the biggest performance wins for your end-users.
So what are you waiting for? Simply head to your new Response Codes tab in Real User Monitoring to get started.
Not a Raygun Real User Monitoring customer? Sign up to a 14-day free trial and start monitoring your response codes right away.
Don’t see any data in the Response Codes tab? To view data, your Raygun4JS provider must be using version 2.15.3 or higher. While most customers that use our CDN will have been automatically upgraded, if you’ve chosen to use an older version of the provider manually, then this will need to be updated.
You can find more technical information on the new Response Codes tab in our documentation.