How to identify and resolve front-end performance bottlenecks
Posted May 7, 2020 | 7 min. (1326 words)We all want lightning-fast websites and applications, but how do we prioritize our efforts in order to have the biggest impact on performance?
We interviewed our own front-end team so we could share some best practices we use every day to improve and maintain the performance of Raygun. Sumitra, Ben, and Nicholas take a deep-dive into identifying performance problems using Real User Monitoring, what to prioritize when looking for trends in performance, and how to communicate the impact of their work to the wider team.
Watch the full webinar below, or continue reading for how to diagnose and front-end performance bottlenecks in your app.
Intro to user-centric performance metrics
User-centric performance metrics are the new standard of measuring how users are really experiencing your application, and typically there are three to consider. Here’s a quick introduction to those metrics if you aren’t familiar with them.
- First paint is the loading of the primary elements of the website. When you use a dynamic application, you will see that different elements load at different times. First paint includes only the elements that the user can see in the first fold. These elements can be texts, images, or section outlines. It doesn’t include the elements that would appear after scrolls.
- First contentful paint is the first time that anything from the DOM is rendered on the website.
- Fully load time is the time taken for all the elements to render.
Identifying performance problems and bottlenecks using monitoring
Performance metrics are usually measured in two ways:
- Before features are released into production
- Once the application is in the wild
You’ll need to do both if you want to ensure good performance. While testing before release can prevent performance regressions, how your website acts in the wild for the user can vary based on a host of factors from the environment (browser, OS, etc.,) to how the user is navigating the page.
The only way to know how your website performs for end users is to monitor and measure performance in relation to the actual users that are interacting with it. This measurement is known as Real User Monitoring, or RUM for short.
Real User Monitoring provides a more granular understanding of how users experience your application making it easier to identify poor app performance. Once you have RUM in place, you can start to look for indicators that can help to diagnose poor performance — like spikes, trends, or sudden changes. Here’s an example of a spike in Raygun RUM:
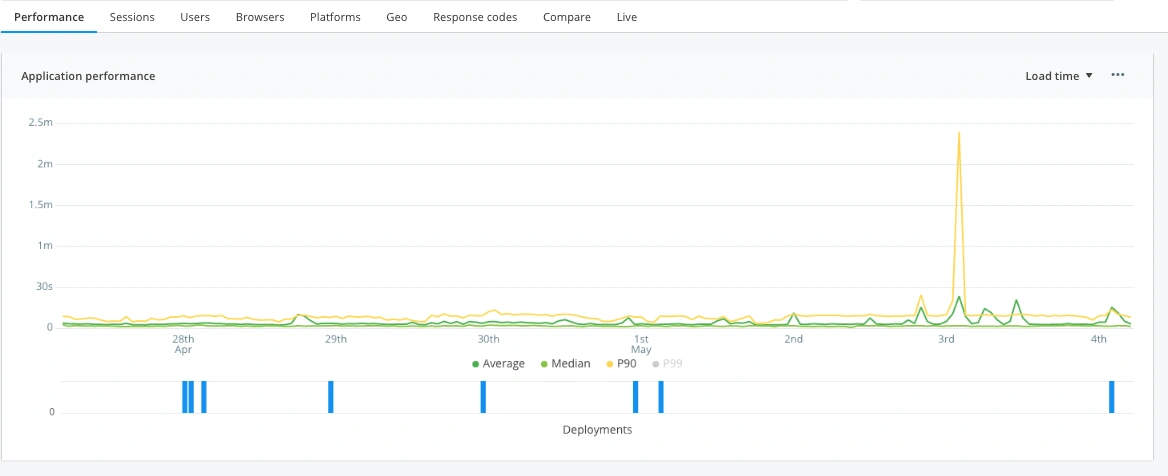
There can be various reasons for the spike. Maybe the release caused a performance problem, maybe you had a customer with slow internet speed, or maybe there was an accidental upload of development environment scripts. It’s time to investigate to find out.
Diagnosing problems
When you are diagnosing a performance problem, you can use the metrics surfaced in Real User Monitoring to help you make better decisions about where to prioritize performance optimizations. For example, the histogram helps you to spot outliers by helping you understand the load time distribution.
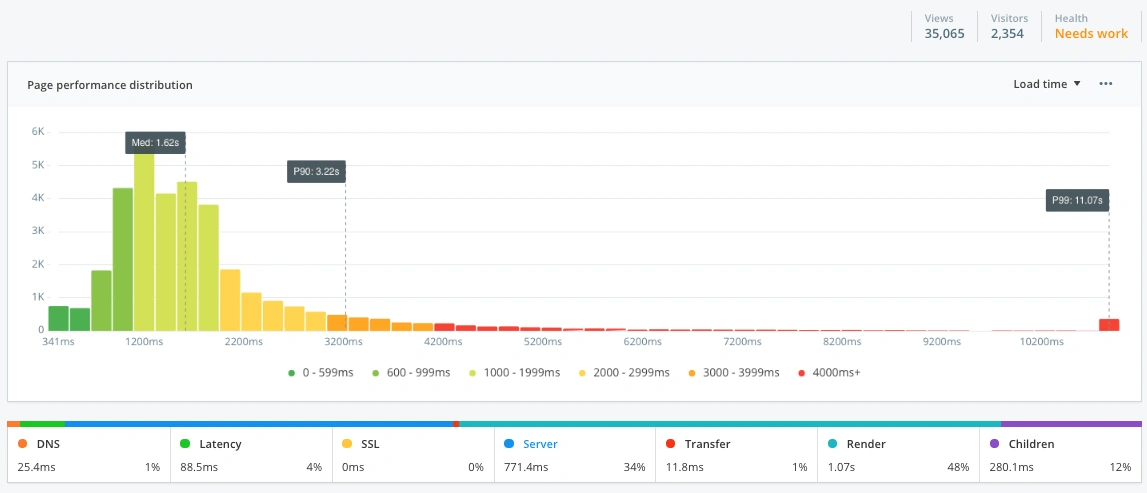
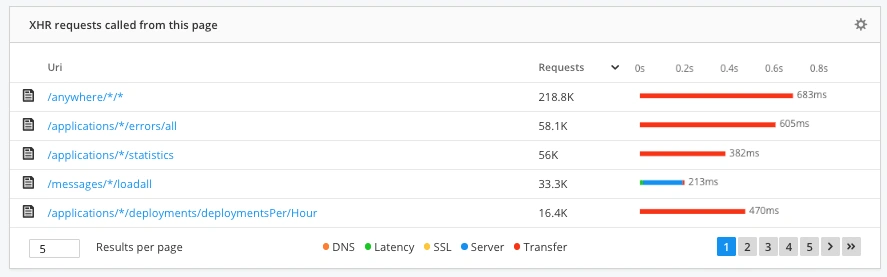
These visualizations help you understand how many people are experiencing the problem and what the cause is. Once you get this information, you can further inspect the issue to check if the cause for poor performance is on the customer’s side or the server’s. When you’re inspecting the problem, you can look at the waterfall chart to understand when the website is loading and when it’s available to the user.
Prioritize fixes
When you’re diagnosing the problem for poor performance, you might find more than one cause. You can’t fix all the bugs at once, so it’s important to prioritize the bug fix. The prioritizing can be based on the time the fix would take, the value it has in the application, or how quickly you can deliver the fix to the end-user.
The next topic is the highlight of this post: how you can improve the performance of the website.
Performance tuning
How you can tune the performance of the website mainly depends on which bottlenecks you’ve found. Below are the most common website performance optimizations.
Minification
Minification is the process where you remove all the unnecessary parts of the code, such as blank spaces, new lines, and comments. You can also replace lengthy variable names with shorter ones. For example, you can replace the variable name submit_button_activity with a shorter name like subact. Shortening the length of code improves performance.
You can use a minifying tool or write a script to automate this process. Minification is also easy to implement and reduces load time for each asset.
Image optimization
Images used in a website are one such asset that can greatly affect a website’s performance. When you make changes to your website, which includes adding or changing images, you see that it increases the load time. This happens when you don’t use compressed images, so make sure to optimize the images whenever you’re dealing with them in a website. SVG images mainly need compression because they are large in size.
Also, you can choose the compression of the image based on the use-case. If you have a website that’s only for mobile devices, then you don’t have to use 1080p high-resolution images. You can use the image of quality that’s just enough to make the customer experience good.
Reduce number of requests
When you use many images in your website, you’d be increasing the number of requests if you had to request each image individually. The best way to approach this problem is to see how you can merge these images. If you have images that you know are placed together in the website, you can merge those images into a single one.
This would decrease the number of requests to the server, and that in return would decrease the load time of the website. So combining images, icons, and especially the SVGs will increase the website’s performance.
Preloading scripts
Preloading of scripts loads more important scripts into the memory to it ready for execution. When you preload scripts, the scripts and assets are ready for execution and just waiting for a trigger. This impacts performance because you eliminate the load time of assets after the request has been made.
You should not preload all the scripts. You should only preload important scripts and those that you know will be triggered at or after a particular action. Preloading scripts should mainly be used for first paint.
Limit blocking requests
A blocking request is an asset that the browser needs to render for the first time. A blocking request stops the critical rendering path, which is what the browser needs to render the first paint. JavaScript and CSS assets are render blocking by default. If you limit the amount of blocking requests of your website, reducing the number of scripts and CSS files, you can increase the time that the browser can actually paint.
Intersection observer API
A lot of websites these days have assets like animations. These assets add life to a website, but they also add overhead on rendering. Most of these animations are way below in the website, and the users don’t even view them on first paint. Loading such assets in first paint causes slower performance and puts strain on CPU.
The solution is to use Intersection Observer API. This is a function that’s just waiting for a trigger, and when the asset is in the user’s view, the function is triggered and the animation is loaded.
Monitor early and often
If you’re working on your website performance, start by monitoring your software so you can surface performance problems, then work towards a system to diagnose. Once you’ve made the changes, you can use Real User Monitoring to monitor the changes.
Raygun Real User Monitoring helps you to easily diagnose and identify front-end performance problems. You can get unlimited monitoring free for 14 days - take a free trial here.