Gain more visibility into code performance with Raygun APM for Node.js
Posted Mar 1, 2021 | 7 min. (1284 words)Raygun has been busy building our best-in-class APM so you can provide flawless digital customer experiences. By adding Raygun Application Performance Monitoring to your monitoring suite, your team will gain more visibility on code and server performance, achieve a faster time to resolution with finer granularity, and reduce infrastructure costs by optimizing existing services.
Raygun is a developer-friendly product that surfaces more diagnostic details than other APM solutions. Combined with our usage-based pricing, we have the ability to provide companies like Olo with millions of customers with cost-efficient and powerful APM.
Today, we’re excited to announce the latest in our APM support — APM for Node.js. Now, teams can pinpoint the root cause of Node.js performance issues right down to trace level, so you can solve them quickly and reliably.
We support a wide range of Node versions on Windows, macOS, and Linux. APM for Node.js has a simple design that can either communicate with the APM agent over UDP or through a memory-mapped file. This means that the profiler can run in practically any environment, including Docker, Kubernetes, or cloud providers like Heroku, Azure, and Elastic Beanstalk.
As part of our work, we’ve improved the community bindings for the V8 profiler and contributed that work back as open-source, which helps the Node community at large.
More details for faster resolution
When you need to get to the bottom of a problem, you’ll get the diagnostic details you’ll need to resolve the issue faster. Customers are why we create software, so ensuring excellent digital customer experiences is a core function of APM.
Raygun APM for Node.js helps you achieve your performance SLAs with finer detail than other tools. Raygun combines the detail of the latest V8 JavaScript profiler with the convenience of request-level traces. Drill down into the specifics from the Traces page, where you can find all the traces for your application.
Clicking on an individual trace will take you to the flame chart, which shows you the state of your code at every millisecond during the performance profile. This gives you a way to know exactly which function was executing at any point during the recording, how long it ran for, and where it was called from.
The flame chart allows you to visualize your code rather than just using a call tree view. Once you’ve isolated the issue, drill down into the details of the call, such as the execution time, parent percentage, duplicates, and hotpath. The detail doesn’t end there — the GitHub integration will show the code below the chart, so you can read it in context.
This resolution workflow gives granularity to data, so your team avoids spending too much time debugging and tracking down issues, plus gives the insights you need to optimize infrastructure.
The customizable Overview page visualizes all the high-level data you need to spot performance trends over time. From this page, monitor Apdex score, slowest requests and methods, active issues, and more for full visibility into your application performance. Unlimited customizable dashboards further help you to create a meaningful story from data.
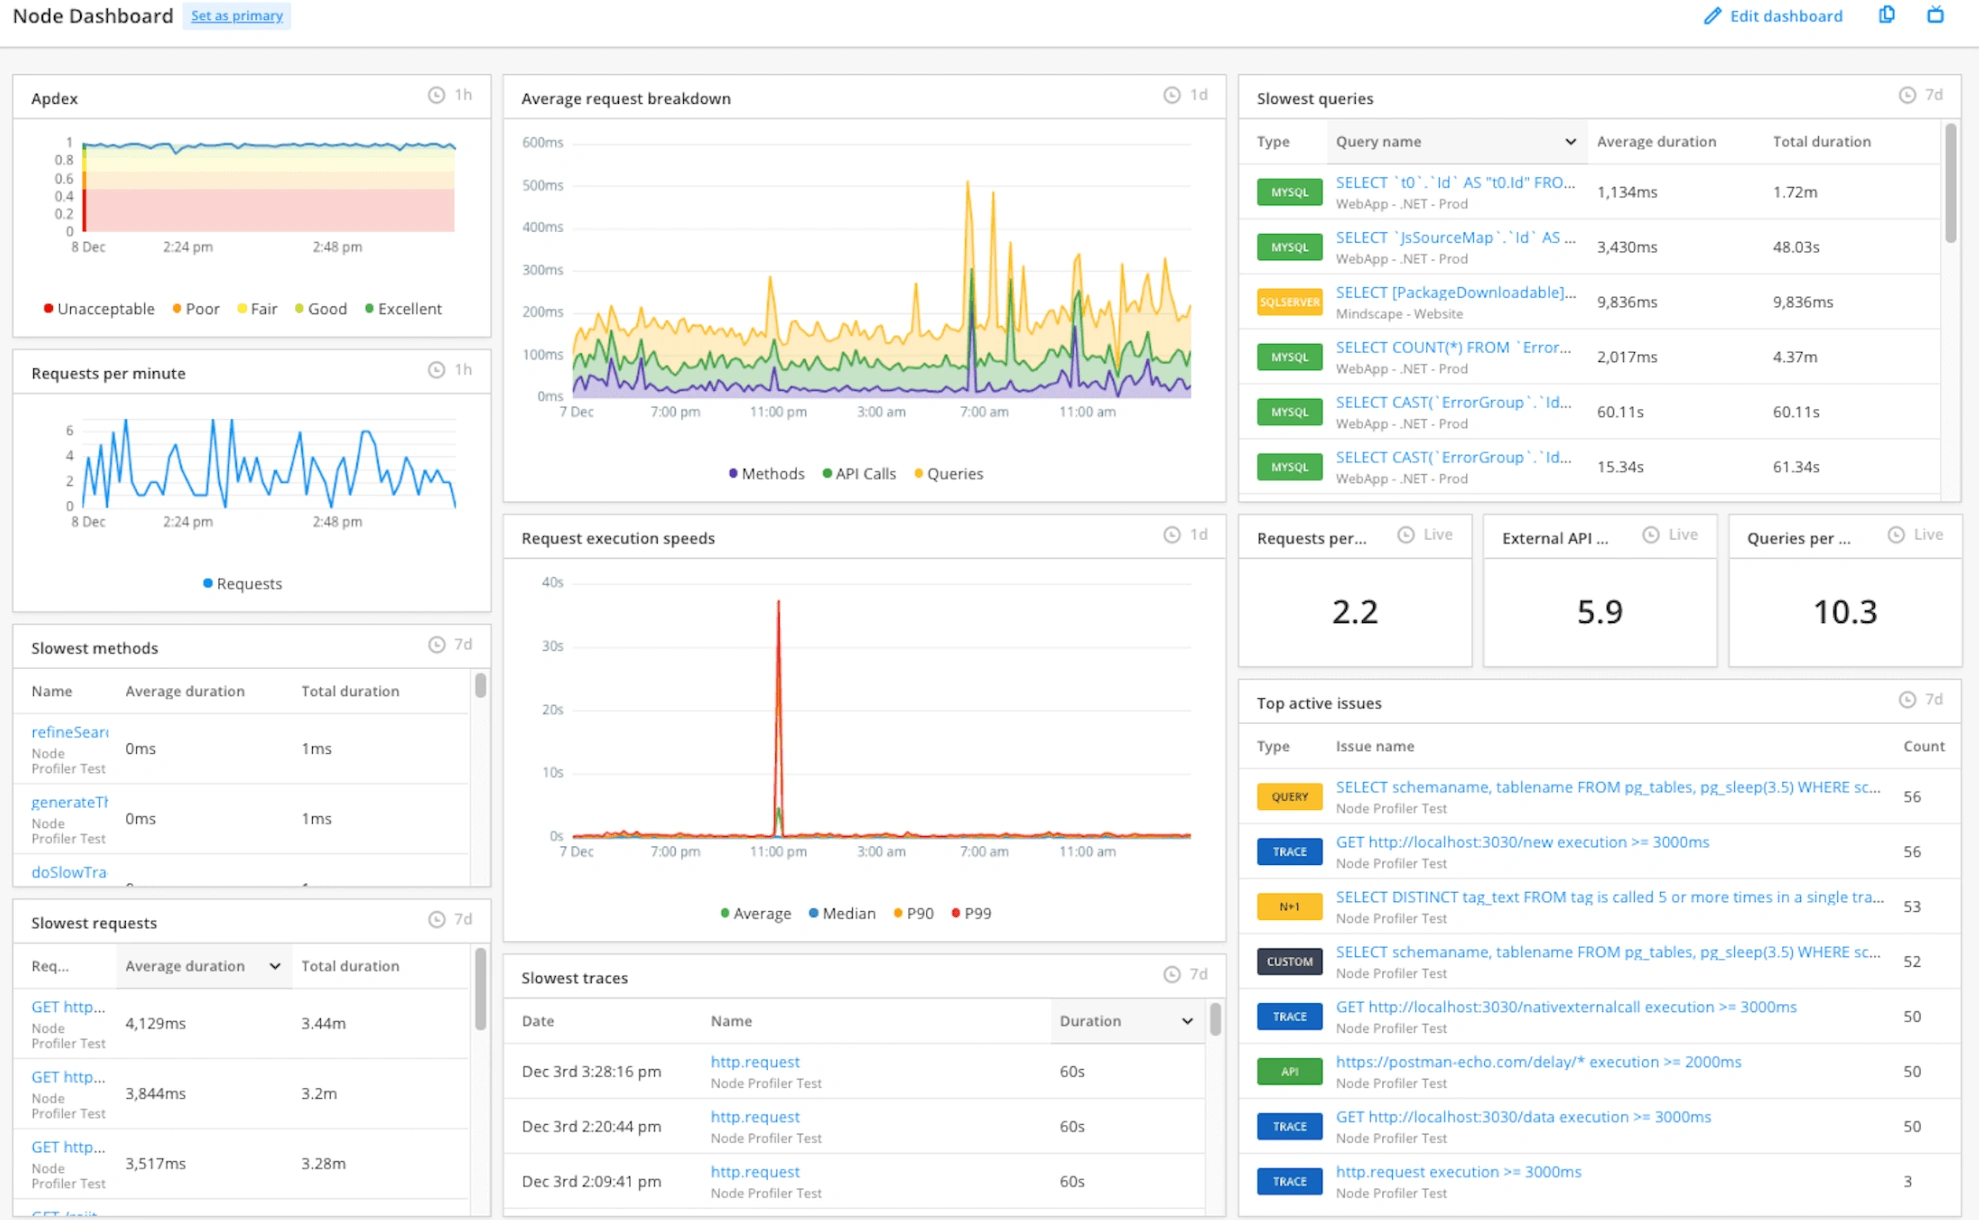 Customizable dashboards allow you to highlight the metrics important to your team
If you’re not sure where to start, our unique automatic issue creation engine curates a list of your most urgent performance issues for you, sorted by priority.
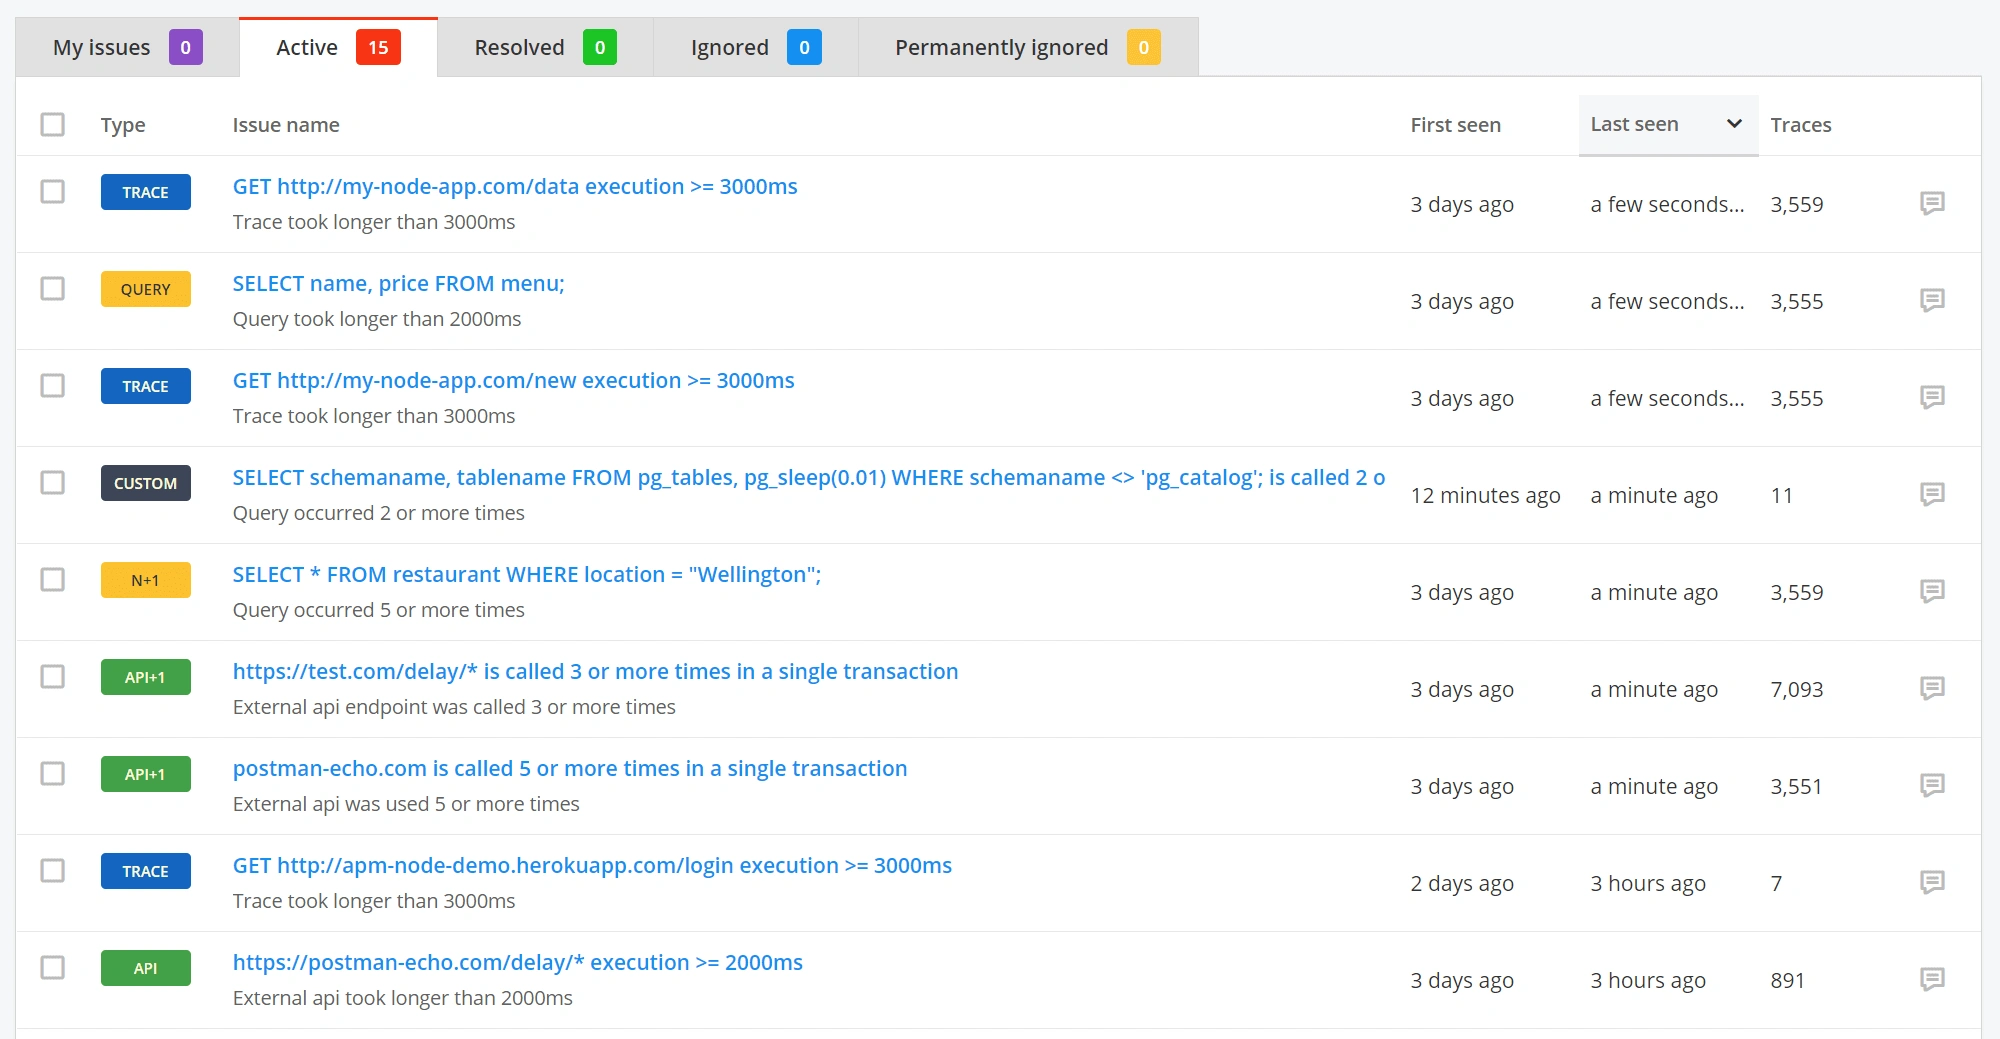 All active issues land in a sortable list ready to assign, resolve, or ignore
Resolve errors faster with APM and Crash Reporting
Raygun APM and Crash Reporting work together, which can be helpful for getting an even better idea of what’s causing errors or crashes in your app. Spot a problem on a page caused by a server error, then take a deeper dive into what caused the problem — and who is affected — with crash reporting.
Understand how server-side performance impacts customers with APM and RUM
With Raygun APM, you can combine server-side timings with front-end performance data from Real User Monitoring (RUM) to get a complete view of your user experience. For RUM subscribers, APM automatically integrates data flows, so you won’t be left trying to manually correlate user data between tools, and you’ll be able to assign dev resources to where it matters the most.
Click through to Real User Monitoring to see the performance breakdown of the page, including the server percentage of load time.
Easy to set up, yet highly configurable
Raygun APM for Node.js is built using the V8 JavaScript engine’s sampling profiler, meaning that users can tune the profiler via environment variables to optimize for the best level of detail and performance — all without needing to deploy a code change.
Accessible pricing for modern environments
Raygun offers sophisticated yet cost-effective application performance monitoring across the whole stack, no matter if you are using microservices or monolithic architectures. Our usage-based pricing starts at just $8 per month.
Raygun’s usage-based pricing fits well with a scalable, Cloud-based approach. For example, instead of paying for monitoring per server, Raygun customer Spotlight Reporting pays per event, meaning that even though their customer base is rapidly increasing, the team can keep the code both performant and cost-effective.
Integrations available on release
Raygun APM works with your current development environment and already has all of the features you need to diagnose issues quickly. Slack, Jira, GitHub, and PagerDuty integrations are all available today, with more being released soon.
Slack
Report issues directly into a specific channel where you can assign, ignore, or resolve issues directly in Slack. Advanced filtering makes sure you are only alerted to the issues that matter.
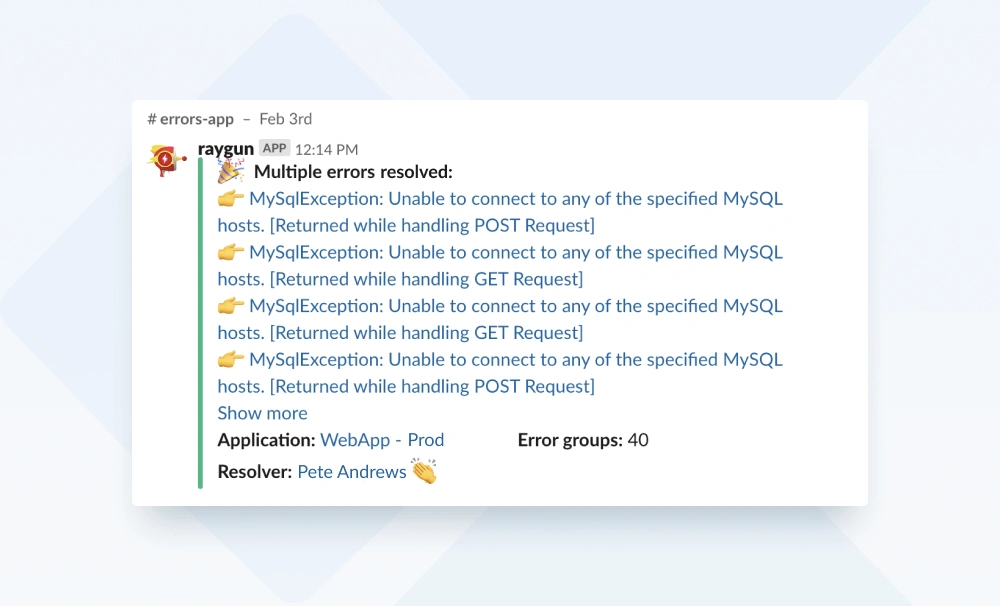 Receive alerts directly into a dedicated Slack channel
Jira Software
There’s no need to copy-paste contextual information about errors into tickets in Jira. Create a new issue or add information to an existing issue in just a couple of clicks. All the information you and your team need to resolve the error will appear on the ticket.
PagerDuty
Raise alerts to the right people at the right time. Set up custom notifications that help to point your on-call developers to the exact line of code causing a problem, reducing time to resolution.
GitHub
Raygun’s source code integration with GitHub links diagnostic details to the source code in your GitHub repository. The GitHub integration also works with projects compiled using TypeScript or Babel, or any other language that compiles to JavaScript with Source Map V3 support. In the future, we will be extending our GitHub integration for Node to support anonymous functions.
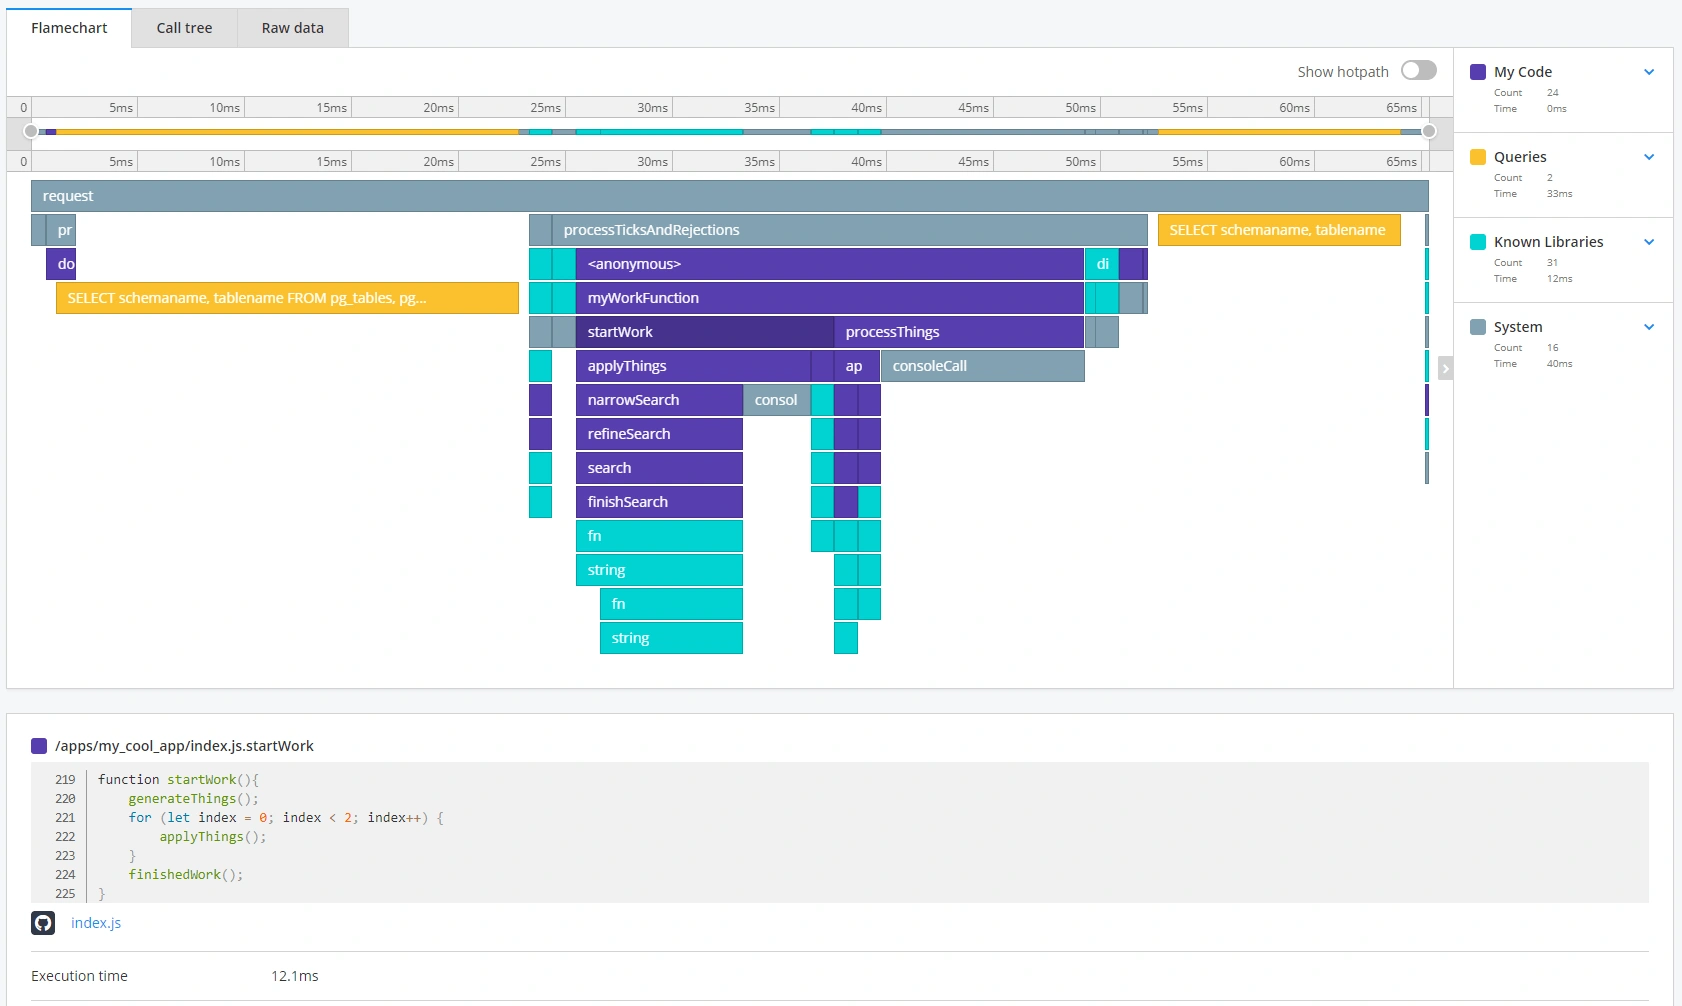 The integration with GitHub surfaces code-level detail
If you’d like to read more about our integrations, you can head to our documentation.
How to get set up with Raygun APM for Node.js
It’s easy to get started with our lightweight agent, take a free 14-day trial today.
Here are some quick links for getting set up. You can find all the below instructions in the Getting Started documentation:
- Agent installation guides
- Set up Raygun for Node.js
- Best practices for adding APM to your workflow
- How to measure and improve Node.js performance
If you need any additional help getting set up, contact our team.
Raygun’s latest support for Node.js provides end-to-end monitoring capabilities across your entire tech stack. We provide more detail and better data visualization than any solution on the market today. Thanks to our usage-based pricing, you’ll get sophisticated Node performance monitoring for a great price, no matter what your architecture looks like.
Raygun APM is currently available for Node.js, Ruby, .NET, Azure App Service, and .NET Core, but watch this space for Java support and more. Request to be notified when your language becomes available.
