How to measure and improve Node.js performance
Posted Feb 14, 2024 | 22 min. (4513 words)Change is the only constant in software, and few languages change like JavaScript. In just the last few years, we’ve had the rise of TypeScript and React, dozens of new frameworks, and Node.js has brought us over to the server-side. Google’s V8, which powers Node.js, is one of the fastest JavaScript engines in existence. In simple benchmarks, well-optimized JS executed by V8 often performs almost at the same speeds as famously fast languages like C++.
And yet, Node applications often seem to be pretty sluggish. This post aims to guide you through the process of measuring and improving Node.js performance.
We’ll share a range of Node.js performance optimization techniques, along with 5 examples of high-performance coding with Node.js. No matter your goal or skill level, there’ll be something here to help your application perform better under heavy loads without compromising on user experience.
On top of that, we’ll look at Node’s built-in profiler and introduce monitoring for Node.js, which can give you insights into your application’s performance to help make data-driven decisions for improving its speed and responsiveness.
In this post:
12 actually useful ways to optimize Node.js performance
- 1. Use Node’s built-in profiler
- 2. Monitor and profile with APM
- 3. Use caching to reduce latency
- 4. Optimize your data handling methods
- 5. Use timeouts
- 6. Ensure secure client-side authentication
- 7. Improve throughput through clustering
- 8. Use a Content Delivery Network (CDN)
- 9. Use asynchronous programming
- 10. Optimize database queries
- 11. Reduce the number of dependencies
- 12. Use a load balancer
- 13. Streamline your code
The importance of Node.js improvement: 5 use cases
- Real-time web applications
- Microservices architecture
- Single-Page Applications
- Server-side proxies
- DevOps tools
12 actually useful ways to optimize Node.js performance
Here are 12 of the classic ways to up the performance of your applications, adjusted for Node.js. Let’s look at each in detail.
1. Use Node’s built-in profiler
Node has a high-quality profiler built into the Node debugger. We can enable it by passing the --inspect flag when running an application.
Here’s a sample application we can use to test the Node.js profiler. It includes both a fast route that only sends a response and a slow route that loops, allocates, and sleeps.
If you want to follow along yourself, you will need Node.js (v12+) installed, as well as Chrome/Chromium.
Here’s the code we’ll be profiling to start with. Save it as index.js in a new project directory:
const express = require('express');
const app = express();

app.get('/', slowRoute);
app.get('/fast', fastRoute);

function slowRoute(req, res) {
  loop();
  allocate();
  setTimeout(() => res.send('Success'), 100);
}

function fastRoute(req, res) {
  res.send('Success');
}

function loop() {
  for (let i = 0; i <= 1e8; i++) {}
}

function allocate() {
  const items = [];

  for (let i = 0; i < 1e6; i++) {
	items.push({ count: i });
  }
}

app.listen(3030, 'localhost', () => console.log(`Listening on localhost:3030`));
We now need to install express, via npm install express on the command line in our project directory.
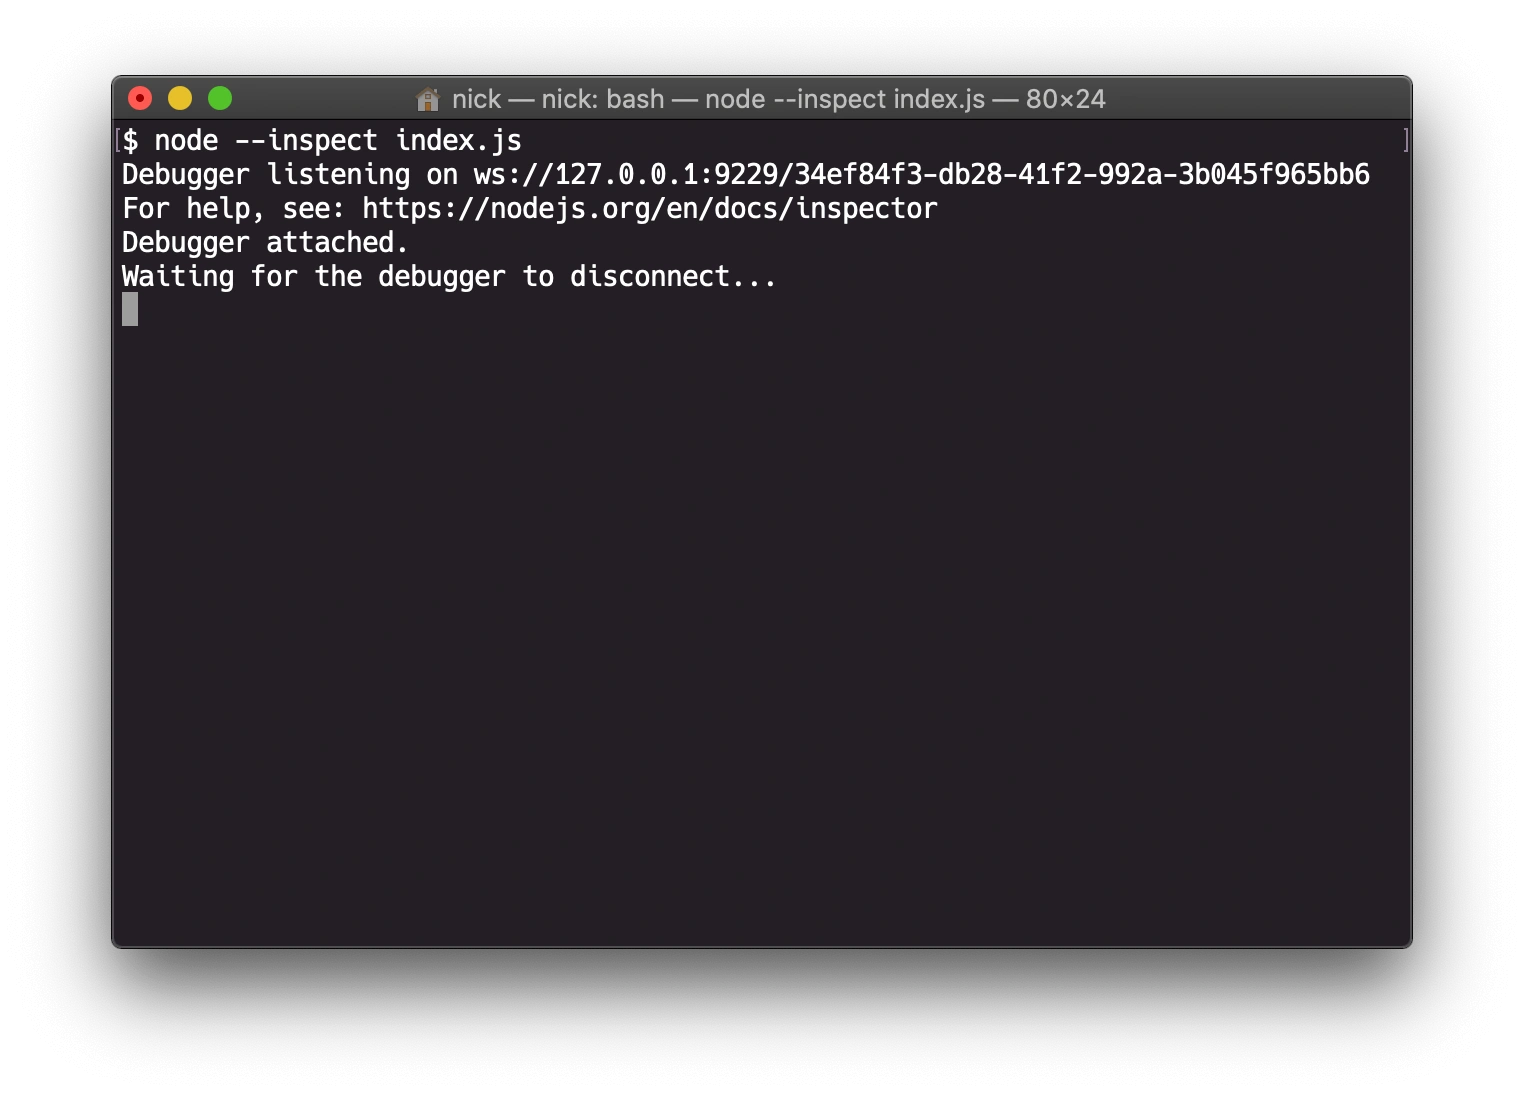
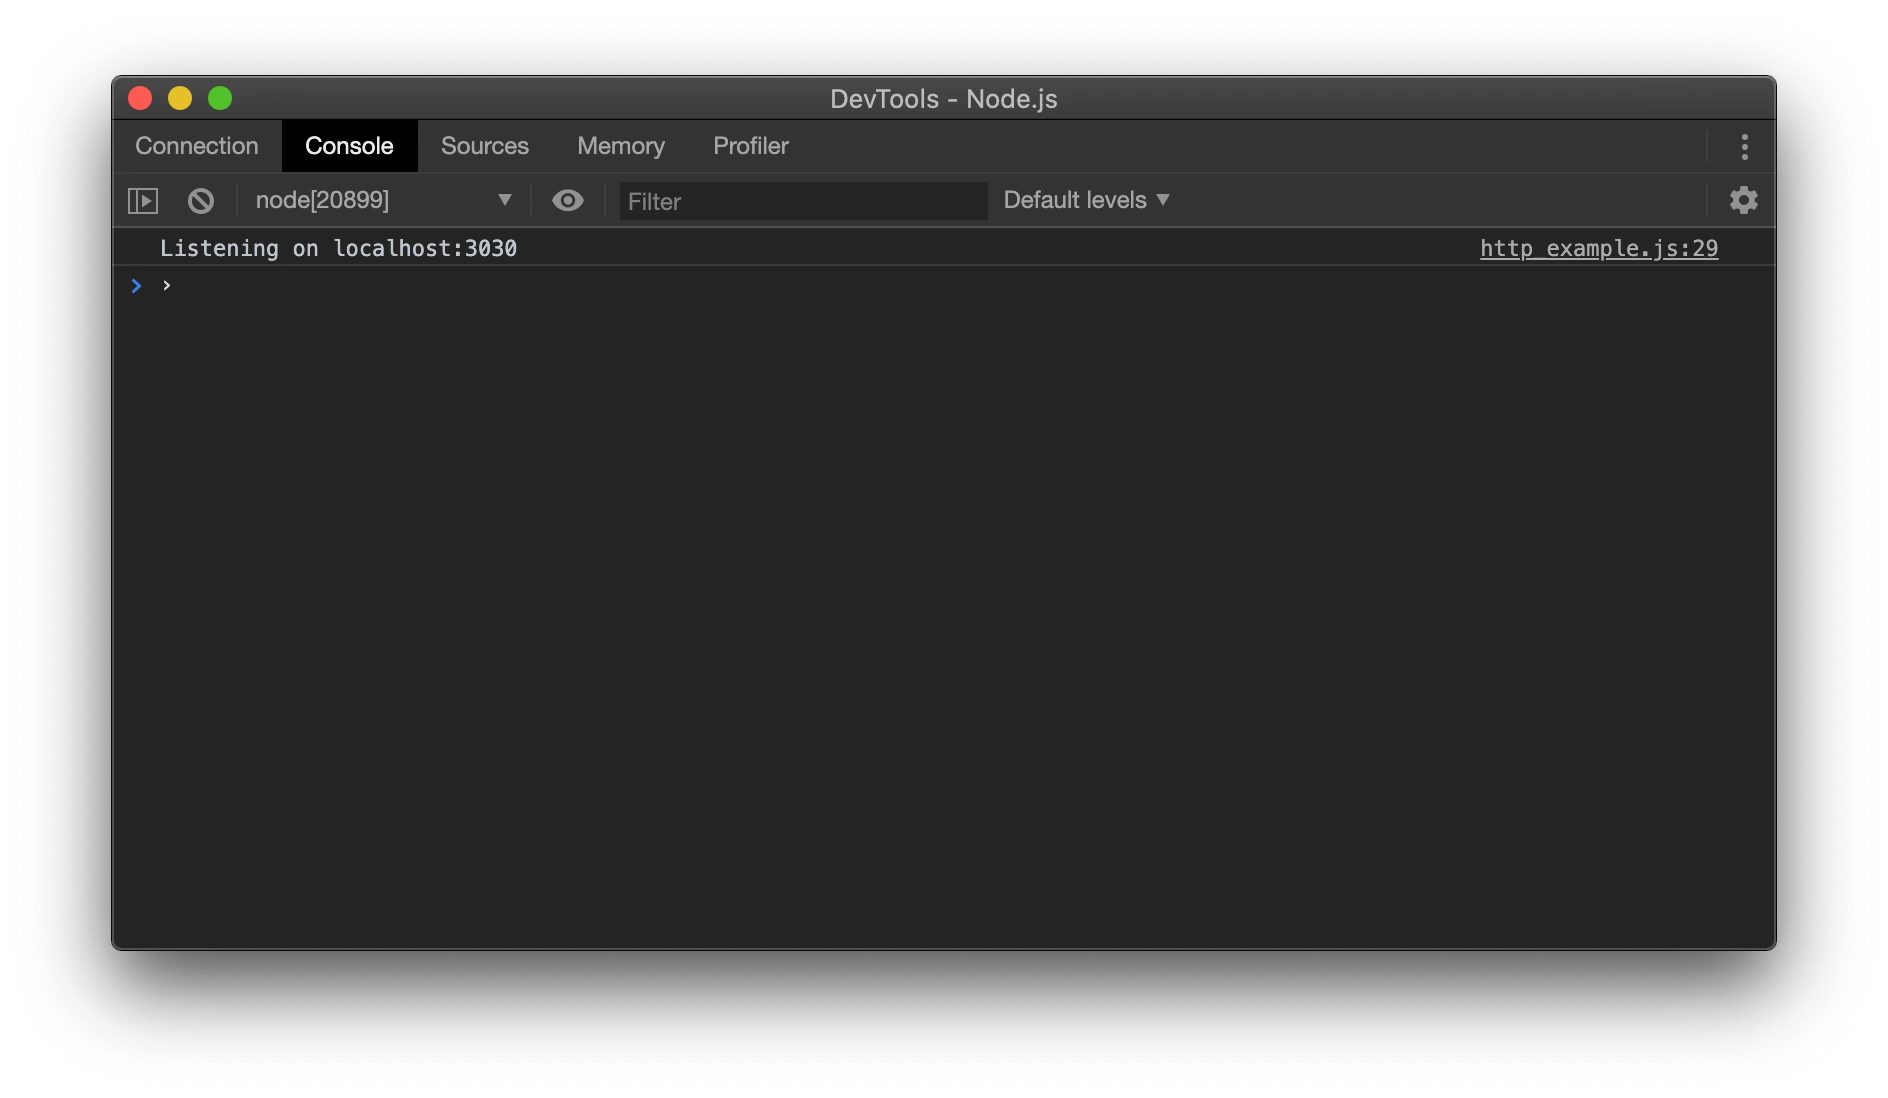
We can now run this example with the debugger by running node --inspect index.js.
If it worked, you’ll see output like this screenshot. If you encounter an error, it might be because the Node.js debugger is already running for another app.
Now, we can connect to the debugger session by opening Chrome and then opening the DevTools. The easiest way to do this is by right-clicking the page and selecting Inspect.
If your Node application is running with the debugger enabled, you’ll see a Node icon on the left of the DevTools control bar.
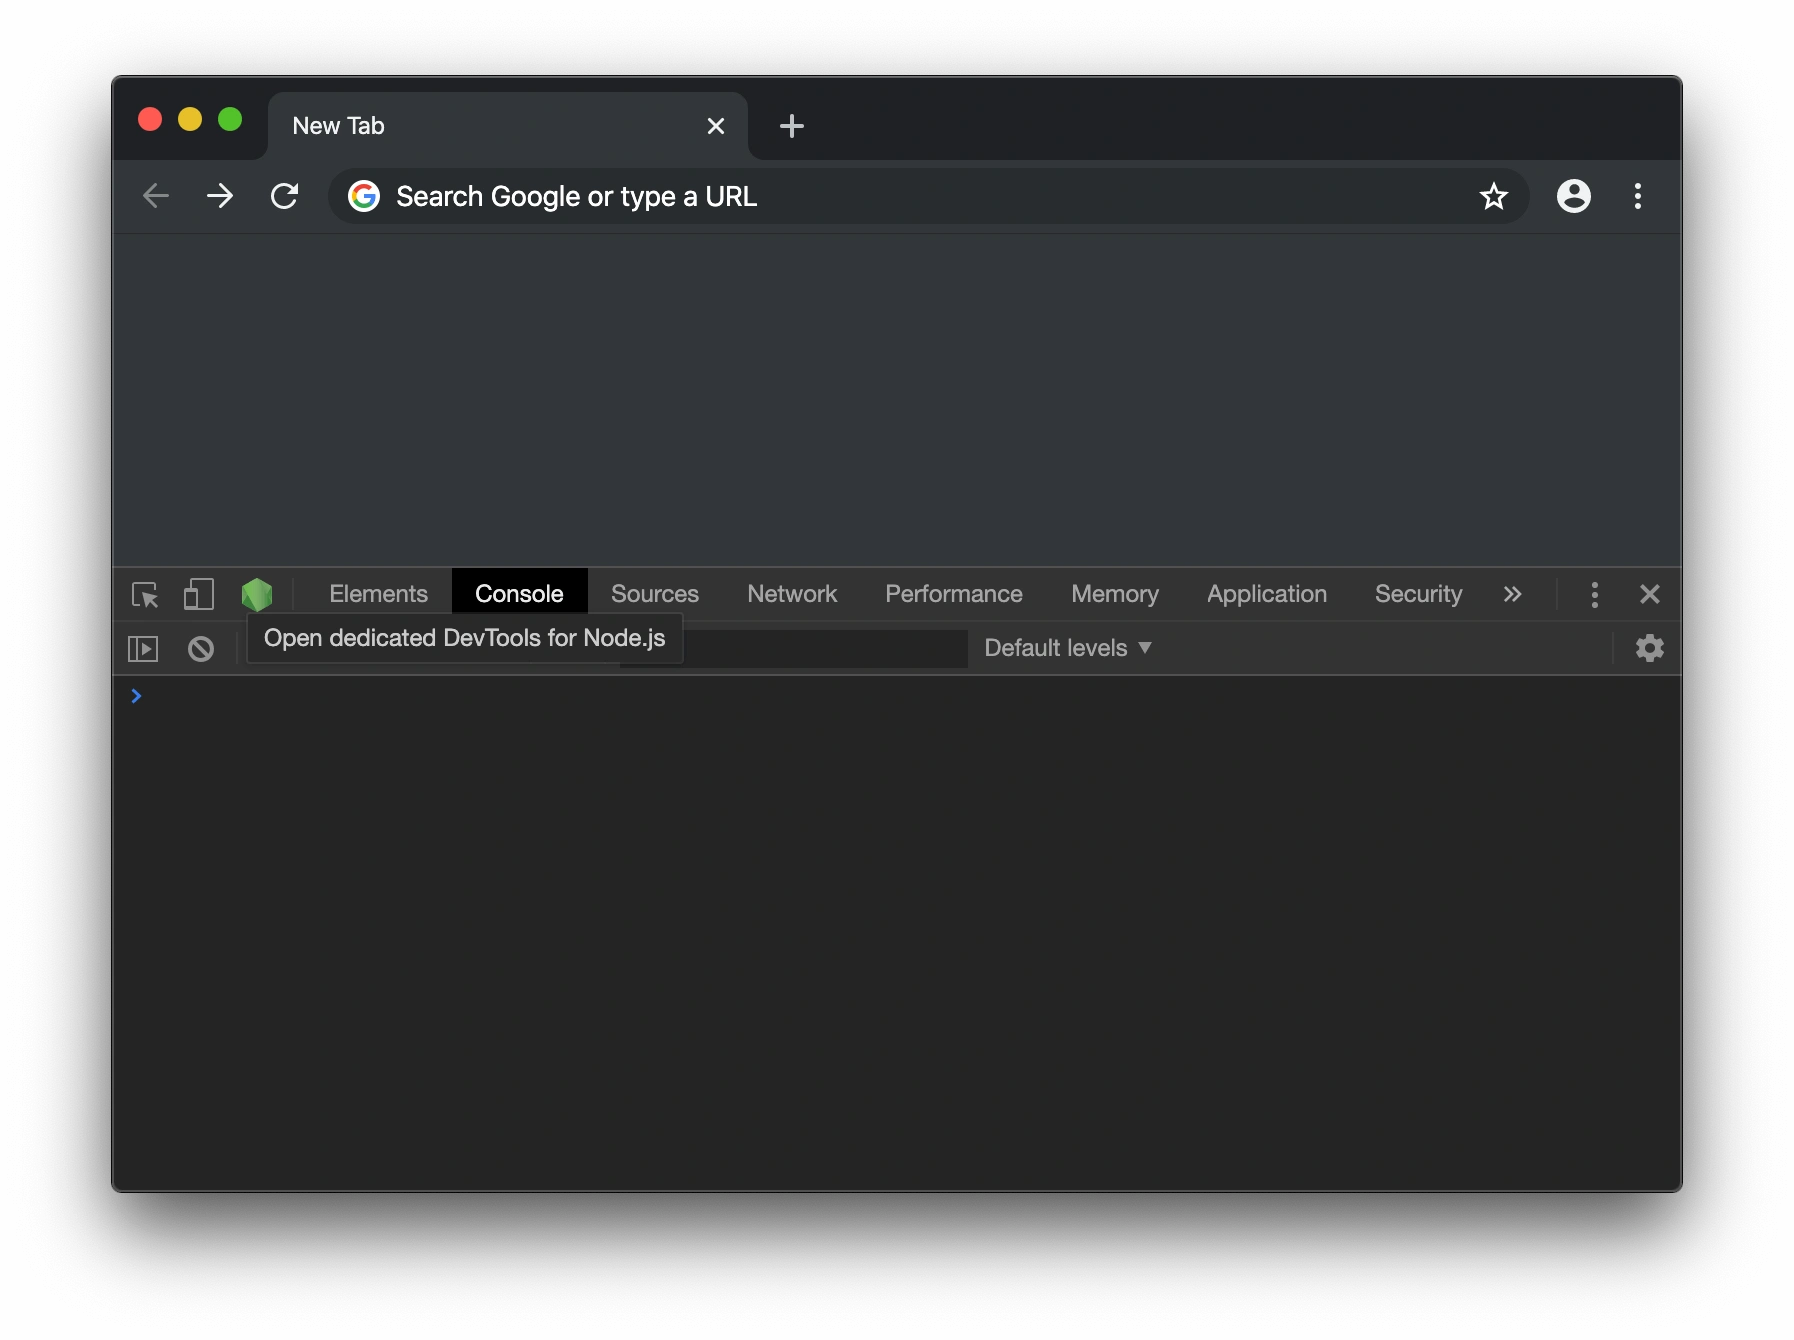
Clicking the green Node.js icon will open a Node.js DevTools window. By default, the Console window is open and will show output from your application.
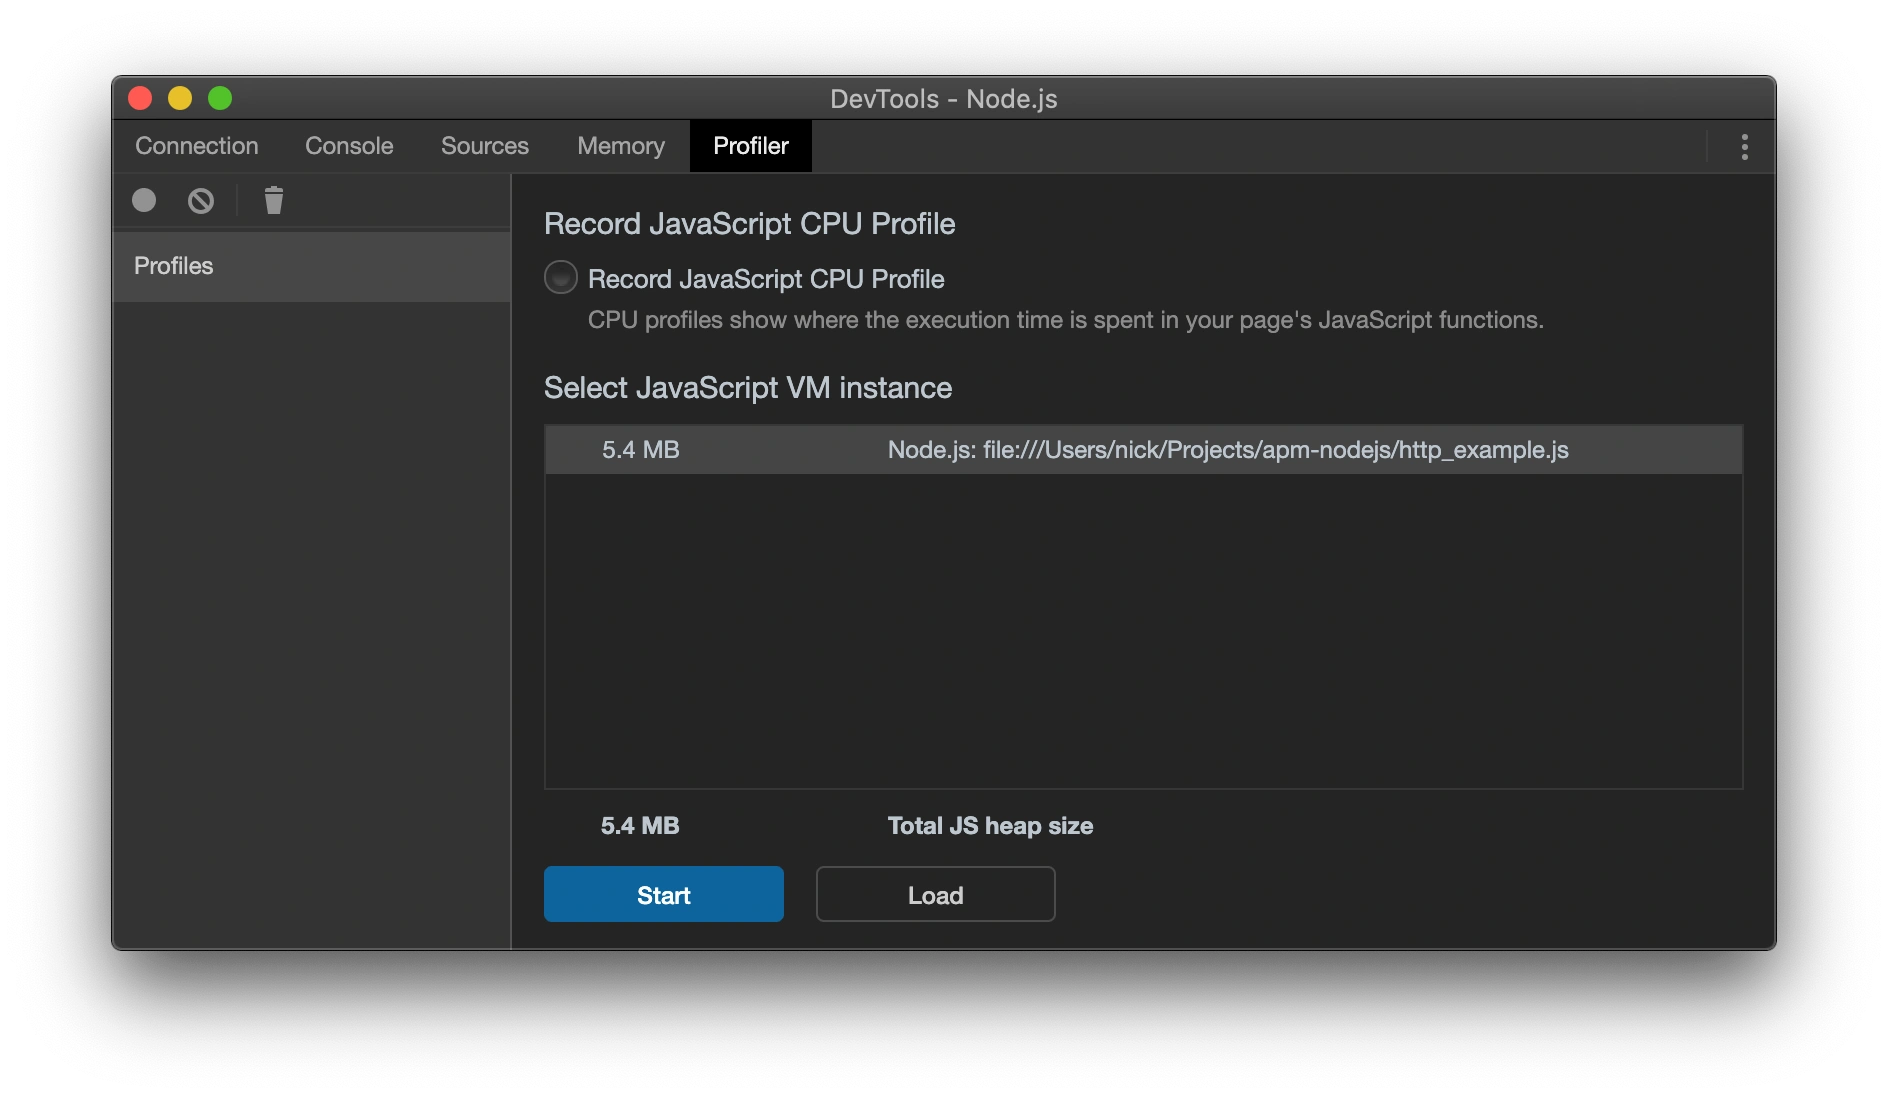
Navigate to the Profiler tab, and click the Start button to begin capturing a CPU profile.
The profile is now recording. We can make some requests of our web application so we can profile the different routes.
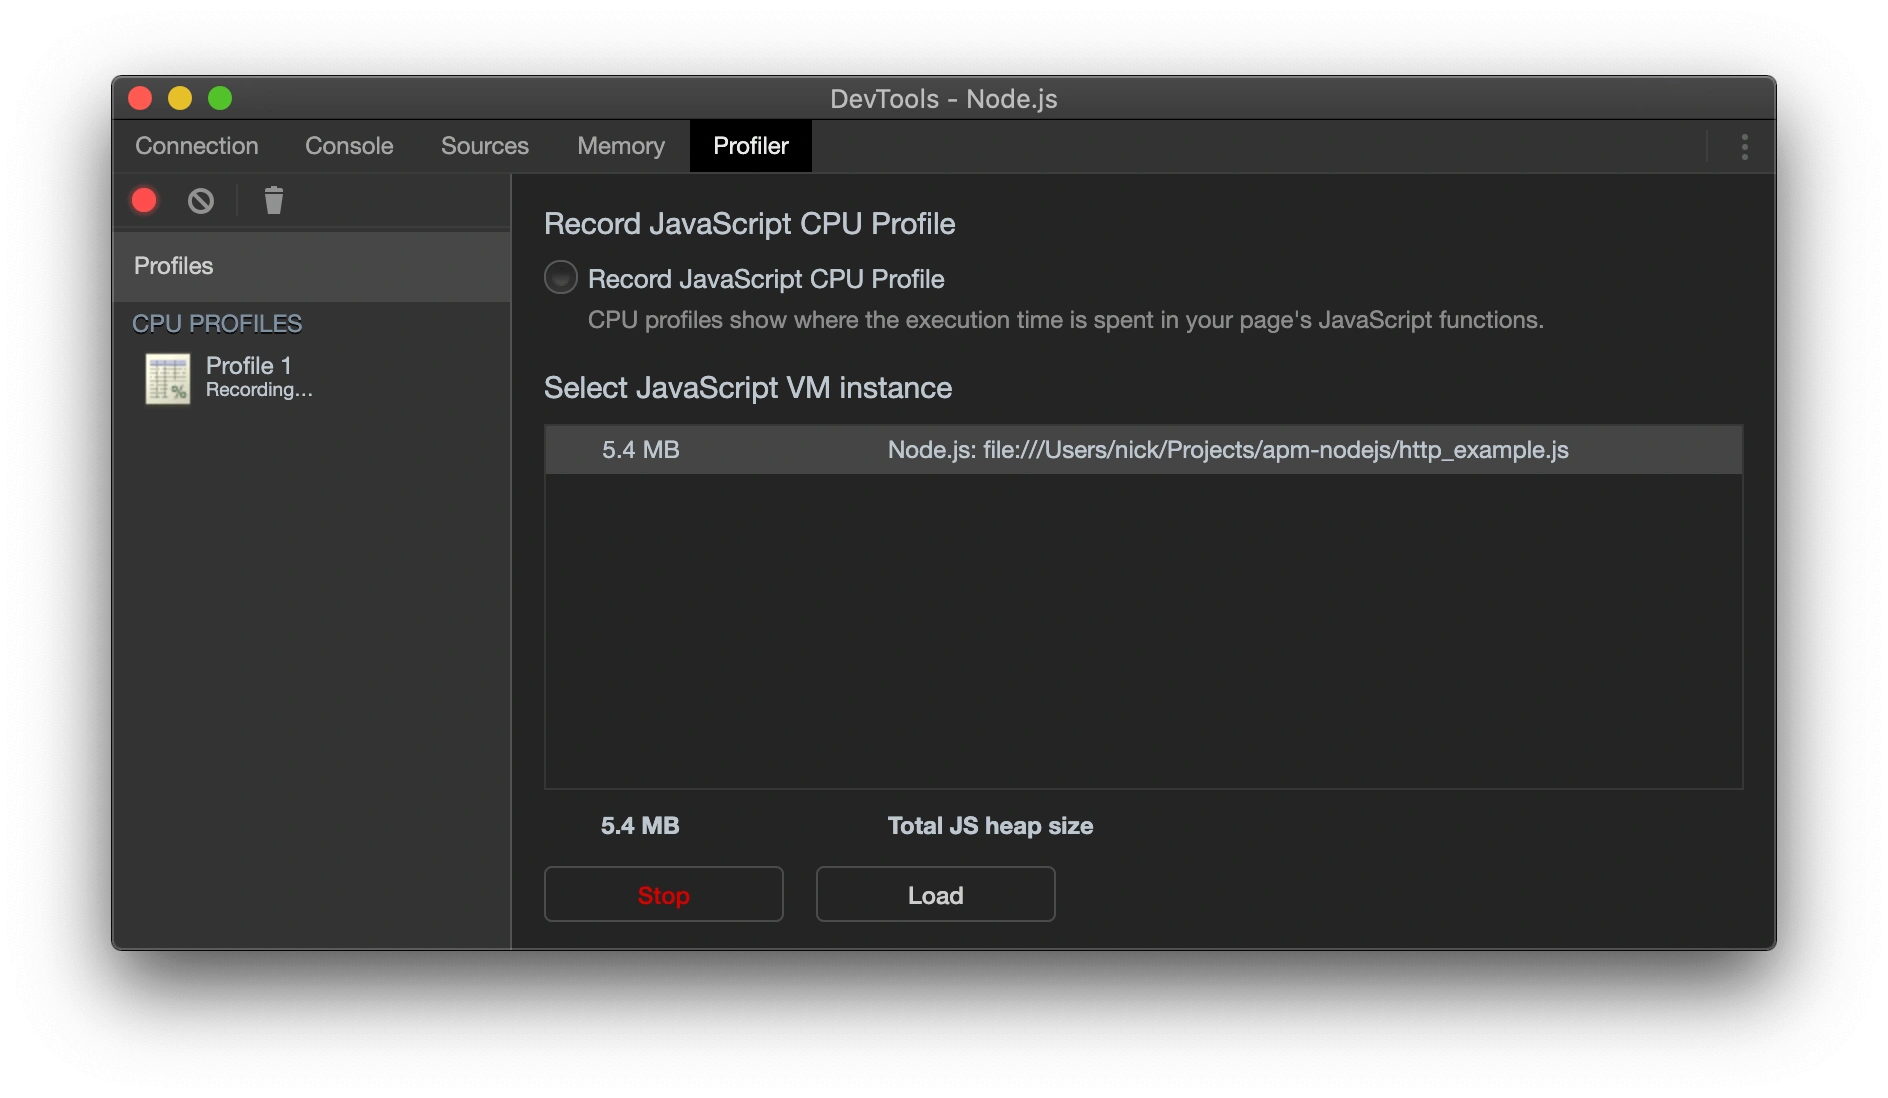
Open localhost:3030/fast in your browser, or run curl localhost:3030/fast on the command line, then click the Stop button in the Node.js DevTools window.
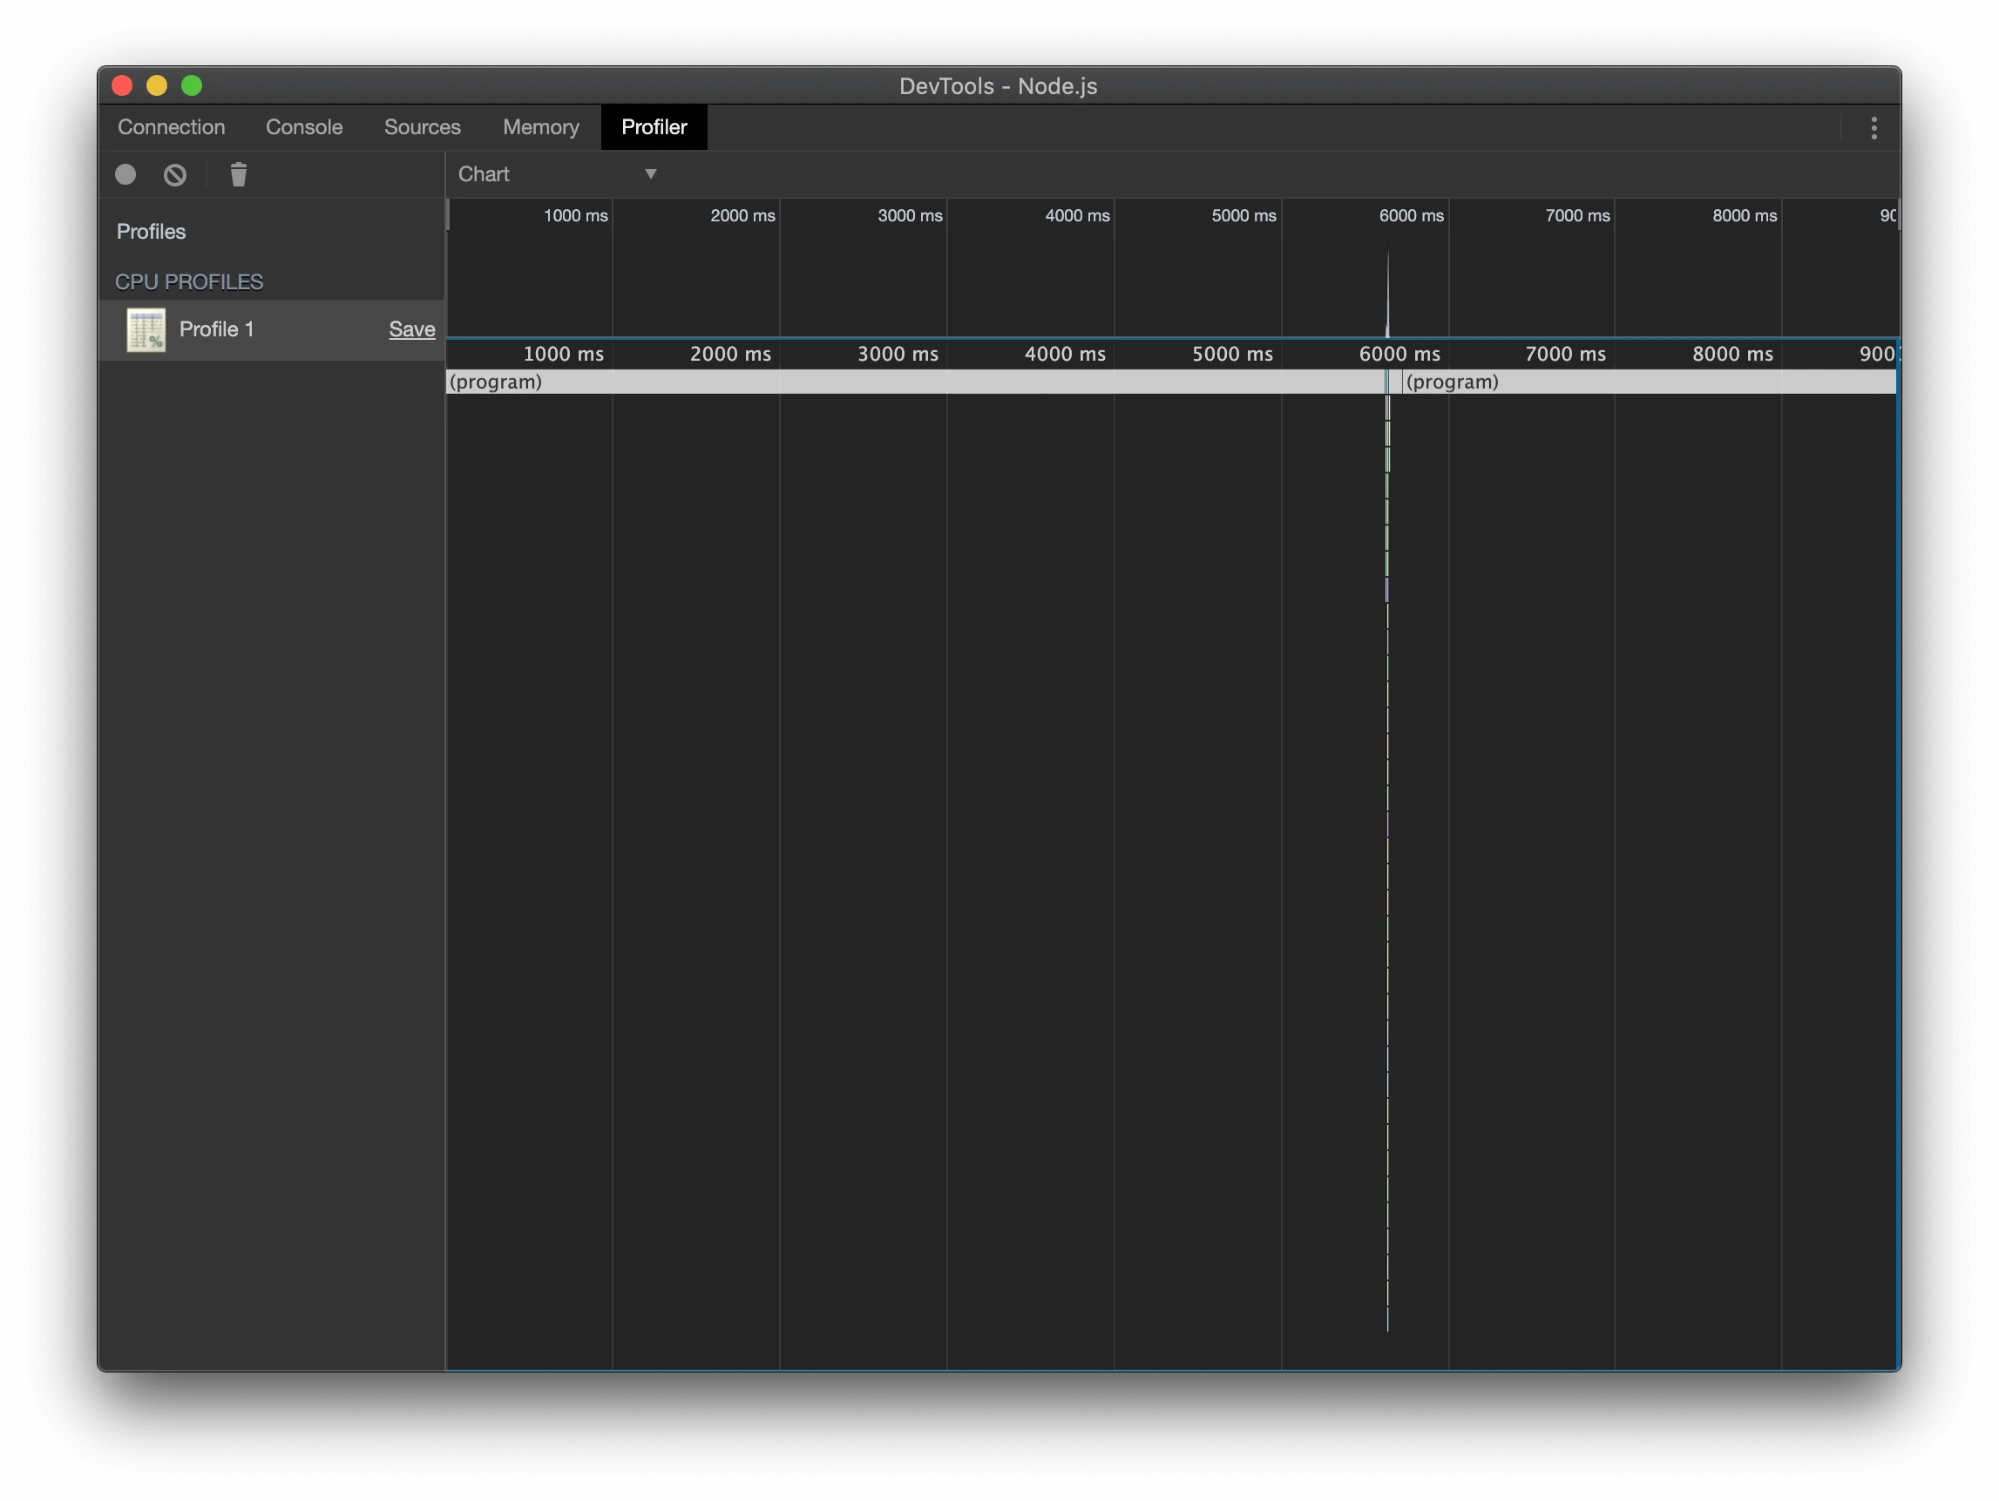
After the profile has finished processing, it will open. Select the “Chart” view from the dropdown at the top of the profile view if it is not already selected.
By default, the profiler shows the entire trace, which contains a lot of idle time. We can zoom in on the key part using the mouse wheel or by clicking and dragging in the timeline at the top of the profile view.
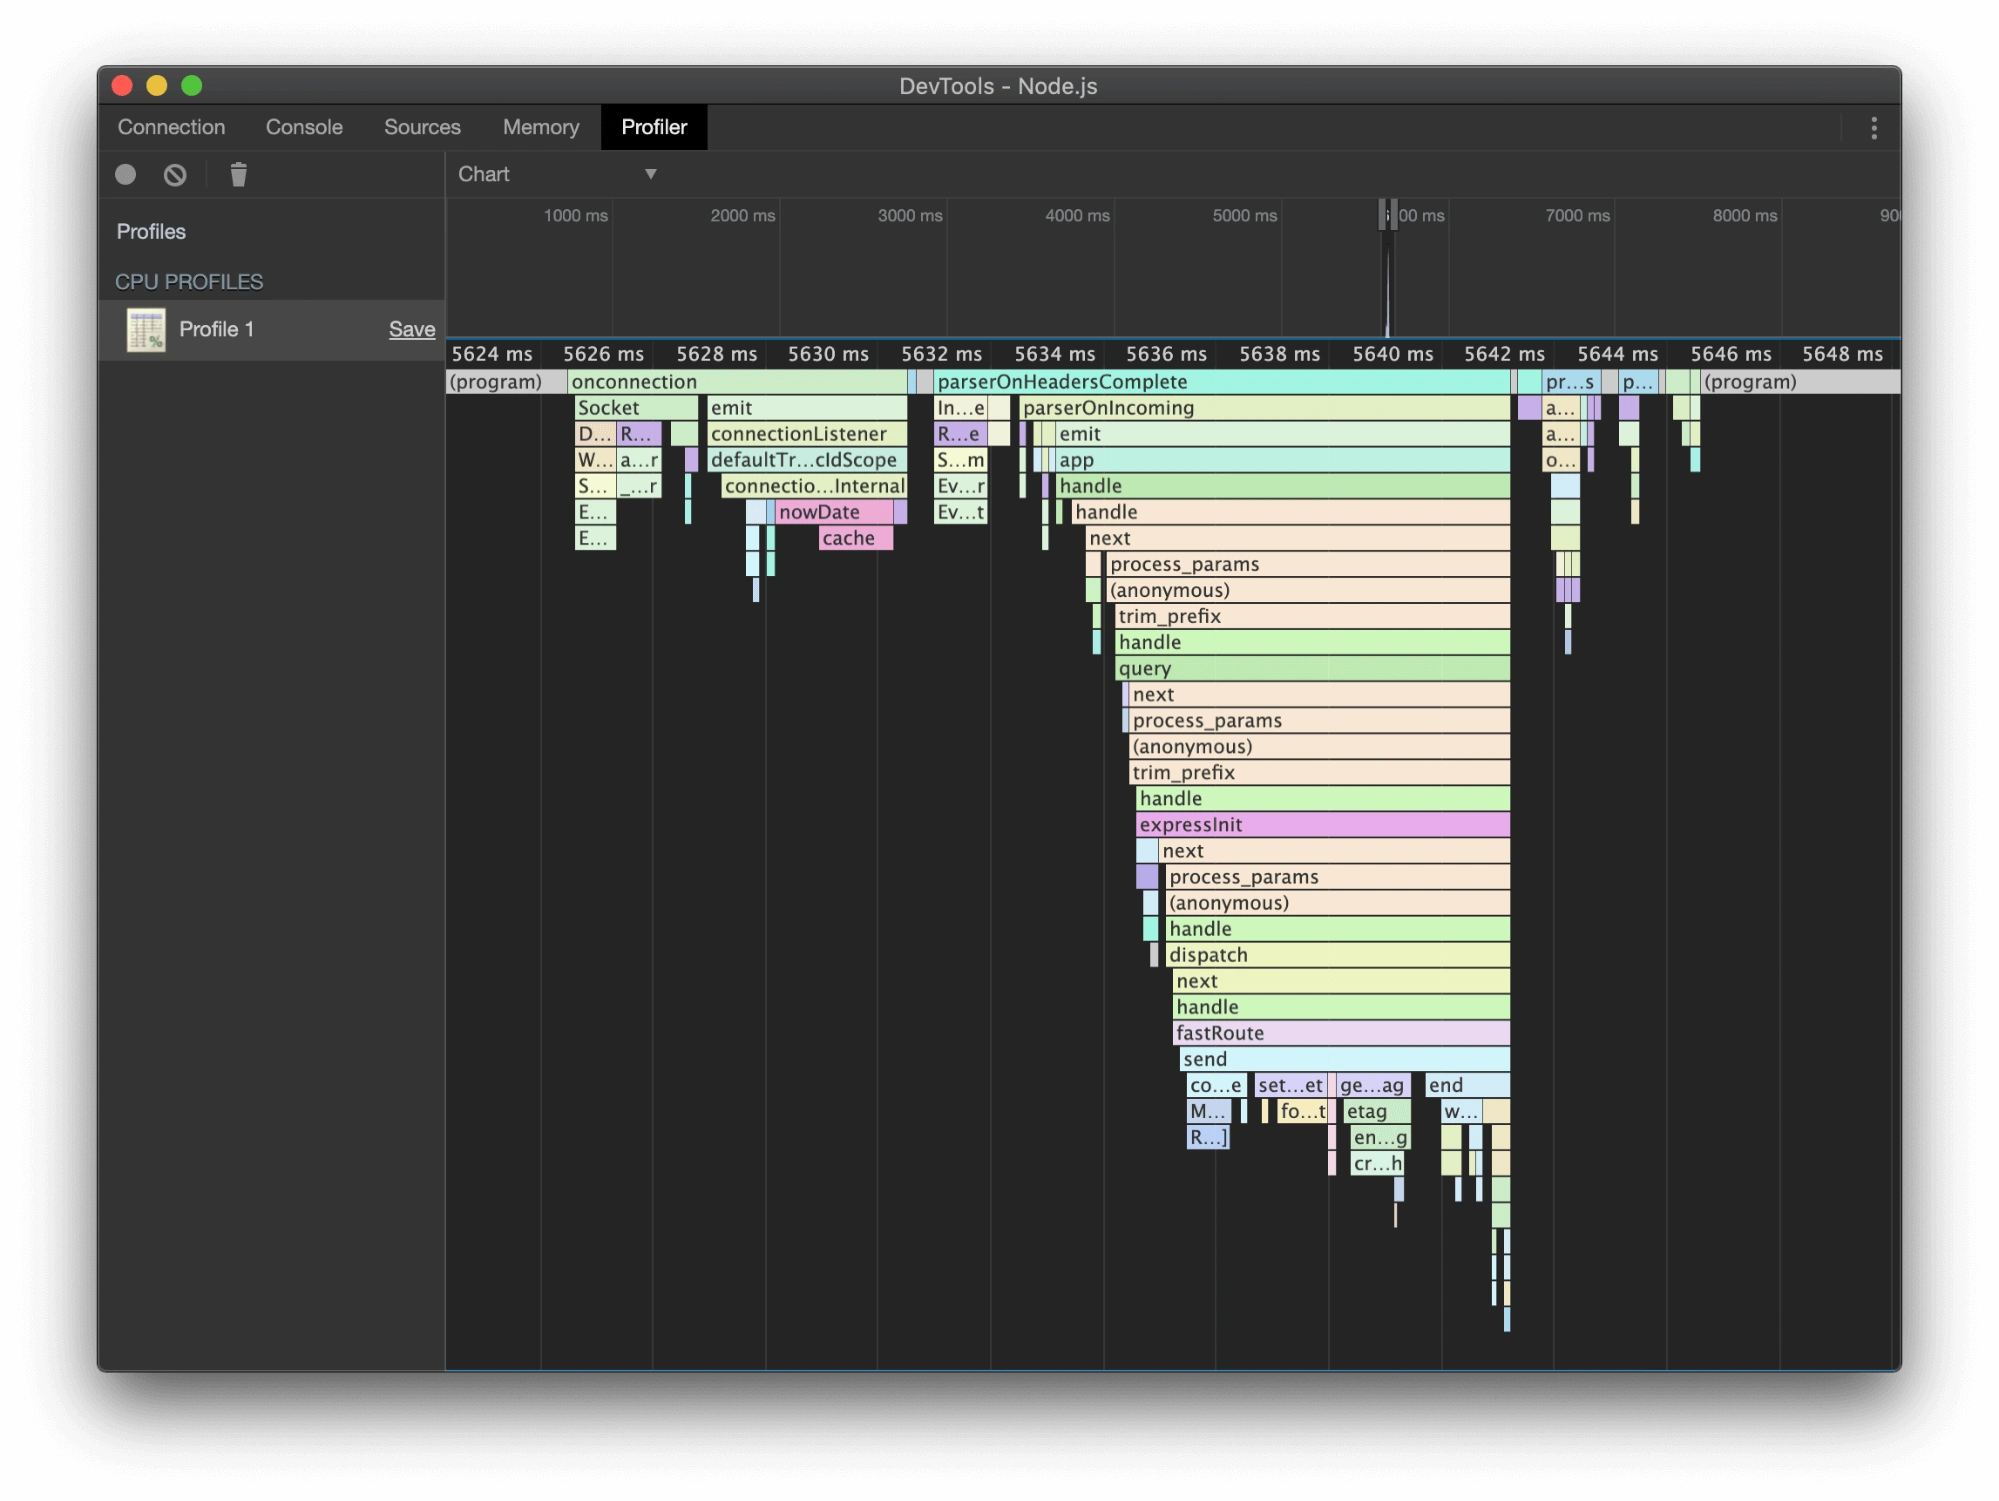
The fast route in our sample application only responds with the string “Success”. Most of this profile shows internal frames from express.
It helps when profiling an application to build up a narrative about what’s happening in your code.
To start with, we can see an onconnection frame. Hovering over it shows that it comes from the Node standard library file net.js. This shows the socket creation for the new connection.
The next chunk of frames sits under parserOnHeadersComplete. It includes routing logic, parameter processing, and our handler (fastRoute). The final sections show the response sending over the socket, followed by the socket closing.
This profile is a trivial one since it doesn’t contain any slow user code, but it’s useful as a baseline when comparing against a slower request.
Using the same process as before, we can capture another profile. This time, instead of loading localhost:3030/fast, we’ll load localhost:3030, which hits our slow route.
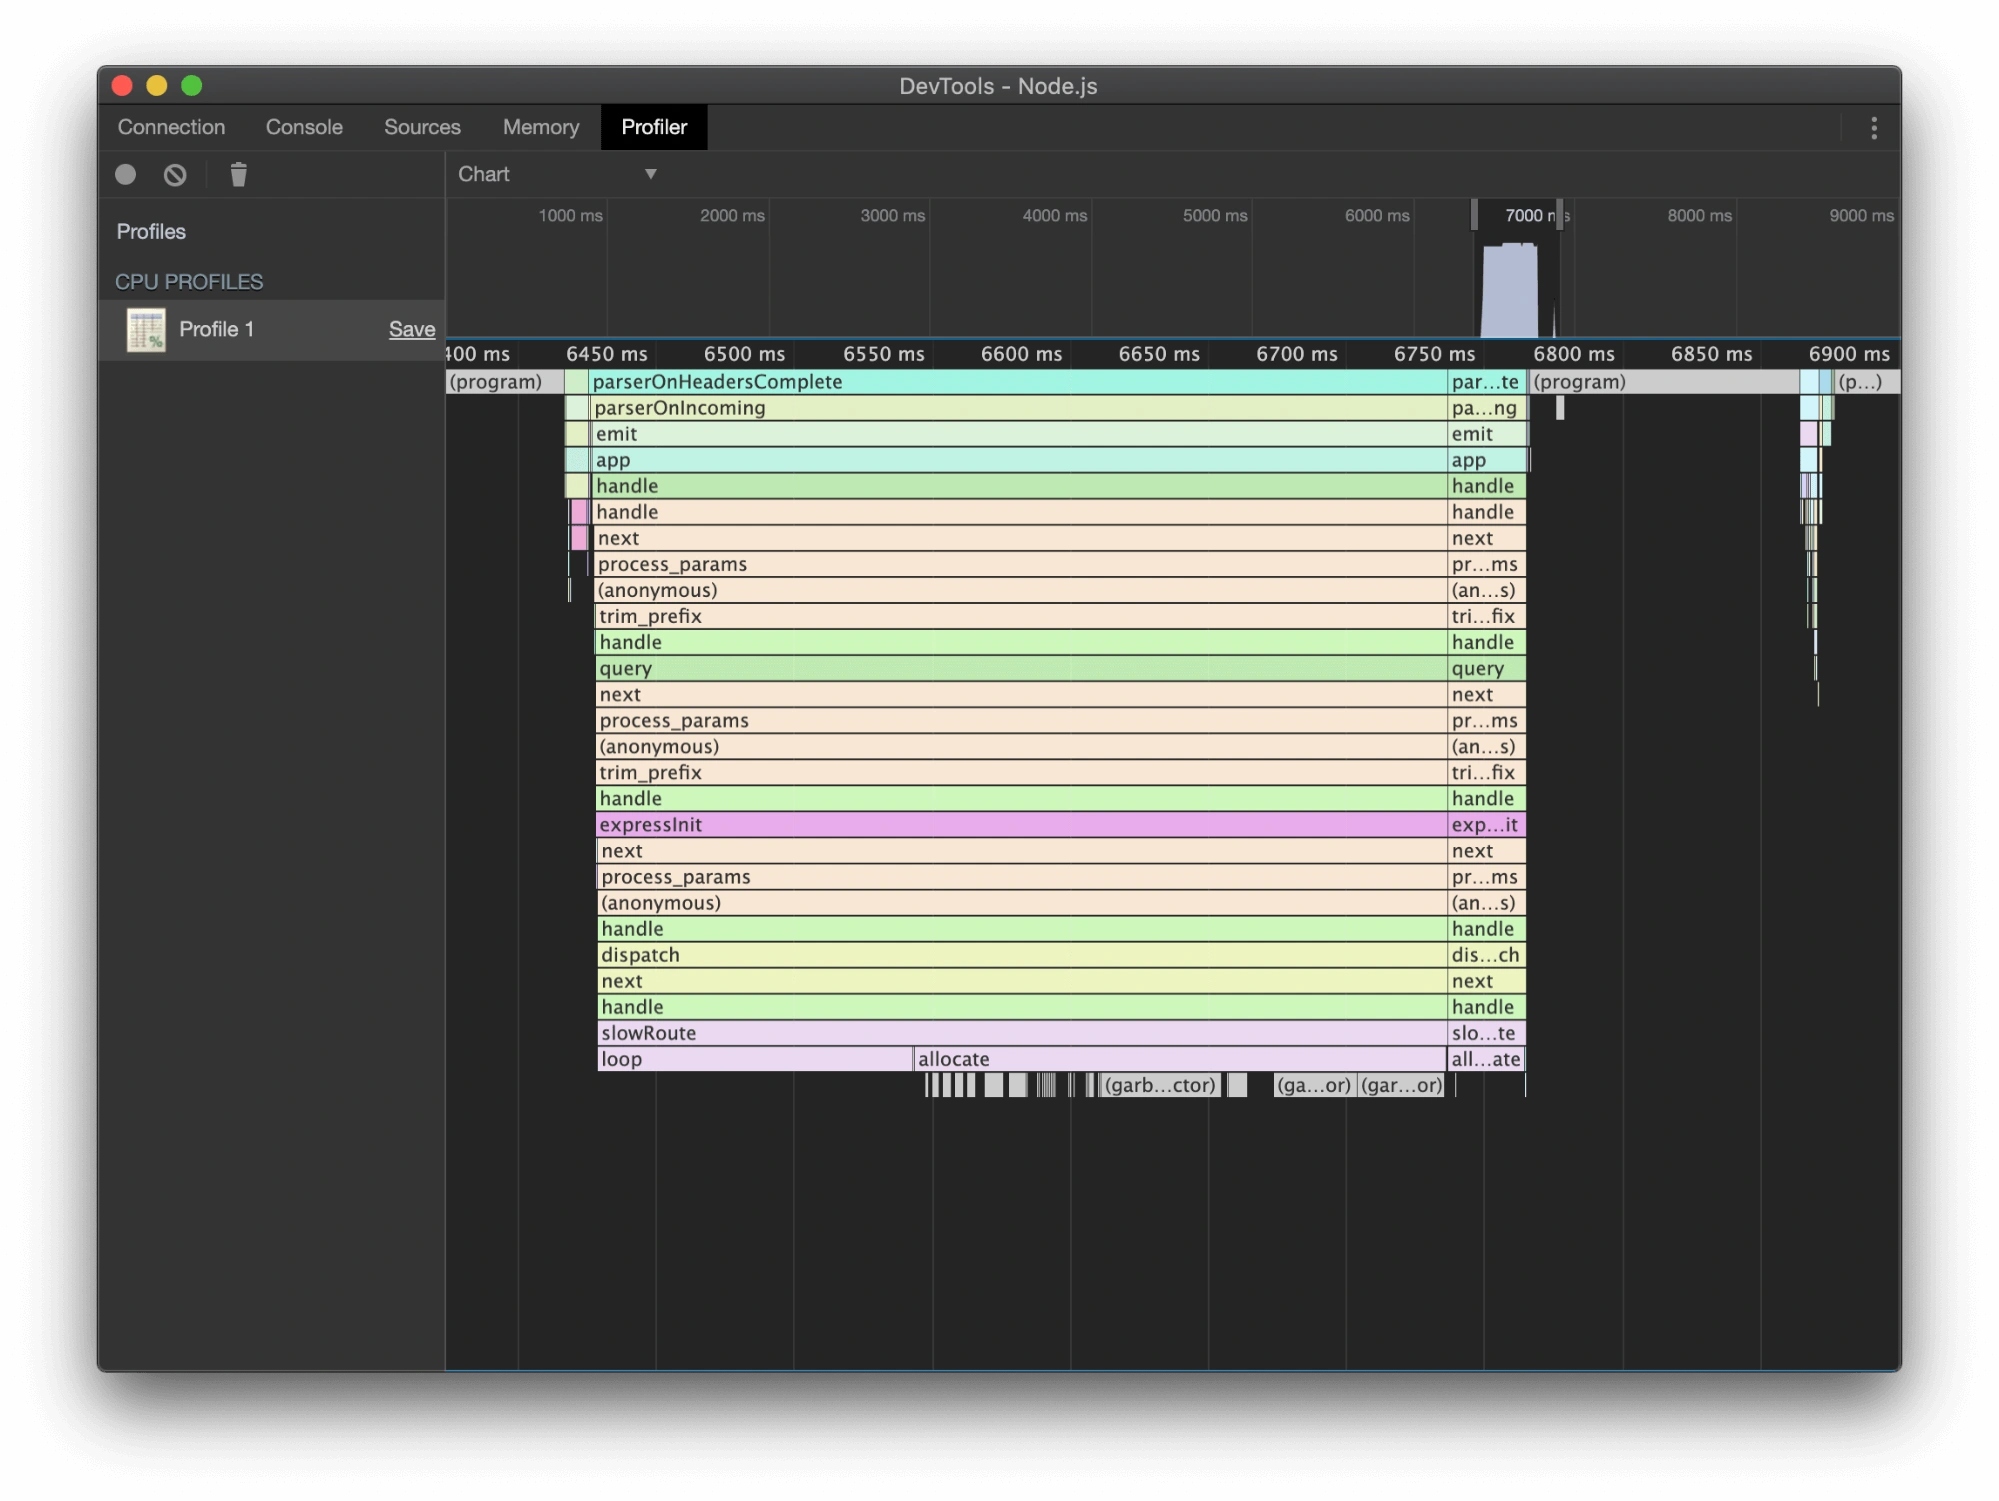
The profile for our slow route contains a lot more information. We can see some interesting detail about how V8 is executing our code. The slowRoute function takes up the most time in this trace. The loop function is the first to run, followed by allocate. The small gray frames below allocate are GC (garbage collection) frames. They represent V8 pausing the main JS thread to clean-up any unused memory.
It can be hard to understand how GC impacts the performance of our Node.js applications. By profiling key sections of code we can see when we’re running into delays caused by GC.
We can also see the result of calling setTimeout before sending the response. After the allocate function ends, you can see a gap before the final response sends where the Node process is idle.
There’s one more interesting thing to note about this trace, and it’s that the allocate function has split into two different frames. This is strange because allocate is only called once, and doesn’t do any complicated control flow. The reason for this is that V8’s CPU profiler is a sampling profiler.
Some profilers work by tracking data when function/method calls start or end. This is often called a method-level profiler.
In contrast, a sampling profiler captures the call stack at a regular interval. This means that not every function call will show up in a profile, since it might run too fast to be sampled.
By default, the V8 profiler samples the call stack every millisecond. This means that if your function executes in less than a millisecond, it might not appear on a profile.
The upside of this design is performance. The overhead of a method level profiler increases as your application gets busier since there are more method calls to track. In contrast, the overhead of a sampling profiler stays steady regardless of how busy your app is. On top of that, sampling profilers will only omit code that executes extremely quickly. The slow functions that we care about profiling are always included.
Bonus Node.js performance tip
Creating new objects in JavaScript takes up memory, but did you know it also takes up CPU? The more objects you have, the longer the garbage collector spends finding them to clean up. This means that creating many objects can cause severe Node performance issues. If you need to make lots of objects, consider using a Buffer-based data structure like Flatbuffers or CapNProto instead.
Let’s capture one more profile with the Node DevTools. This time, start a profile, then make two requests of localhost:3030 in quick succession. The easiest way to do this is to run curl localhost:3030 & curl localhost:3030 from a Unix shell. You can also navigate to localhost:3030 in your browser and then immediately refresh once it finishes loading.
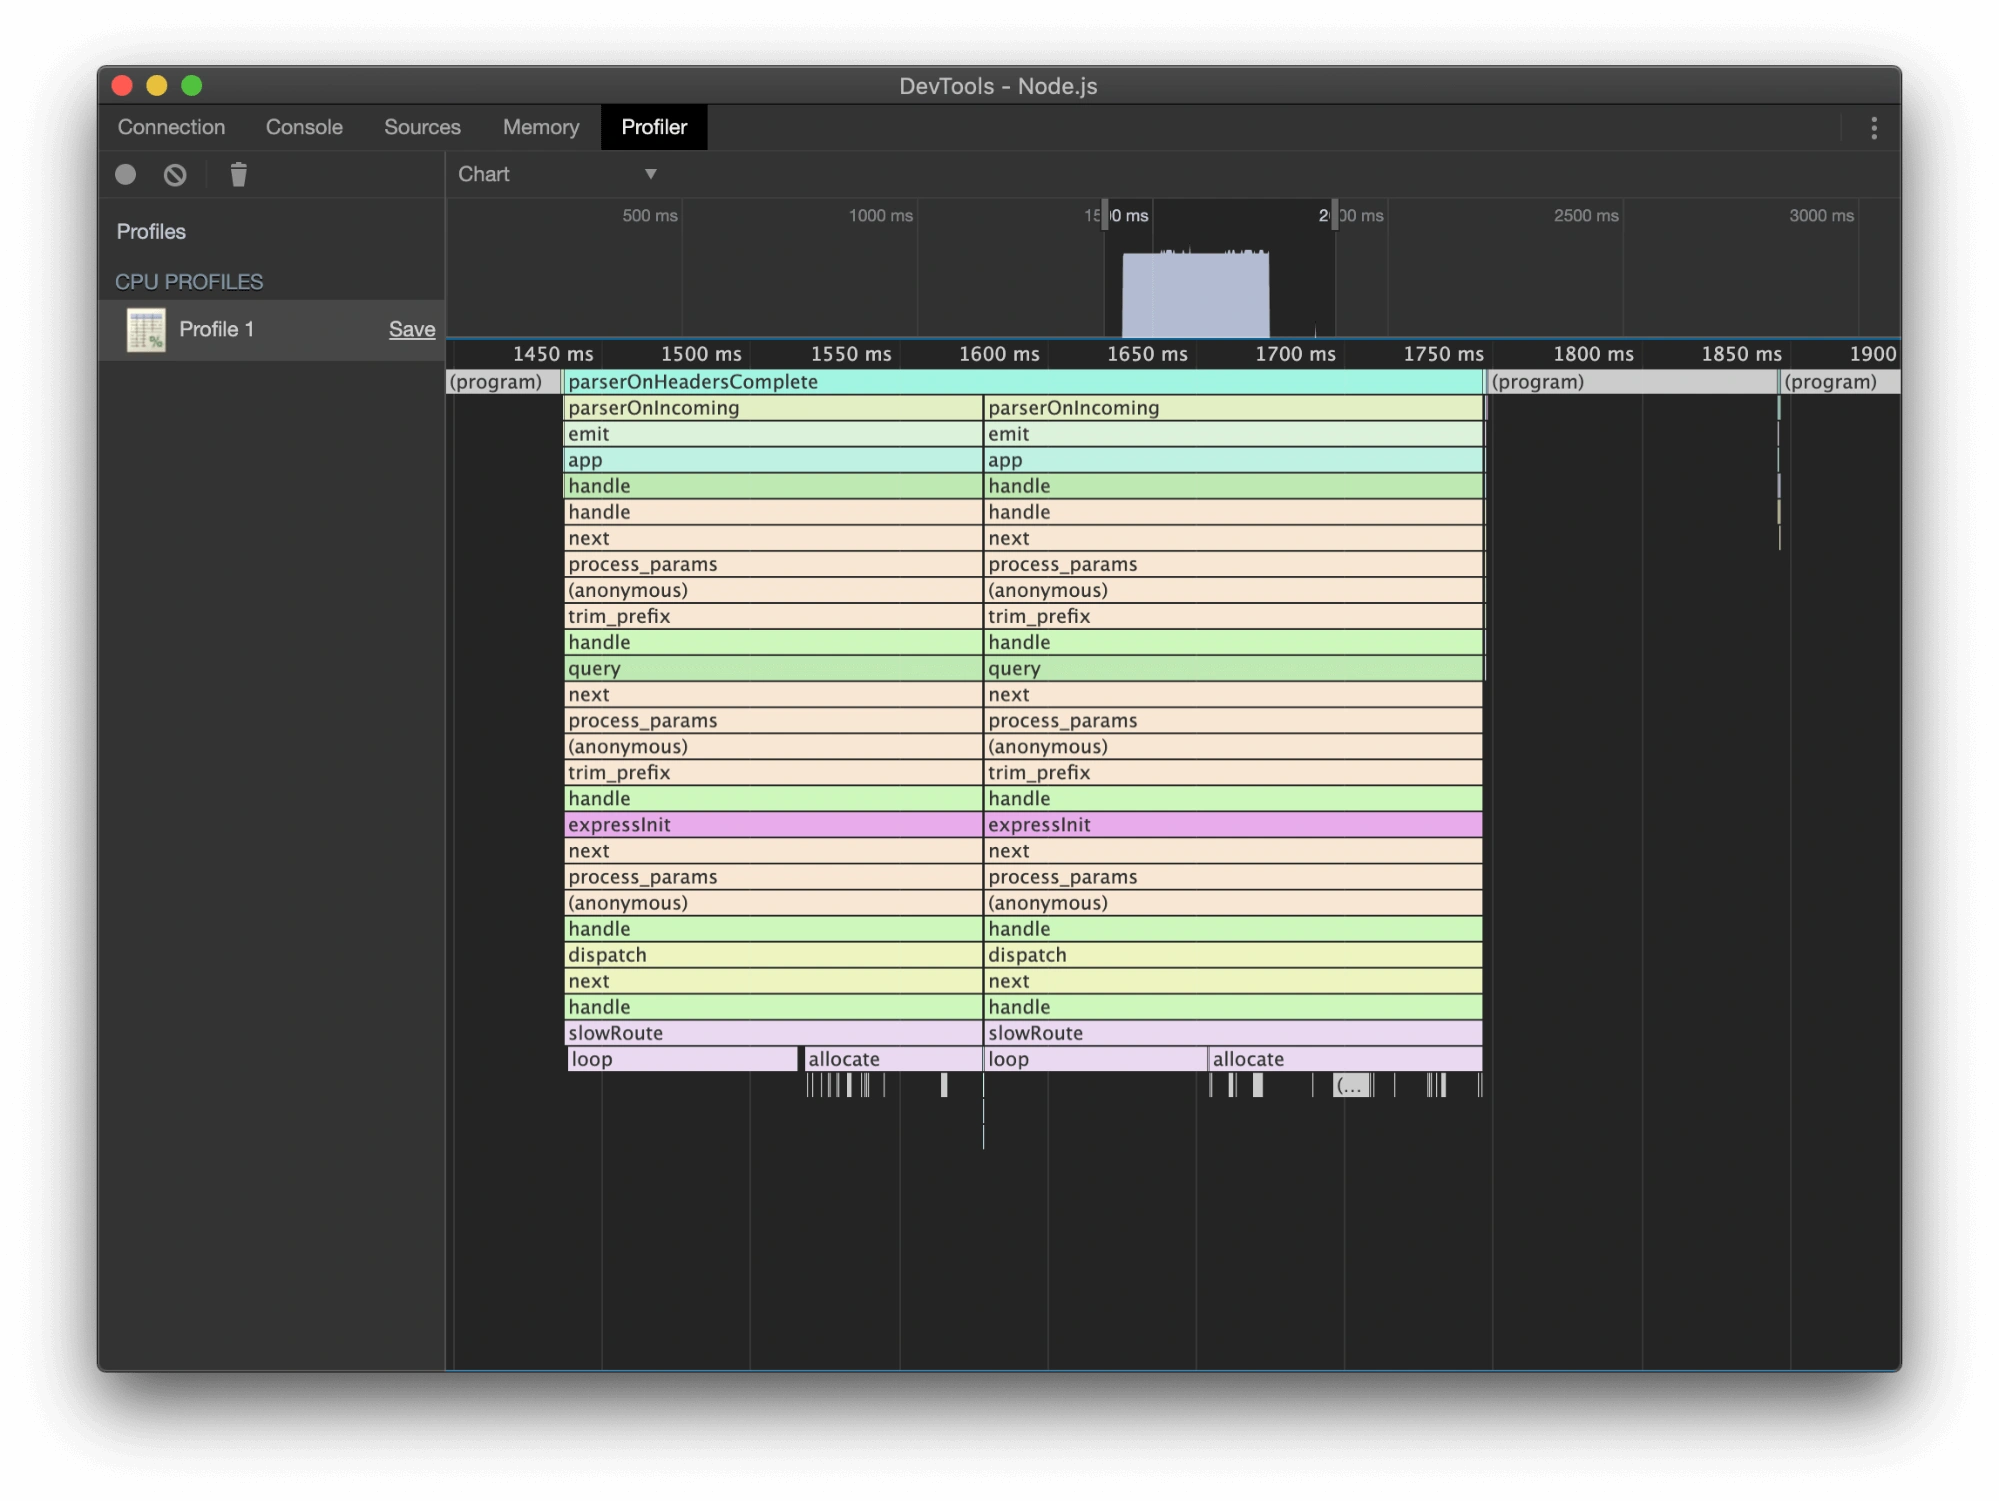
In this profile, we can see a slowRoute call for each of our requests. What’s notable here is that the requests process concurrently, due to the use of setTimeout. Once the loop and allocate steps are complete for the first request and setTimeout is called, the second request begins to process. Once the second bout of loop and allocate calls are complete, the response for the first request is sent.
node --inspect and Chrome’s DevTools are a convenient way to profile our local applications. But what if we want to get this sort of information in test/production? Or if we want to see more information, like HTTP queries and database requests?
2. Monitor and profile with APM
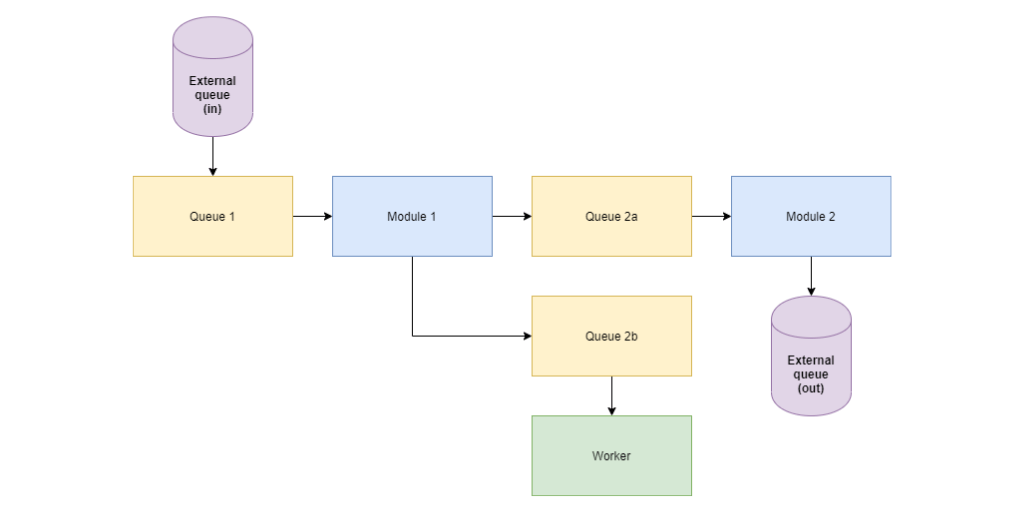
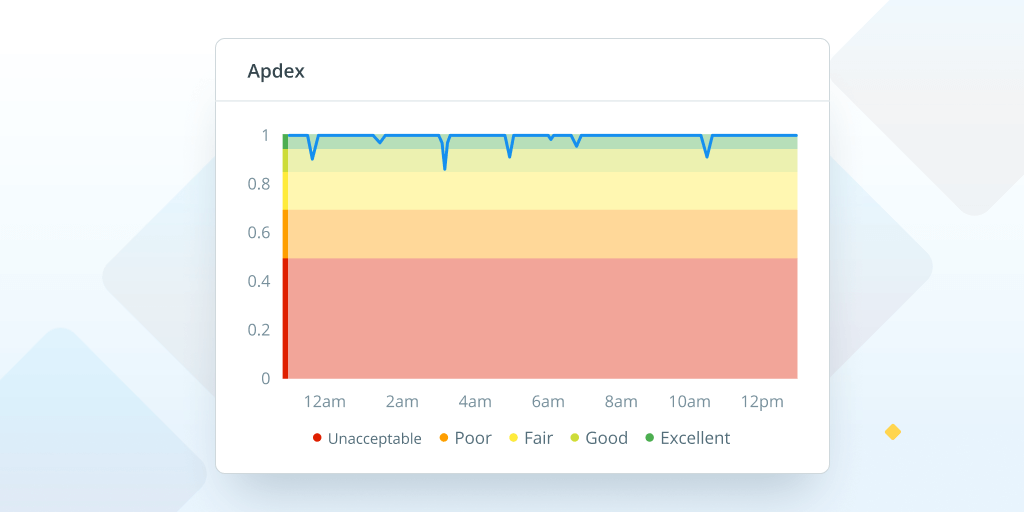
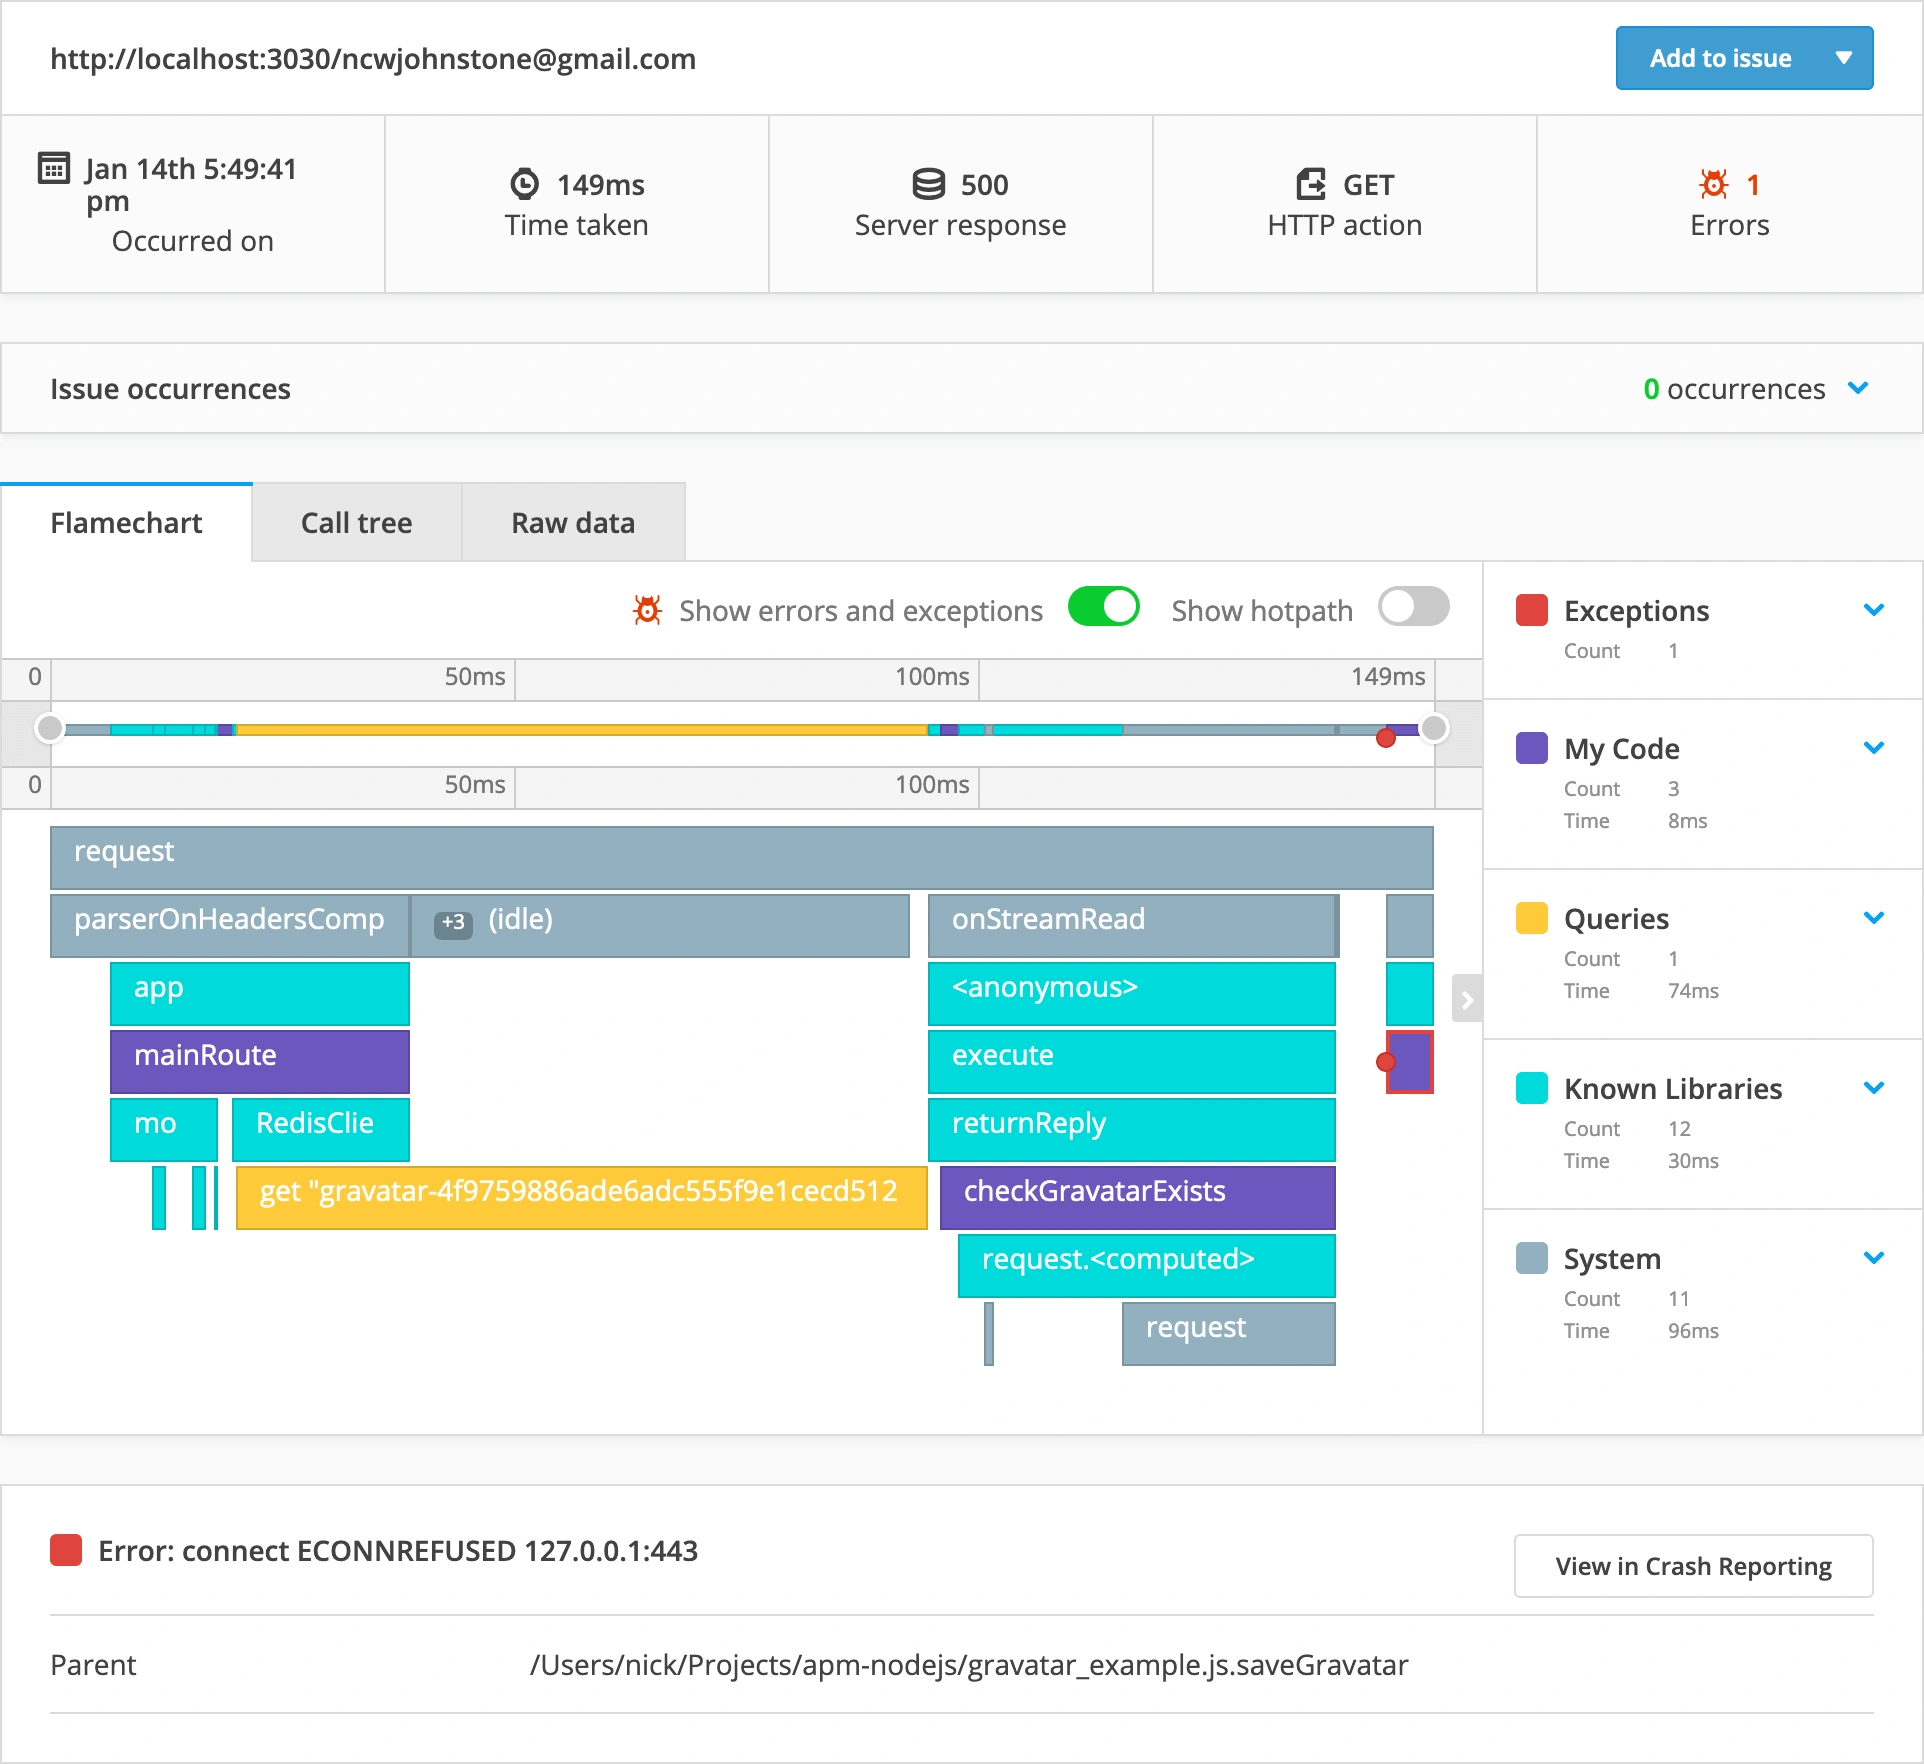
APM helps with understanding the performance characteristics of your Node.js application, identifying and analyzing the bottlenecks in your code that are causing slow response times, high CPU utilization, and memory leaks. For each HTTP request to your app, Raygun APM will capture a profile and display it as a vivid flamechart breakdown.
Monitoring with a powerful APM tool can uncover the performance pitfalls in your Node.js application with various methods of testing.
| Type of test | What does it do | What issue does it target |
|---|---|---|
| Endurance Testing | Determines web application load capacity and solves memory leakage problems | Load capacity and memory leakage |
| Load Testing | Measures the application’s responses and use to determine how much load the system can withstand before failing | Application load and system failure |
| Scalability Testing | Helps businesses scale operations and find/fix errors and bugs preventing web application scaling | Application scaling and error/bug resolution |
| Spike Testing | Tests application behavior during significant rises or drops in load | Application behavior under extreme load |
| Stress Testing | Determines system functionality outside of normal working conditions and how much it can tolerate before failing and recovering | System functionality and recovery under stress |
| Volume Testing | Determines if a system can handle large amounts of data | System capacity for handling large data sets |
By using APM as your profiler, you can gain valuable insights into the performance of your Node.js application and make informed decisions on which areas of your application to optimize. Our weapon of choice to profile our applications is Raygun APM for Node.js.
Raygun provides a polished APM experience out of the box, taking the typical V8 profiler to the next level. It includes support for common web frameworks and database adapters.
The tool captures detailed performance data for traces, and allows users to configure how often you capture a sample to increase detail or reduce overhead. It also supports capturing information about queries and requests performed by the application. Along with its integration with Raygun’s Crash Reporting and Error Monitoring, you can bulletproof your Node.js application development process.
3. Use caching to reduce latency
Caching is a popular technique that can greatly improve the performance of your application by reducing its latency.
Caching is a technique used to store frequently accessed data in a location that can be accessed quickly. By caching data, you can avoid the need to retrieve it from a slower primary source, such as a database or network, every time it is requested.
To implement caching in Node.js, you can use popular caching libraries such as Redis or Memcached. These libraries provide a simple key-value store that you can use to store data in memory.
First, you need to check if the data is already in the cache before fetching it from the database or external API. If the data is found in the cache, you can return it directly without any additional processing. This can be particularly useful for mobile applications or other situations where bandwidth is limited.
If the data is not found in the cache, you can fetch it from the database or external API and then store it in the cache for future use. You can set an expiration time for the data in the cache to ensure that it is updated periodically.
4. Optimize your data handling methods
Optimizing data handling methods is essential for any node.js application that deals with a large amount of data. Inefficient data handling can lead to increased response times and even crashes. Here are some tips to help optimize your data handling methods in node.js:
- Use streams: Streams are a powerful tool in node.js for handling large amounts of data. They allow you to process data in small chunks, reducing memory usage and improving performance. Instead of reading the entire file into memory, you can use streams to read and process data as it arrives.
- Filtering: Filtering is another important technique that can significantly improve performance by reducing the amount of data that needs to be processed. When dealing with large datasets, this is especially important so that your application is not processing heaps of unused data unnecessarily.
- Implement pagination: Pagination is a technique used to split large data sets into smaller, more manageable pieces. This can improve the performance of your application by reducing the amount of data that needs to be loaded and displayed at once.
- Optimize database queries: Inefficient database queries can slow down your application. You can optimize your queries by indexing your database and using the appropriate query types.
Don’t overlook the large-scale benefits for the development of your application. While the performance benefits may not show in the early stages, it may come back to bite you once you start scaling your applications to process large amounts of data regularly.
5. Use timeouts
Timeouts are a useful tool in Node.js for measuring the performance of your code and identifying potential bottlenecks. A timeout is simply a mechanism that allows you to set a timer for a certain amount of time, after which a callback function is called.
To use a timeout in Node.js, you can use the setTimeout() function, which takes two arguments: the callback function to be called after the timeout, and the amount of time to wait before calling the function (in milliseconds). Here’s an example:
setTimeout(() => {
  console.log('Timeout complete.');
}, 1000);
In this example, a timeout is set for 1000 milliseconds (1 second), after which the callback function is called and the message “Timeout complete.” is printed to the console.
You can also use timeouts to measure the performance of your code by setting a timeout before and after a particular function or block of code, and then measuring the difference in time between the two timeouts.
Use this to measure your application’s API calls, which are a common bottleneck that often goes unnoticed. For example, the following API call to Axios, which does not have a timeout, can be measured:
function makeAPICall() {
  // Code to make the API call goes here...
}

const startTime = Date.now();
setTimeout(() => {
  const endTime = Date.now();
  console.log(`Time taken: ${endTime - startTime} ms`);
}, 1000); // Timeout set to 1 second

makeAPICall();
In this example, the startTime variable is set to the current time using the Date.now() function. The code to be measured is then executed, followed by a timeout of 1000 milliseconds. When the timeout callback is called, the endTime variable is set to the current time, and the difference between the startTime and endTime variables is calculated to determine the elapsed time. This elapsed time is then printed to the console.
Using timeouts in this way can help you identify which parts of your code are taking the longest to execute, and where you might be able to optimize your code to improve performance.
6. Ensure secure client-side authentication
Web-based applications require a secure storage mechanism for session data to effectively sustain user authentication and monitor user sessions. Saving session data on the client-side can trigger severe security risks. As a result, session data is usually stored on the server-side. Express-session, a session management system, can be employed in Node.js to accomplish this task.
While memory-based session data storage may suffice for smaller-scale applications, it can produce certain performance issues for larger applications. In these cases, a centralized database solution such as Redis is a more fitting option. For scalability, it is important to ensure secure client-side authentication.
To impede session hijacking and unauthorized access to session data, secure storage methods are indispensable. Enabling secure cookies, establishing session timeouts, and regularly rotating session IDs can ensure secure session data storage. Additionally, using HTTPS for the web application can furnish an extra layer of security for session data.
7. Improve throughput through clustering
Improving the throughput of Node.js applications is essential to enhance their performance. One method to accomplish this is through clustering, which involves creating numerous child processes capable of handling requests concurrently. Clustering helps distribute the load across multiple CPU cores, allowing the application to handle a greater number of requests simultaneously.
To implement clustering in Node.js, the cluster module can be utilized. This module enables the creation of worker processes, each running on a separate CPU core. The master process, which oversees the worker processes, can communicate with them through inter-process communication (IPC).
By default, the master process listens to incoming connections and distributes them to the worker processes using a round-robin algorithm. However, other load-balancing algorithms such as IP hash or least connection can also be utilized.
Clustering can significantly enhance the performance of Node.js applications, especially for applications that receive a substantial number of requests. However, it is crucial to ensure that the application is designed to work with clustering. The application’s state must be managed with extreme caution to guarantee that each worker process has access to the same information.
8. Use a Content Delivery Network (CDN)
Using a CDN is an effective way to improve the performance and speed of web applications. A CDN is a distributed network of servers that store cached versions of web content, such as images, videos, and other static assets. When a user requests a web page, the CDN delivers the content from the server closest to the user, reducing the latency and improving the page load time.
Some benefits include:
- Faster content delivery to users worldwide due to distributed servers
- Reduced load on origin server leading to improved website performance and availability
- Improved user experience due to reduced latency and improved page load times
- Improved scalability to handle large traffic spikes and accommodate growth
- Advanced security features such as DDoS protection and SSL encryption
- Reduced bandwidth costs through caching and content optimization
CDNs also provide other benefits such as improved reliability and availability. By storing copies of content across multiple servers in different geographic locations, CDNs can provide redundancy and fault tolerance, ensuring that content is always available to users, even if one or more servers go offline.
Some popular CDNs include Cloudflare, Amazon CloudFront, and Akamai. These CDNs offer a range of features such as DDoS protection, SSL/TLS encryption, and advanced caching options. Many CDNs also provide analytics and reporting tools to monitor and optimize the delivery of content.
9. Use asynchronous programming
Utilizing asynchronous programming techniques in Node.js can significantly enhance your application’s performance by enabling multiple tasks to run simultaneously without blocking the event loop. This is accomplished through the usage of callbacks, Promises, or async/await functions.
Some examples of asynchronous programming in Node.js include:
- Reading and writing files asynchronously using the fs module
- Making HTTP requests using the request or Axios modules
- Interacting with databases using the MySQL or mongoose modules
- Processing vast amounts of data using streams
By leveraging asynchronous programming, you can greatly improve the performance and scalability of your Node.js application.
10. Optimize database queries
One of the most critical performance bottlenecks in any application is often the database. In Node.js, optimizing database queries can greatly improve the performance and scalability of your application.
In Node.js, indexing your queries is a great way to start. It allows the database engine to quickly locate the data required for a given query. It’s essential to limit the amount of data retrieved from the database and avoid costly operations such as full table scans to optimize your queries.
Another important factor to consider is the use of ORMs (Object-Relational Mappers) such as Sequelize or Mongoose. ORMs provide a high-level abstraction of the database, allowing you to write queries in a more expressive and concise way. They also handle the details of connection management, query building, and result parsing.
In addition to these techniques, you can also consider using a database caching layer. We’ve referenced caching time and again for good reason - the performance benefits are substantial! By caching the results of these queries, you can reduce the number of times that your application needs to access the database, which can greatly improve performance with simple fixes.
11. Reduce the number of dependencies
When developing a Node.js application, you’ll usually employ different libraries and modules to aid in various tasks, like handling HTTP requests or linking with a database. However, the overuse of dependencies could significantly impact your application’s performance. Each added dependency contributes additional code to your project, and Node.js developers are often guilty of this.
To mitigate the number of dependencies, it is recommended to exclusively integrate the necessary modules for your application’s optimal functioning. Take the opportunity to review each module and examine whether it is genuinely needed.
An alternative way to lessen the number of dependencies is to search for approaches to combine multiple modules into a single one. For instance, if your application requires handling both HTTP and HTTPS requests, instead of utilizing distinct modules for each protocol, consider utilizing a single module that can handle both.
By reducing the number of dependencies in your Node.js application, you can enhance performance, reduce startup times, and minimize the possibility of security vulnerabilities.
12. Use a load balancer
To augment the functioning and accessibility of your Node.js application, it’s a good idea to implement a load balancer to apportion incoming traffic across multiple servers.
A load balancer serves to prevent a single server being overburdened with traffic, leading to a sluggish response or even unavailability. Equally distributing the traffic among multiple servers improves the overall efficiency of the application and helps accommodate a larger user base.
NGINX, HAProxy, and Amazon ELB are some of the sought-after load balancers for Node.js. In the interest of ensuring seamless operation, all servers must have the same codebase and configuration to preempt any possible conflicts.
13. Streamline your code
Our last tip may be the simplest, but the most actionable, and relevant to not just every Node.js developer, but every developer. To keep an eye on efficiency while developing your application, here are just a few good habits:
- Employ efficient algorithms and data structures: Ensure that you adopt the most efficient algorithms and data structures to cater to your application’s requirements.
- Reduce I/O operations: I/O operations can be quite costly, so it is crucial to minimize them as much as possible. Rather than reading and writing to a file several times, read and write to the file once and save the data in memory.
- Leverage middleware: Middleware is instrumental in simplifying your code by enabling you to modularize and reuse common functionality throughout your application. This reduces code duplication and enhances the organization of your codebase.
The importance of Node.js improvement: 5 use cases
Node.js is responsible for the development of a variety of popular applications, so it’s a valuable skill to be able to monitor and improve the efficiency of Node.js code. To give you an idea of how much ground it covers, here are 5 of the most common use cases of Node.js:
Real-time web applications
Node.js presents a highly suitable option for developing real-time web applications, such as chat applications, gaming platforms, and collaboration tools. This is due to its event-driven architecture that allows for the creation of highly scalable and high-performing applications.
Additionally, Node.js excels in its ability to handle a large number of simultaneous connections, making it a suitable option for real-time communication.
Use Cases:
- Chat applications, such as Facebook Messenger or WhatsApp, which require constant communication between users in real-time.
- Gaming platforms, such as online multiplayer games, which require real-time updates and responses to user actions.
Microservices architecture
Node.js is well-equipped to support microservices architecture, a development approach that involves building applications as a suite of small, independently deployable services. The architecture of Node.js facilitates the development, testing, and deployment of services independently, leading to improvements in overall application performance and scalability.
Node.js offers a lightweight and efficient runtime, making it an excellent option for creating microservices.
Use Cases:
- E-commerce platforms, such as Amazon or eBay, which have multiple services that work together to provide a seamless shopping experience.
- Banking applications, such as PayPal or Venmo, which have multiple services that handle transactions, user authentication, and security.
Single-Page Applications
The widespread adoption of Node.js is evident in its use for building single-page applications (SPAs), which provide a seamless user experience. SPAs require constant communication between the client and server, a task that Node.js is well-suited to handle. Moreover, Node.js enables developers to use the same programming language for both the client and server-side of the application, which makes it easier to maintain and debug.
Use Cases:
- Social media platforms, like Facebook or Twitter, which provide a seamless experience as users scroll through their feeds and interact with content.
Server-side proxies
Node.js is a great choice for creating server-side proxies because of its lean and efficient runtime. The development of contemporary applications necessitates server-side proxies that can communicate with a variety of services and platforms.
Fortunately, Node.js can manage a vast number of simultaneous connections, making it a solid choice for constructing server-side proxies that require exceptional performance and scalability.
Use Cases:
- Building a reverse proxy to manage incoming traffic to a web server
- Creating an API proxy to securely communicate between different services and platforms
DevOps tools
Node.js is also used for developing DevOps tools such as build automation, continuous integration, and deployment tools. DevOps involves automating the software development process to increase efficiency and reduce errors. Node.js provides a lightweight and efficient runtime that is perfect for building DevOps tools.
Tools built with Node.js:
- Jenkins, a popular continuous integration and deployment tool.
- Grunt, a build automation tool.
- PM2, a process manager used for managing Node.js applications in production environments.
Wrapping up
Node.js is a powerful platform for building high-performance applications, but optimizing your code can be a challenge. By implementing the strategies we’ve discussed, including caching, data handling, timeouts, secure authentication, and session storage, you can greatly improve the performance and security of your Node.js applications.
With Raygun’s Node.js APM, you can gain even deeper insights into your application’s performance, identify bottlenecks, and quickly resolve issues before they impact your users.
Raygun APM for Node.js is available now. If you’re an existing Raygun customer, log in to the Raygun app, select APM from the sidebar, and follow the setup instructions to start your free trial. If you’re new to Raygun, take your 14-day free trial here.