Welcome to Raygun APM: A quick-start guide for new and returning customers
Posted Nov 23, 2020 | 7 min. (1441 words)Welcome to Raygun APM.
Raygun’s modern Application Performance Monitoring (APM) beats traditional solutions by providing actionable, developer-level insights into server-side performance issues.
In this article, you’ll learn how to set up Raygun APM to be the most effective, plus a few key features that we recommend.
The essential setup section of this guide will help you navigate through creating the foundation of your Raygun APM setup. Once you have the basic steps completed, we recommend you follow the advanced guide to start receiving and displaying data that suits your preferences and developer workflow.
If you get stuck, or would just like the peace of mind, you can request a demo. Send this request form, and we’ll be in touch to organize a time.
Raygun APM supports .NET, .NET Core (including Azure App Services), and Ruby. Other language support will be made available in the near future, and you can register you interest in this Google Form.
Essential setup
- Start sending data to Raygun
- Filter unwanted data using code filtering
- Integrate your current technology stack
- Invite your team
- Set up notification preferences
Navigating your data
Advanced setup
- Visualize your data with Dashboards for APM
- Understand the effect of changes to your codebase over time with Apdex scores
- The Flame chart
Next steps
Essential setup
1. Start sending data to Raygun
Setup instructions for Raygun APM will vary depending on whether you are new to Raygun or if you are a Raygun Crash Reporting or Real User Monitoring (RUM) customer. If you’re a new or existing customer, you will need to make sure you install the latest Raygun Agent on each server.
2. Filter unwanted data using code filtering
Now you have data flowing through your application, the next step is to ensure there is no unwanted data in captured traces.
For example, the Raygun Agent by default runs in a highly detailed capture mode which can result in CPU spikes when it encounters high method call count activity. To resolve this, we recommend filtering these methods. Once you’ve filtered unwanted data, continue to monitor your CPU usage and trace data, continually making incremental improvements.
Set up code filtering for unwanted data
3. Integrate your current technology stack
Integrations ensure that Raygun fits in seamlessly with your development workflow. Currently, Raygun APM supports the following integrations.
Slack
With the Slack integration, you can send APM issues to a Slack channel of your choice so that you can view and respond to the performance issues surfaced by Raygun APM.
View the APM integration setup for Slack
Jira Software
Raygun APM makes it a breeze to create or attach a Jira issue to an APM issue group directly from a Raygun APM issue page.
GitHub
Raygun APM and GitHub work together so that you can synchronize issues in GitHub with an issue inside Raygun APM—making it much easier to stay on top of any errors in your application.
The link to source feature allows you to view your source code from GitHub directly in the Raygun APM trace detail page into your source code in GitHub—making issue resolution easier and faster.
Please note that the GitHub Enterprise support for Raygun APM is not yet available.
View the APM integration setup for GitHub
PagerDuty
Raygun’s integration with PagerDuty ensures that no matter the time of day, your on-call team are alerted to problems that may be affecting your customers.
Configure APM rules to trigger PagerDuty notifications
4. Invite your team
Instead of asking team members to take a free trial, invite team members to your Raygun account by following the instructions in the documentation. (We understand you might want to explore Raygun first so that you can skip this step until you are ready.)
5. Set up notification preferences
Set up notifications preferences to get the optimum signal to noise ratio.
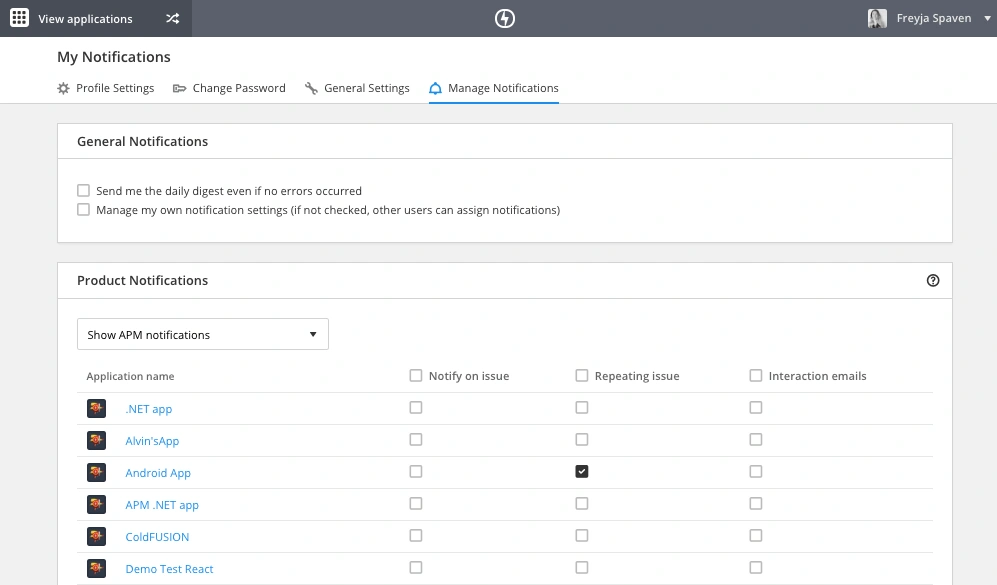
Raygun APM has three notification types:
- Notify on issue
- Repeating issue
- Interaction emails
You can see the options by navigating to your name in the top-right of the Raygun window, selecting the “Manage Notifications” option and choosing “APM” from the product dropdown.
Navigating your data
Our goal at Raygun is to make the APM data actionable for developers. Therefore, we do things a little differently to some leading APM solutions. Raygun’s data is more detailed, more accurate and more customizable than legacy tools. Here are a few ways to navigate your data so you can address any issues quickly.
Rules
Instead of asking you to specify performance parameters, (i.e., send me a notification when Apdex score is below 0.70), we’ve pre-made eight performance rules based on known poor performance indicators from the software industry.
You can also add your own custom rules, using both basic and compound rules.
Familiarize yourself with rules
The Issues page
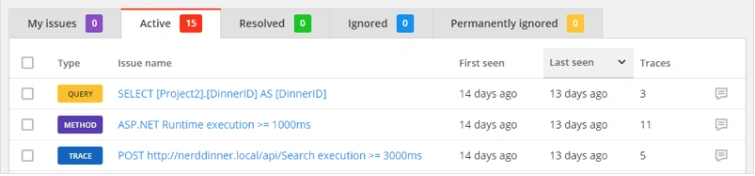
The “Issues” page in Raygun APM is a curated list of the current performance issues inside your application. These issues are created due to the violation of known performance rules. Every time a transaction (trace, method, query, or API call) violates a Raygun APM performance rule, an active issue is generated on the “Issues page”. Any subsequent sightings of the same rule violation by the same transaction will be grouped together under the same issue.
Explore the issues feature in the documentation
Sampling
Raygun’s sampling controls are highly customizable. They provide you with full control over the rate that traces are accepted into your Raygun APM account.
Familiarize yourself with custom sampling
Advanced setup
Once you’ve got the basics set up, and you are navigating your data comfortably, the next step is to optimize the presentation of your data and set up some benchmarks. The best way to do this is to create Dashboards and use industry standards like Apdex score to understand your app’s performance.
1. Visualize your data with Dashboards for APM
Having the data is only part of the puzzle—you need it presented in an easy to view and customizable format. Dashboards hold customizable data tiles designed to give you an at-a-glance health check of your app.
Read the guide to Raygun APM tiles to setup your first Dashboard
2. Understand the effect of changes to your codebase over time with Apdex scores
Apdex is an open standard used by platforms and services to provide a human-friendly way of interpreting user satisfaction and performance. Apdex scores put a number on how happy your users are when using your service, and help make it simple to track how that may change over time.
3. The Flame chart
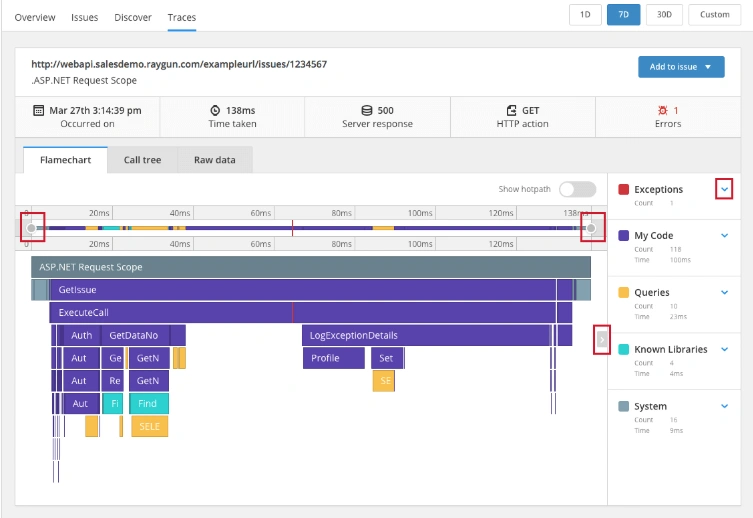
The Flame chart, which you can discover in the “Traces” tab, shows you the state of the stack for your code down to the nanosecond during the performance profile.
Next steps
Are you now a pro user of Raygun APM? You can consider expanding your monitoring capability with the Raygun Platform and get in touch with us with any suggestions.
Stay up to date with the Raygun agent
We update the Raygun Agent frequently to ensure stability and performance of Raygun APM. When there is an update available, you will see a banner appear in your app advising of the new Agent. Follow the link in the banner to upgrade to the latest Agent.
Updates will also be posted automatically on the “Downloads” page in the documentation.
The Raygun Platform
Raygun APM, Crash Reporting, and Real User Monitoring work together to give a full-stack understanding of the health of your application.
Raygun Crash Reporting enables you to diagnose and resolve issues users experience. Pinpoint root causes, without having to rely on logs, support tickets, and incomplete information.
Raygun Real User Monitoring ensures users have fast and reliable user experiences while using your web and mobile apps. Improve NPS, retention and customer satisfaction.
Language support
Raygun APM is available for .NET, .NET Core, and Ruby. We’re continuing to build our support for other languages, like Node.js, Java, Go, Python, and PHP.
Register your interest in other languages with this Google Form.
Suggest features in our forums
Is there something missing from Raygun APM that would make your life easier? Suggest what you need in our feature request forums. We read every one, and if we receive enough requests, we’ll get to work building it for you.
Are you still unsure about some of your plan settings or how to find features? Ask for a walkthrough of how best to set up your Raygun plan.
Happy Coding!