Raygun’s best feature releases of 2017
Posted Jan 15, 2018 | 6 min. (1269 words)In 2017, Raygun launched many improvements to our platform, most of them suggested by you, our customers. Every week, we released performance tweaks, major updates, or UI improvements to the platform.
Our primary focus was giving you more control and more visibility into your data, so you can better understand how your apps are performing for your customers.
For this post, we picked several of the most significant improvements from products to new integrations. Most of these are available out of the box, so make sure you are making use of them in 2018!
Quick search:
Crash Reporting
In 2017, the focus was creating better data visualization for your crash reporting data. Here are a few of the major updates.

Custom dashboards: Monitor the health of your software at a glance
Raygun gathers a great deal of data about how users are interacting with your application and whether it is performing at its best. We then present that data in an easy to use and intuitive UI inside the Dashboard. They are heavily customizable, too. Drag and drop intuitive tiles, select date ranges and omit data that isn’t part of your KPI set.
Here are a tutorial and video explaining more.
Breadcrumbs: Trace events quickly
Attach an accurate trail of the events through your system leading up to the moment a crash report was generated. You’ll gain more insight into why the application crashed when it did, making prioritization of fixes much easier. Here’s how to get set up:
- Raygun4JS – Supported in version 2.6.1 and above
- Raygun4Net – Supported in version 5.5.0 and above
- Raygun4Ruby – Supported in version 2.1 and above
Construct custom reports for a detailed view of errors
Early 2017, we released Reports so you can create, download, email, and save reports based on specific Crash Reporting data you want to focus on.
Here’s how to customize reports for your needs.
Deployment lines: Correlate crashes and deployments
Raygun Crash Reporting has always been able to track deployments–we just made deployment data more visible. The deployment lines feature correlates deployments with errors so you can get a visual representation of trends in error counts relating to a particular deployment.
Deployment lines are easy to setup, available to all plans and only takes a few moments.
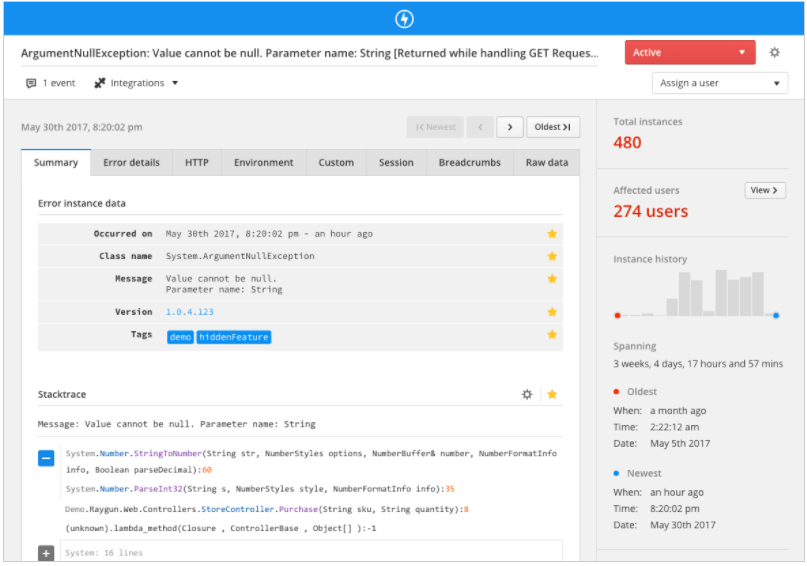
New stack trace design: Clearer data in the stack trace
In May 2017, our stack trace view went through a complete redesign. We:
- Updated the design for better readability
- Allowed group stack lines from common libraries (e.g., System in ASP.NET)
- Added collapsible code snippets and local variables for JavaScript and Python
- Included automatic multiple inner exception detection
You can see the before and after here.
New date range selector: Zoom in on problem days
Another UX improvement we made in 2017 was the new date range selector on the central Crash Reporting dashboard. Now, you can click and select the error graph to auto-zoom on a chosen time range.
More error group filters: Drill down into your data
Whether you need to drill down into the cause of an error or discover how customers received your latest version release, the error group filters give your team another quick and easy way to surface the data you need.
You can learn more about filters and how to use them here.
Real User Monitoring
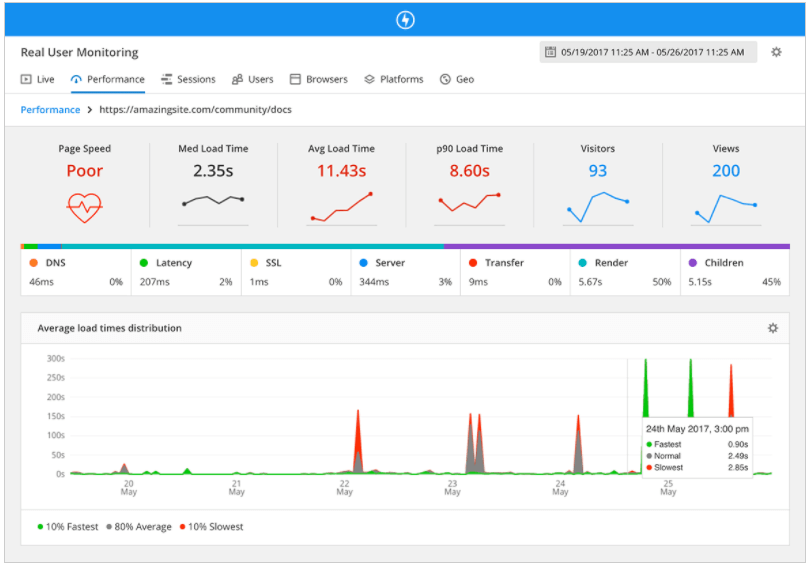
Real User Monitoring (RUM) saw both UI improvements and some major features that helps you pinpoint and fix performance problems in your app—no matter which browser, version, or location.

RUM export API: Search for sessions
With this API, Enterprise customers can search for sessions and drill into detailed session and user data. Augment other systems with complete performance and user experience data from Raygun Real User Monitoring.
Get started with the API documentation.
Custom Timings: Track more timings
By default, Raygun will pick up the OnContentLoaded event which can be very helpful. However, there are other timing events that you’d like to track. For example:
- Measuring the time until the user can interact
- Measuring the time on various sub-systems
Here’s a simple example from our documentation for how custom timings would work in an application.
Real User Monitoring filters: Surface RUM data faster
In June 2017, we added filters to Real User Monitoring. Filtering options are a game-changer for customers needing reassurance that any performance improvements made in specific environments are working.
Get more detail on how to get the most out of filters.
Compare: Analyse RUM data side-by-side
In August 2017 we announced our signature Compare feature for Real User Monitoring. Performance improvements are not one-size-fits-all, and what’s critical for one development team may be just a minor edge case for another. Therefore, it’s vital for you to be able to customize your data to your development goals. For example, say you need to investigate why a new feature isn’t performing as expected. You can use the Compare feature to isolate the problem right down to a particular browser and country.
All Real User Monitoring customers have access, so if you haven’t tried it out, now’s your chance.
Provider updates
Google Breakpad support for C++
These files can now also be sent on to Raygun where they will be reported as errors in the Raygun Application under the Crash Reporting section. Raygun will extract the environment and stack trace information from the minidump files and display it for you so you can find the root cause of the problem quickly.
Where to send the Breakpad minidumps.
Javascript hasher version 7 release
In June, we released version 7 of our JavaScript hasher. Updating means the very best grouping logic Raygun has to offer – including the many edge cases we have added from billions of data points collected since the last version release.
If you still have version 6 or below, make sure to read this blog post that will tell you how to update.
New Crash Reporting integrations
Integrations make the world go round—from our perspective, anyway. Just like any other engineering team, Raygun relies on integrations to ensure better development processes. In 2017, we added the following integrations.
GitHub Enterprise
Raygun and GitHub Enterprise work together so you will be able to synchronize issues in GitHub with an error in Raygun Crash Reporting, making it much easier to stay on top of any errors in your application.
Here’s how to link errors with issues in GitHub Enterprise.
Slack two-way sync and associated username
We understand it can be frustrating to move between windows and tasks. With the Slack two-way sync feature, you can choose to action an error from within Slack by choosing to ‘Resolve,’ ‘Ignore’ or ‘Assign’ an error.
How to action errors within Slack.
Visual Studio Team Services
We’re always excited when customers get in touch to share their community projects, pull requests from our open source providers, or even just to tell us how they are using Raygun in their applications. In 2017, we announced a new extension for Raygun and Visual Studio Team Services, straight off the back of the work done by Ivan Lazarov.
Thanks to Ivan, this extension is available in the Visual Studio Team Services marketplace.
What’s happening in 2018?
With 2017 all wrapped up, you may be wondering what we are up to in 2018. We are currently building the biggest update in Raygun’s history — if you’d like to know more, be the first to know and sign up for updates.
Related articles
Are you making the most of all Raygun’s features?
How Raygun saved customers 75 hours of loading time with RUM