Announcing the Compare feature for Real User Monitoring: Compare performance data at a glance to isolate problems faster
Posted Aug 16, 2017 | 6 min. (1089 words)As of today, all Raygun Real User Monitoring customers can access our new Compare feature.
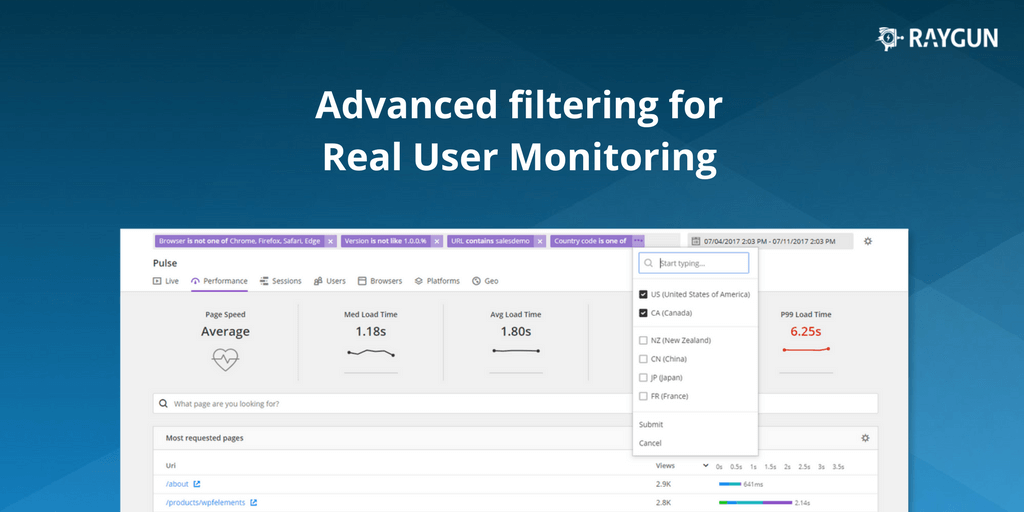
Now, you can view your performance data side-by-side. Compare locations, browsers, platforms or tags against each other for a quick understanding of where performance issues lie.
Spot performance issues caused by projects like a new website launch, or when you need to make a strategic decision to drop support for a feature.
Ready to check it out in the app?
What you asked for
Our goal for Real User Monitoring is always to offer actionable data. In product meetings, we always ask how we can make the data Raygun presents more useful for development teams.
Raygun digests billions of data points for your applications every day, and we always strive to present this data in the best way possible so it’s easy to understand for developers and managers alike.
We wanted to provide answers to questions many development teams face every day, like “Should we remove support for IE9?” And “Which browser is most popular, and which is letting us down performance wise? Where can we do better?”
The Compare feature helps you answer all these questions and more. (Check out the documentation for details on where to find Compare.)
What can I compare exactly?
Performance improvements are not one-size-fits all, and what’s critical for one development team may be just a minor edge case for another.
Therefore, it’s critical for you to be able to customize your data to your development goals.
For example, say you need to investigate why a new feature isn’t performing as expected. You can use the Compare feature to isolate the problem right down to a particular browser and country.
To give a complete story, the dimensions that you can compare are the following:
- Browser
- Country Code
- Device
- Operating system
- Tags (for more details on tags see this blog post)
- Url
- Version
How does comparing dimensions help me to fix the problem?
Once you’ve isolated the location of the problem to a set of dimensions, you’ll be able to see how exactly your application is affected.
The Compare feature shows a wealth of information on your user’s behavior, and we decided to show five main areas of information most critical to application performance.
Compare module
The Compare module is the high-level view of your chosen comparison criteria. See which dimensions you have pitted against each other and the median load time for each. The first module on the Compare page will give a quick at a glance indication of the most performant candidate:

Performance module
We know how critical fast loading pages are for a great user experience. Raygun Real User Monitoring collects and compares four major metrics of page load speed to give an accurate average score:
- Median Load Time: Shows the 50th percentile load time across the date range
- Average Load Time: Displays the site’s average page load time. Raygun collects load times at regular intervals across the date range. The load times are then added up and divided by the number of load times collected.
- P90 Load Time: Shows that 90% of your users experience this load time or less, within the date range
- P99 Load Time: Shows that 99% of your users experience this load time or less, within the date range
The Distribution graph then plots these load times into a time graph so you can correlate data spikes with development activity, while our famous smiley system will give you a quick snapshot of whether your users are happy (or not):

Most requested pages module
Real User Monitoring is all about how your user is affected by performance issues. We suggest you prioritize problems on your most requested pages, which is why Raygun surfaces your most viewed pages alongside average load times. Critical performance issues on your most viewed pages are most important to fix quickly for the best user experience.
Raygun calculates the most requested pages in aggregate. Raygun also shows you how evenly the load time is distributed over the seven components of page load speed so you can further isolate the problem in your pipeline:
- DNS: Time it takes for the nameserver lookup to resolve
- Latency: Time it takes for the host server to receive and process a request for an asset
- SSL: Time to complete an SSL handshake
- Server: Time it takes for the server to compute your code
- Transfer: Time the page has to wait for assets to load from the server
- Render: Time it takes the browser to apply stylesheet rules and compute JavaScript
- Children: Time for asynchronous assets to process – this refers to all requests loaded by the page up until onLoad (includes scripts, stylesheets, images and XHR requests)

User module
The User module is where Raygun collects and compares the data on your user’s behavior:

For all your application’s requests, the smileys indicate your user’s average level of satisfaction. Satisfaction is determined based on the average load time of all your users for the specified time range.
Similar to the user satisfaction smileys, the user satisfaction chart further breaks down the average load time of your users. On the chart, we can see how many users are experiencing “poor,” “average” or “excellent” load times on a given day.
Geo module
Are your VIP users in China, therefore need to be reassured they have a great user experience inside your application?
Many of our customers need to get this data at a glance, which is why we included the Geo module. Compare the countries with the slowest load times next to the countries with the fastest load times.

Moving forward, we’re listening to your feedback on your application performance needs – so keep the suggestions coming! We’ll be adding more dimensions for comparisons over the next few weeks.
Are you a Raygun Platform customer?
If you are a Raygun Platform customer with Crash Reporting enabled, you can also correlate crash data to a particular poor user experience.
Ready to try out the Raygun Platform?
Let us know what you think!
All existing Real User Monitoring customers will have access to the Compare feature. Stay tuned for how to take a deep dive on improving your user satisfaction scores.
In the meantime, we’d love to hear your feedback. We read every one. Simply reach out to a team member here.
Further reading
How to work out the optimal image size for your website to maintain fast loading pages
Which other features of Raygun are you missing out on? See a list of our most popular features