The Legacy Dashboard is levelling up
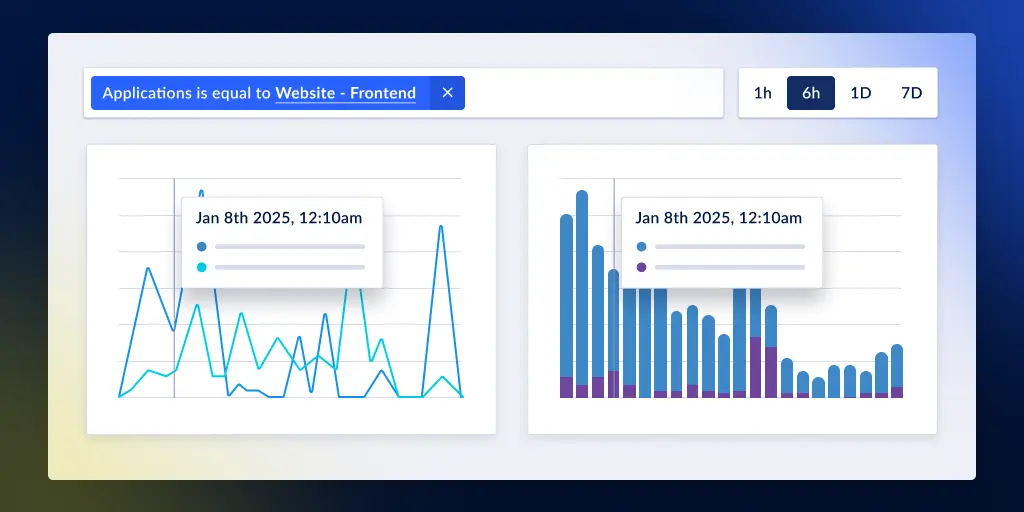
Posted Jun 19, 2018 | 4 min. (668 words)Last April, we launched a new feature called Custom Dashboards allowing teams to sort and view data from Raygun Crash Reporting, Real User Monitoring, and Application Performance Management. It was built as an upgrade to our Legacy Dashboard, offering better visualization, customization, and navigation.
For our customers, it’s been successful—many have made the switch from the Legacy Dashboard to Custom Dashboards. However, some teams need to use both due to some functions being available in the Legacy Dashboard only.
That’s why we recently upgraded the Custom Dashboards to include all your favorite functionality from the Legacy Dashboard. Now, there’s no need to switch back and forth between the two. To help make the transition easier, we’ll be removing the Legacy Dashboard for customers who signed up before the introduction of Custom Dashboards.
The two new features we’ve added to the Custom Dashboards are:
- An Error status filter added to all error tiles
- The ability to change the status of multiple errors across multiple apps
Here’s how they work.
1. Add an error status filter to all error tiles
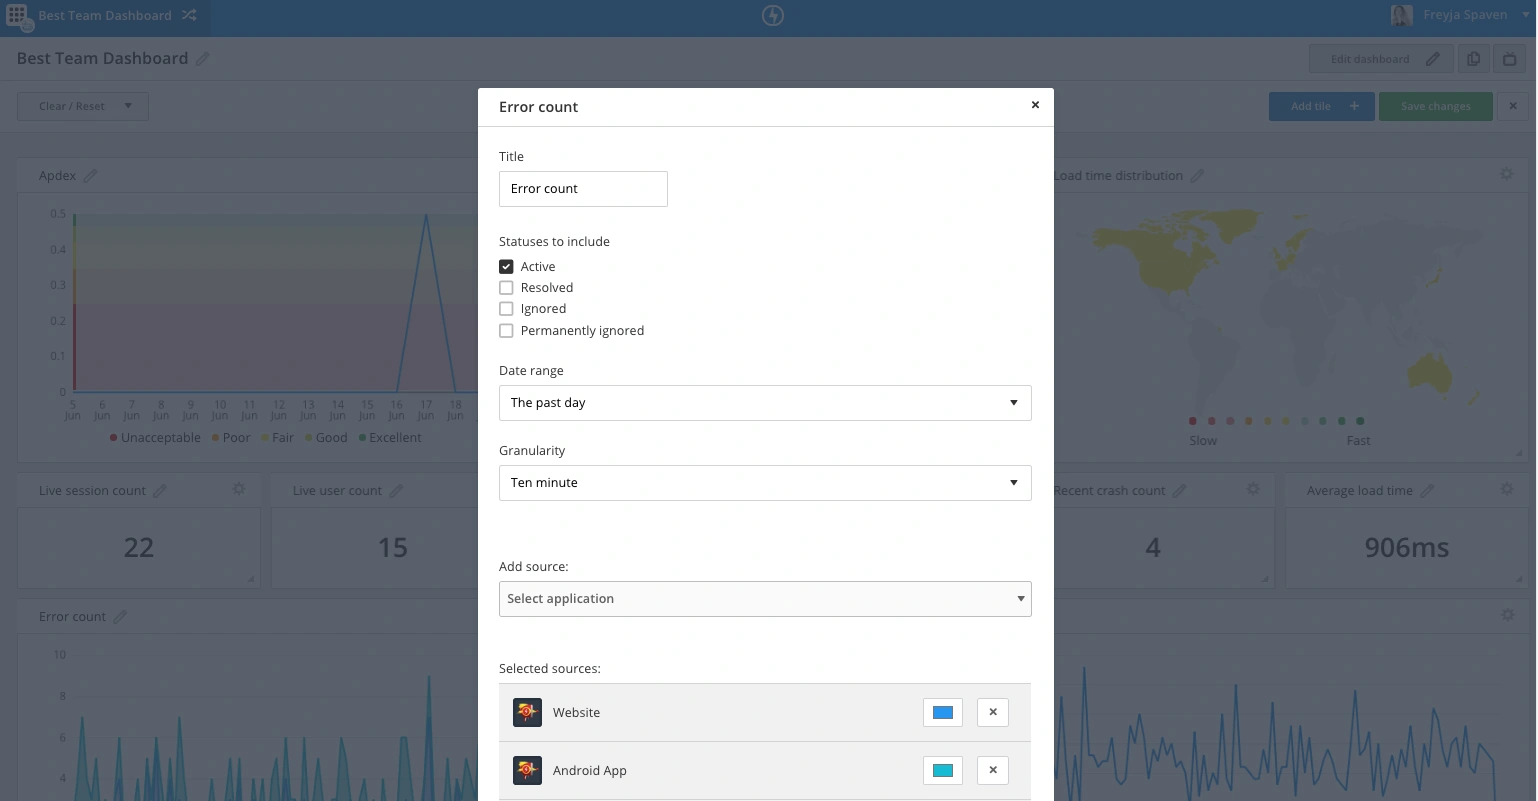
Within the error group tiles, you can now choose to show error groups with certain statuses. Sorting errors by status is particularly useful if you’d only like to see your active errors within a certain application.
Crash Reporting tiles can be filtered by error group status. Error group statuses include Active, Resolved, Ignored, and Permanently ignored.
The error-based tiles which can be filtered by status are:
- Error count
- Error groups
- Errors per app
- Error instances
- Error groups count
2. The ability to change the status of multiple errors across multiple apps
We’ve also added the ability for you to bulk edit the status of multiple error groups across multiple applications.
Within the ‘Errors per app’ tile, you can select multiple error groups across multiple apps and bulk change their error statuses. Error group statuses include Active, Resolved, Ignored, and Permanently ignored.
- On your dashboard, head to the ‘Errors per app’ tile. (If you haven’t already, you can add this tile by editing your dashboard)
- Select the app you’d like to see the errors for by clicking the blue arrow
- Click the ‘Message’ checkbox to select all errors
- Use the ‘Change status’ dropdown to select either Active, Resolved, Ignored, or Permanently ignored
To get started with Custom Dashboards
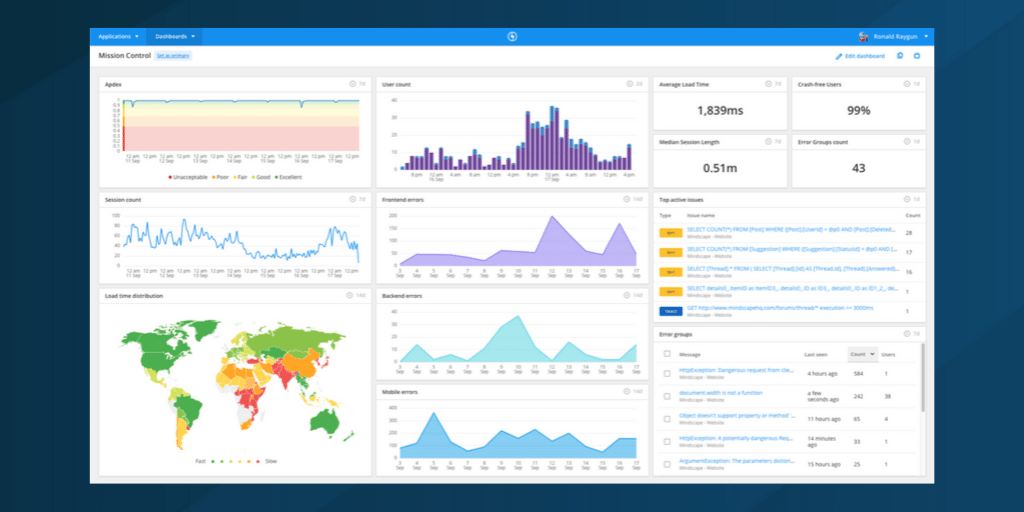
If you haven’t created Custom Dashboards for your app yet, it’s easy to get started, and will provide a consolidated place for all your Crash Reporting data. (If you need some inspiration on what to include in your first dashboard, we’ve created some example boards you might like to replicate.)
- Head to your application name in the top-left corner of the screen
- Select the ‘Dashboards’ option
- Either create a new Dashboard, or select one you’ve already built
Other enhancements we’ve made recently
We’ve made several enhancements to the Dashboards over the last few months. Here’s a summary.
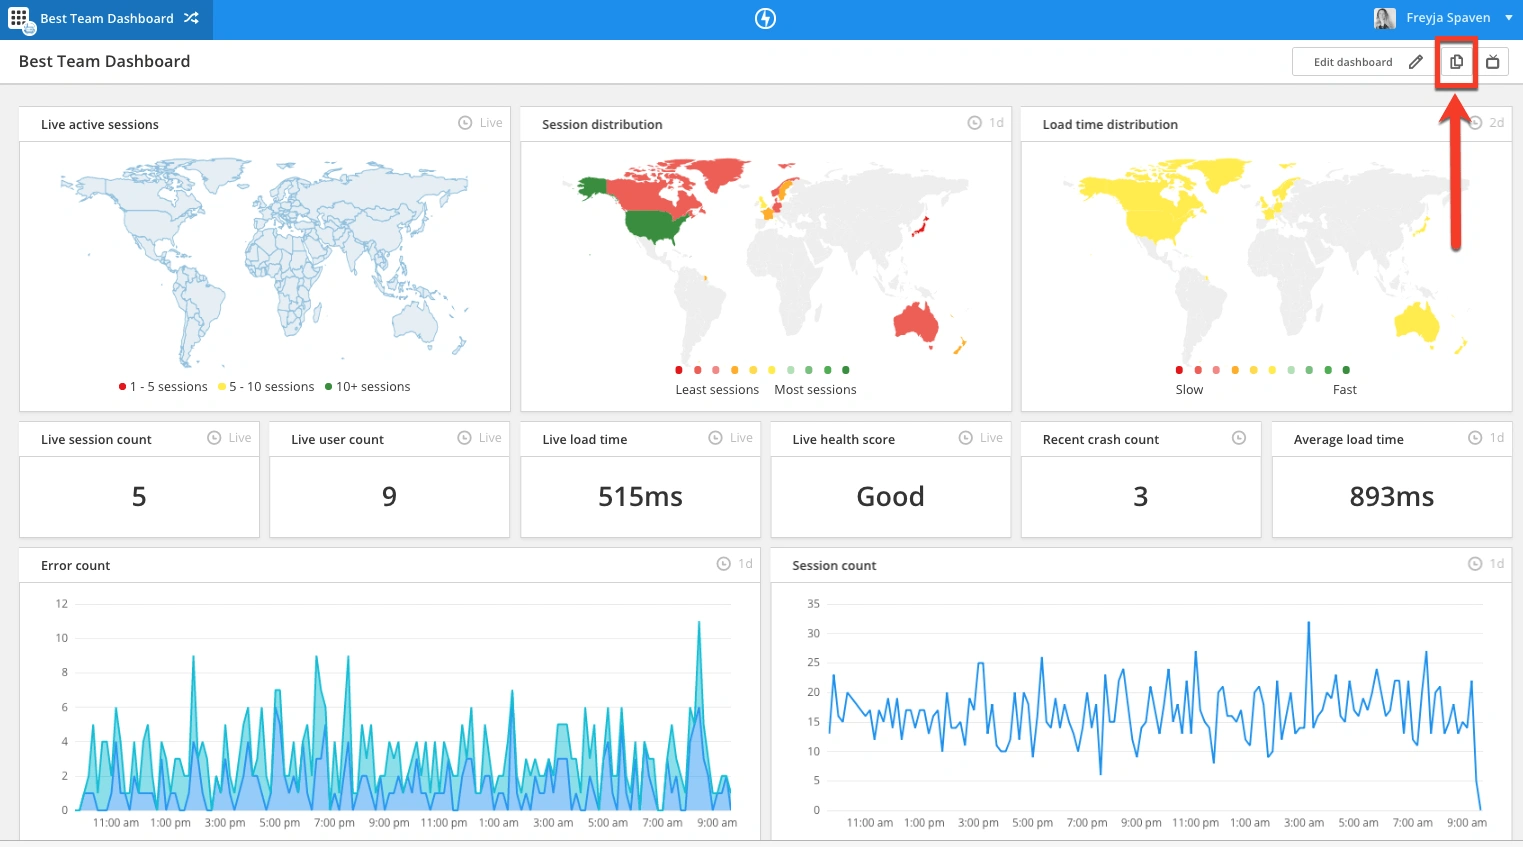
1. The ability to clone your existing dashboards
As a developer, you may want to clone a dashboard so you can use it as a starting point to build other dashboards. Or, you could take a colleague’s dashboard and tweak it slightly.
You can find the Clone dashboard feature in the top-right corner of your dashboard.
2. Better granularity in charts
In April, we released upgrades to the chart tiles so you can get better granularity of your data. For example, you can now drill down into data to the second on the Error count chart, Session count chart and User count chart tiles. This blog post has more details.
3. Auto-rearrange upgrades
In ‘Edit’ mode, the tile auto-rearrange has been toned down, so tiles no longer shift position automatically when dimensions are changed.
Regardless of how many errors you receive, Custom Dashboards help you understand and action your data faster, so outages and performance problems don’t affect end users.
Is there another function you would like to see in the Custom Dashboard? Head to our feature request forum and make a suggestion to our team.