Introducing time boards for Raygun Dashboards
Posted Jan 9, 2025 | 3 min. (539 words)We’re excited to announce our latest feature, time boards, which will transform how you analyze your software issues and bottlenecks. This powerful enhancement to Raygun Dashboards offers an alternate way to visualize your dashboard data by synchronizing time across all dashboard tiles.
What’s in this article
- The power of synchronized time analysis
- How it works
- Real-world applications
- Get started today
- In summary
The power of synchronized time analysis
When investigating software issues, timing is everything. Events like a spike in errors, a sudden drop in performance, or an unexpected increase in user session crashes rarely happen in isolation. Understanding the relationship between different metrics at the same point in time can be the key to rapid root cause analysis. With time boards, you can:
- Instantly see if a deployment caused both frontend and backend performance issues
- Correlate error spikes across different services or applications
- Identify whether increased user load affected your application’s stability
- Track how performance bottlenecks impact user behavior and business metrics
Gone are the days of manually aligning timestamps across multiple graphs while investigating an incident. Time boards ensure that all your metrics are perfectly synchronized, giving you a comprehensive view of your application’s health at any moment.
How it works
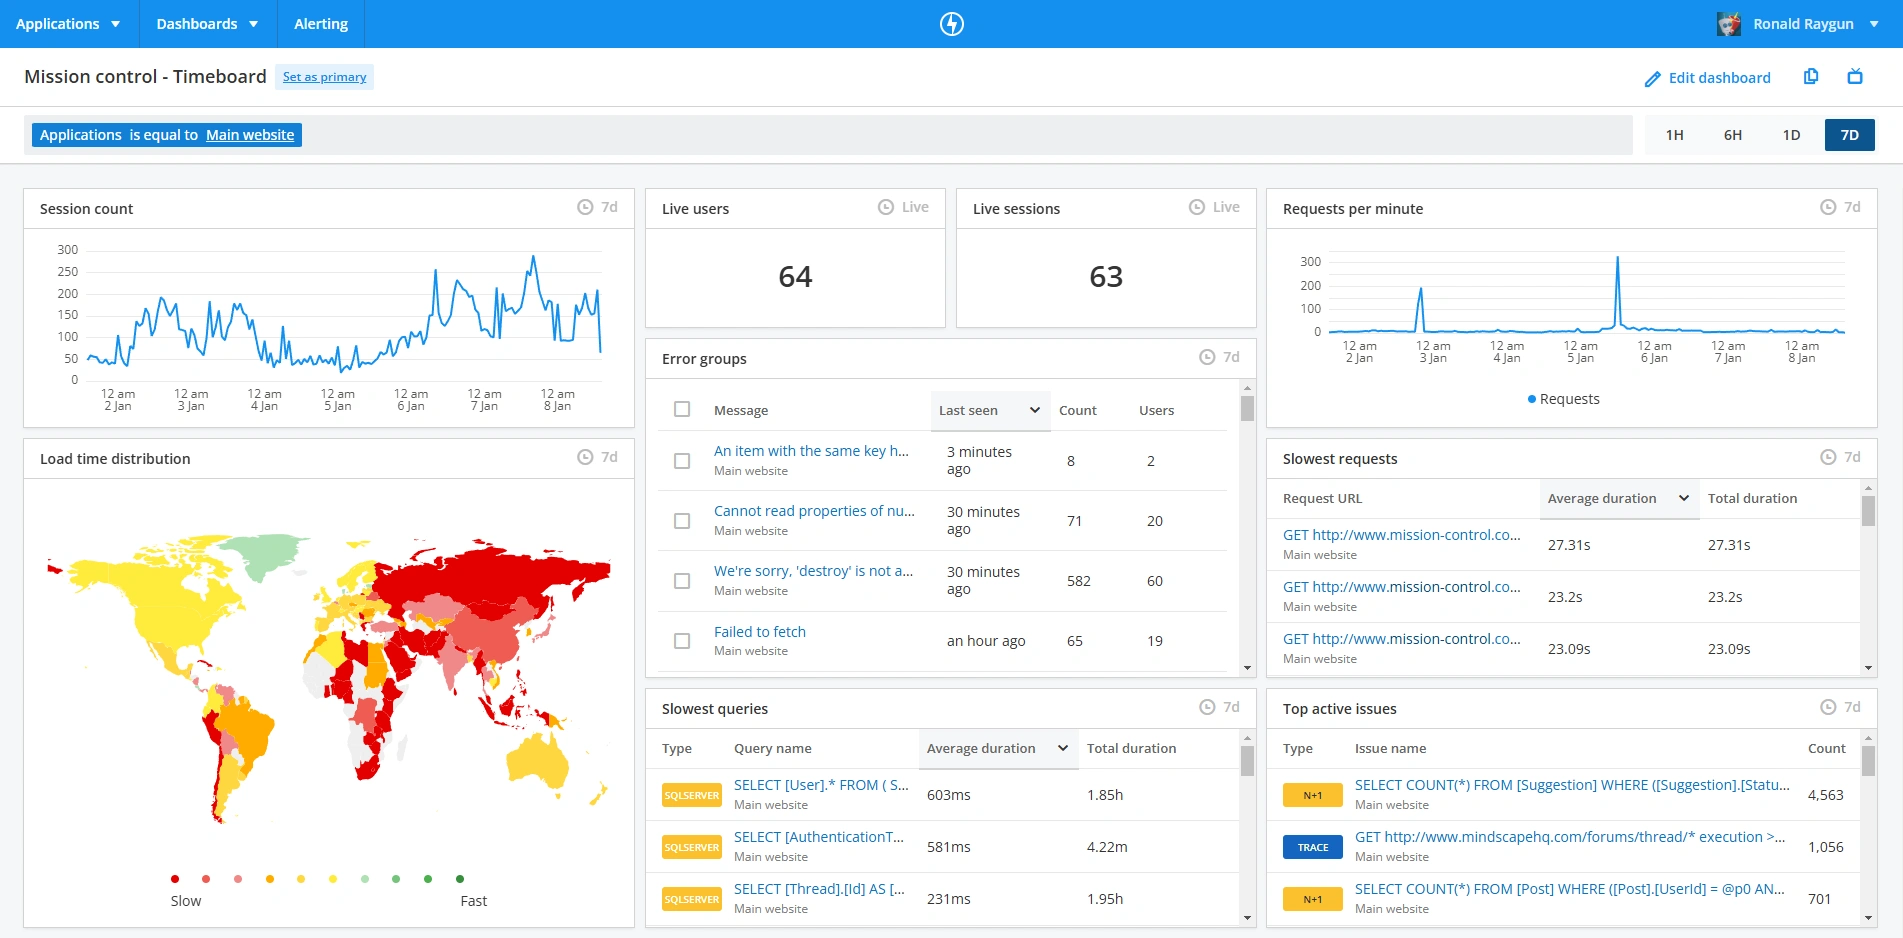
Using time boards is straightforward. When creating a new dashboard, select the ‘Time board’ option. All tiles you add will automatically sync their time ranges. A master time control at the top of your dashboard lets you simultaneously adjust the period for all visualizations.
What makes time boards even more powerful is its flexible application filtering. Once you set up a dashboard, you can instantly switch between viewing metrics for single or multiple applications. This means you can create versatile dashboards that adapt to different monitoring scenarios—whether you’re troubleshooting a specific service or analyzing interactions across your entire application ecosystem.
Real-world applications
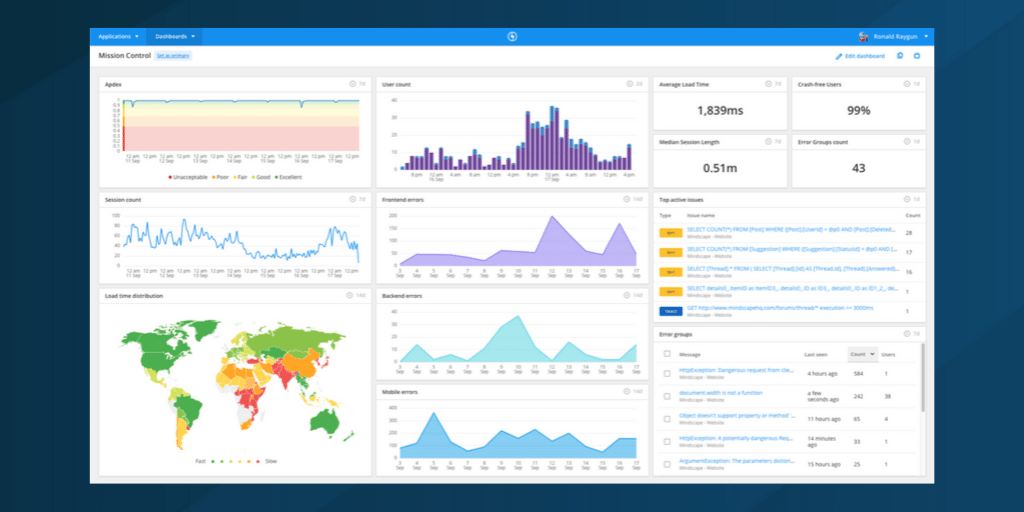
Imagine analyzing your application’s performance during a major deployment. With time boards, you can instantly see how the release affected various metrics:
- Live user sessions and their geographical distribution
- Error counts and emerging error groups
- User satisfaction scores and health metrics
- Server performance, including the slowest methods and queries
- External API call performance and bottlenecks
- Load time distributions across different regions
All are perfectly aligned in time, giving you immediate insights into cause-and-effect relationships. This synchronization means you can instantly correlate a spike in error rates with changes in user satisfaction, or identify how performance bottlenecks impact user behavior across different regions.
Get started today
The time board feature is available now to all users who are part of a team plan. To begin exploring this powerful new feature, you can create your first time board by:
- Logining into Raygun
- Click ‘Dashboards’ > ‘Create dashboard’
- Select ‘Time board’ as your dashboard type
We can’t wait to see how you’ll use time boards to uncover new insights in your data.
In summary
Time boards transform how you analyze and troubleshoot your software performance by eliminating the manual work of aligning timestamps across different metrics. Whether investigating incidents, monitoring deployments, or optimizing performance, having all your metrics perfectly synchronized in time gives you deeper, faster insights into your application’s behavior.
Have questions about time boards? Check out our documentation or reach out to our support team.