Announcing increased granularity in Custom Dashboards
Posted Apr 23, 2018 | 2 min. (372 words)In April 2017, we launched our Custom Dashboards feature—a way to organize and visualize your Crash Reporting, Real User Monitoring (RUM) and Application Performance Management (APM) data surfaced by Raygun, depending on your plan.
Our customers use the Custom Dashboards feature to get a high-level view of the overall health of their application. The dashboard contains tiles of data that can be changed depending on what you need your team to track. One of the most important features of tiles is to drill down to the day and even the hour that you need to gather data for.
But sometimes, you want to drill into time ranges below an hour so you can get more granularity into your data. With our latest update to our Custom Dashboard tiles, you can now drill down into data to the second! We’ve added the new functionality to the Error count chart, Session count chart and User count chart tiles.
How to get finer granularity into Custom Dashboard tiles
With more options to drill down into specific time ranges, developers can now isolate crash and performance data to an even smaller time window in a date range, making resolution easier. Here’s how:
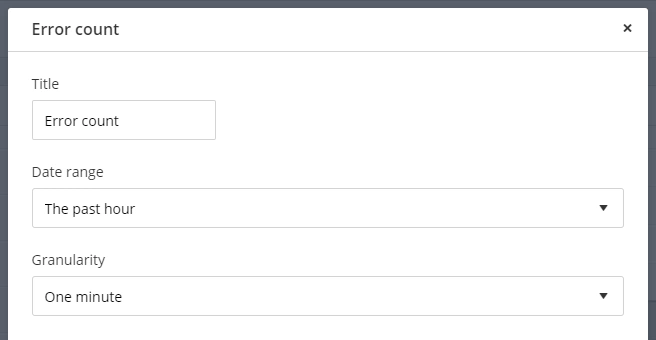
- There are new options available when choosing a time range for 10 minute and 1 minute details, where previously there was 1 hour.
The Crash Reporting dashboard gets more granular, too
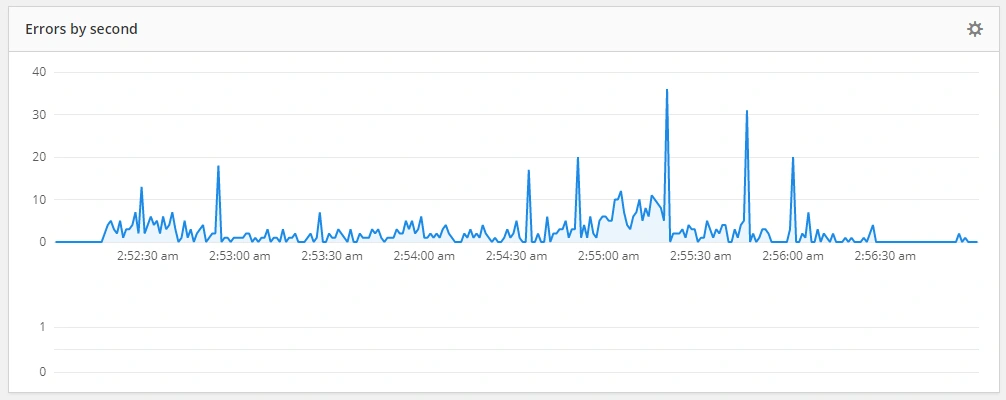
The Crash Reporting dashboard chart tile now allows you to drill down to per second data, where previously it was per hour.
When developers drill into a date range below 24 hours, the chart will switch to show 10 minute intervals. Below 3 hours it will switch to per minute intervals. Below 5 minutes it will switch to 1 second intervals.
The easiest way to view this is to drag-select the chart to zoom in on a date range and keep zooming in.
Custom Dashboards are available on all plans (apart from our side-project plan) For more on Custom Dashboards, head to our documentation.
We’re always looking to improve our Dashboards feature, and if you have some ideas, we’d love to hear from you. Please share your feedback in the our feature request forum.