The art of shipping and monitoring software with speed and confidence
Posted Apr 1, 2020 | 10 min. (2024 words)Software teams are under increasing pressure to ship code faster than ever before, but without the right workflow and tools in place, this can introduce unnecessary risk and headache. We wanted to share how to configure deployments, identify issues, and track performance gains using tools and process to get the best results and enable you to ship software with speed and confidence.
The tools we will be using in today’s example include Jenkins, Octopus, and Raygun. These are all available on a free trial so you can follow along.
(We partnered with Octopus to deliver a live demo of the whole process - you can watch the recording here).
Application lifecycle management (ALM)
The power of using these tools in conjunction with one another brings confidence to your deployments, giving you the time to focus on the things that matter… delivering great software to your customers.
Before we jump into the technicals, let’s take a quick look at the Application Lifecycle Management (ALM) process and see where Octopus and Raygun fit into this picture.
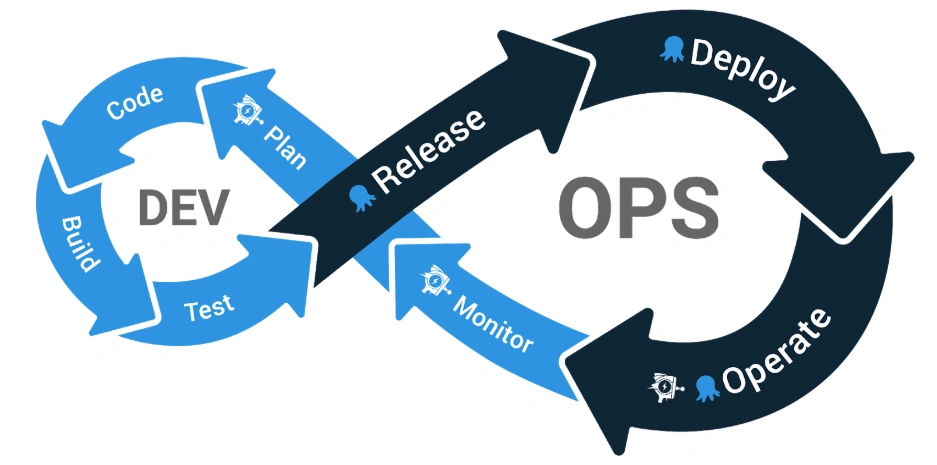
Octopus lives inside the Release, Deploy, and Operate stages of this lifecycle, giving you the ability to reliably release software in a scalable manner. Once your website or application reaches the operation stage Raygun is able to continue this flow right through to the Monitor and Planning stages.
Having the ability to collect metrics specific to each deployment helps us detect issues early, diagnose the cause of the problem and make a plan to resolve these issues by providing software teams with the information required and giving them confidence knowing no stone is left unturned.
Tooling
Here’s a brief overview of some of the tools that we will be using today to ensure we’re all up to speed.
Jenkins
Jenkins is a free, open source automation server that helps automate the non-human part of the software development lifecycle. This includes continuous integration and facilitating technical aspects of continuous delivery.
Jenkins is highly customizable with plugins to support almost any build pipeline. It supports version control tools and can execute a wide range of scripts.
Octopus
Octopus is an automated deployment and release management tool for managing releases, automating complex application deployments, and automating routine and emergency operations tasks.
Octopus offers a large range of build server integrations along with a vast variety of deployment target options. It can perform custom steps making it flexible enough to fit any deployment pipeline.
You can see a Sample Octopus application on samples.octopus.app/.
Raygun
Raygun is a software monitoring suite that gives you visibility into how users are really experiencing your software. It’s designed to provide you with actionable data you need to find and fix software issues and performance problems for your end-users.
Raygun has providers for the most popular programming languages and frameworks, and offers a large range of integrations so you can tailor your monitoring to suit your workflow.
Deploying, monitoring, and identifying a problematic deployment
Now that we’ve covered off the tooling we are going to be using, let jump into the fun stuff!
In this section, I’ll be introducing some issues into my demo website, running a build, deploying this out to our webserver then covering how we can detect and identify the problem quickly.
Imagine this flow as introducing an unintended issue to your codebase and overlooking the problem. Even with the best processes in place, we can still introduce new errors into production. Perhaps you don’t have sufficient tests or maybe a method or utility was poorly named, whatever the case I’m sure you’ve come across something similar before.
Healthy site
First things first, let’s take a look at our healthy demo website. On this site, we have a customer signup form. We are able to successfully create a new user and we don’t exhibit any issues inside our developer console.
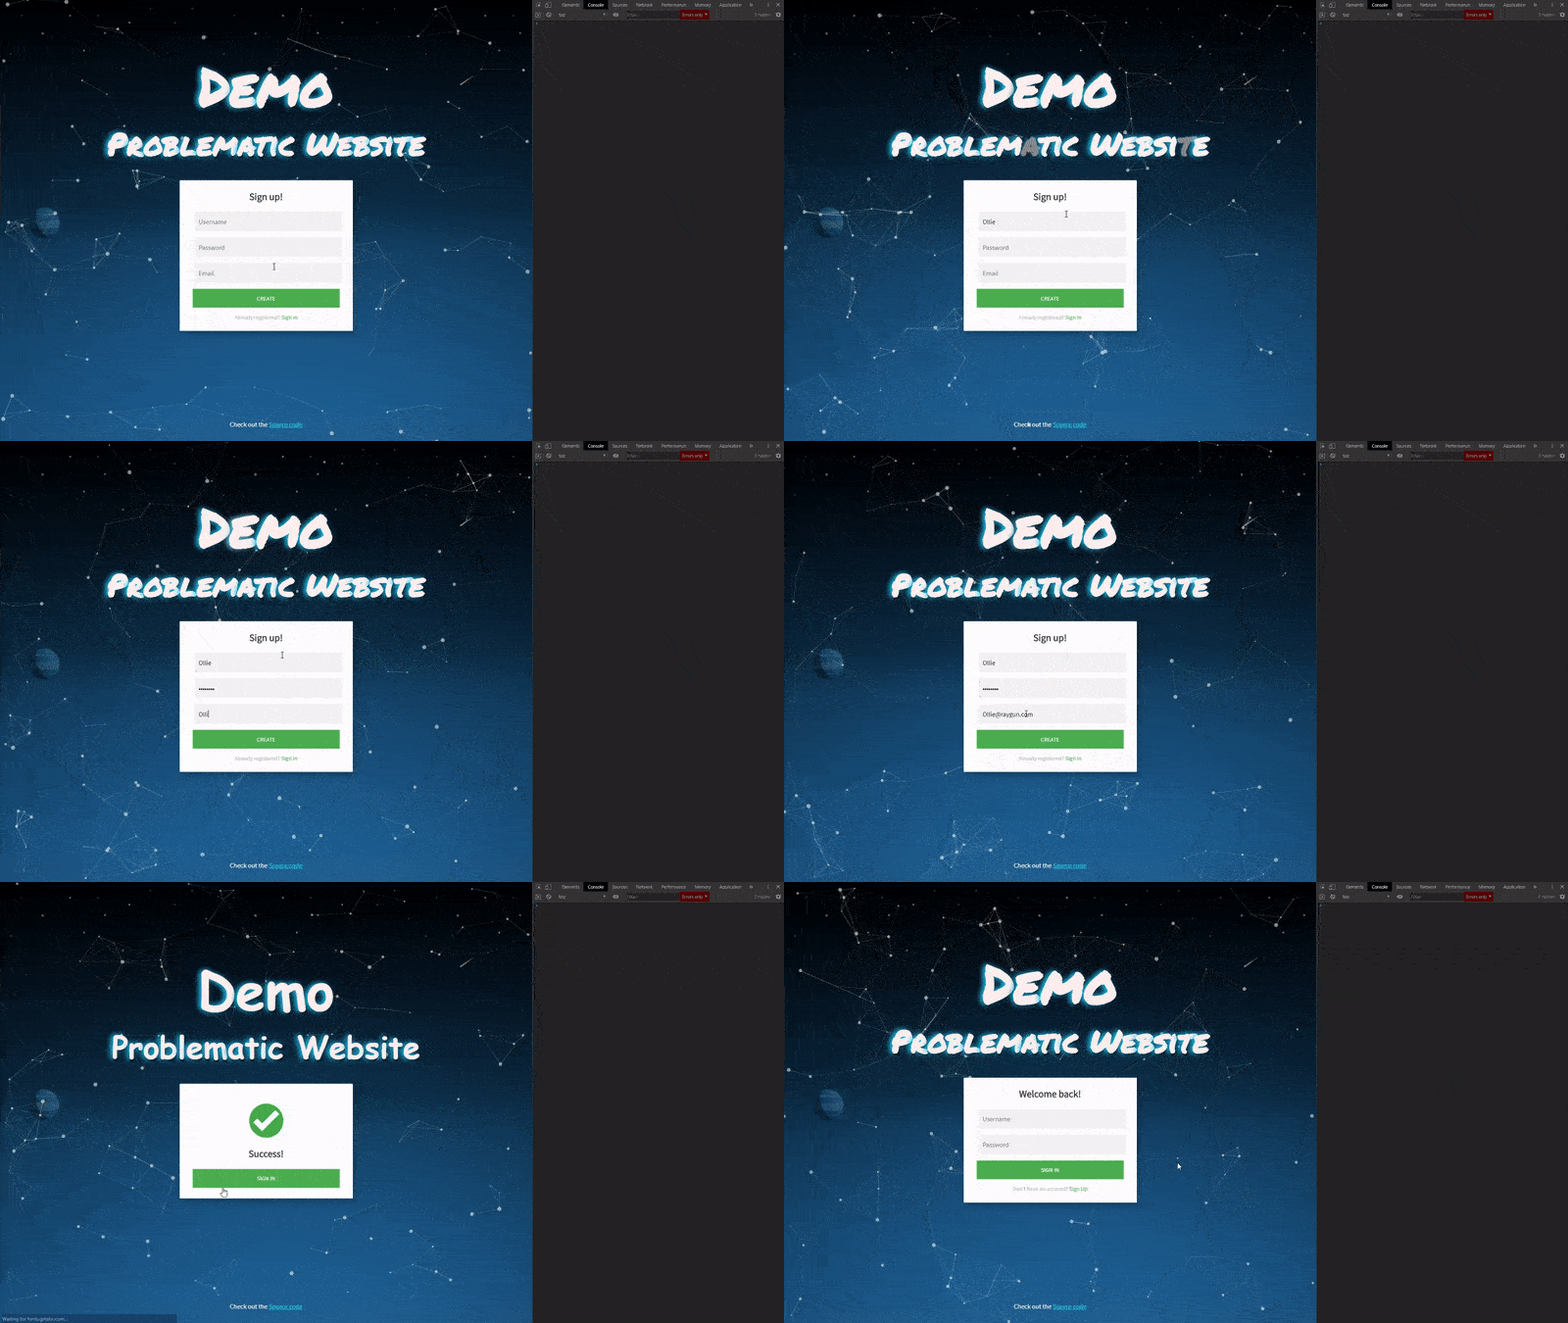
This will serve as the base of our website state, now let’s go ahead and introduce some problems.
Adding bugs
On this site, I’ve added an errors.js script and set enableErrors = true; - this will serve as our chaos monkey, causing errors to be thrown when the user fills out the signup form. This is to emulate us accidentally introducing bugs into production.
Using git I’ve committed these changes and pushed up to our git repository, this will be picked up by our CI/CD pipeline in the next phase.
Jenkins
After our changes have been pushed up, Jenkins will automatically trigger a build for us. This is done using Jenkins “Poll SCM” feature and linking this to our Github repository. This will perform a check every 60 seconds, looking for any changes and if these are found it will kick off our initial job “01_Raygun_CI”.
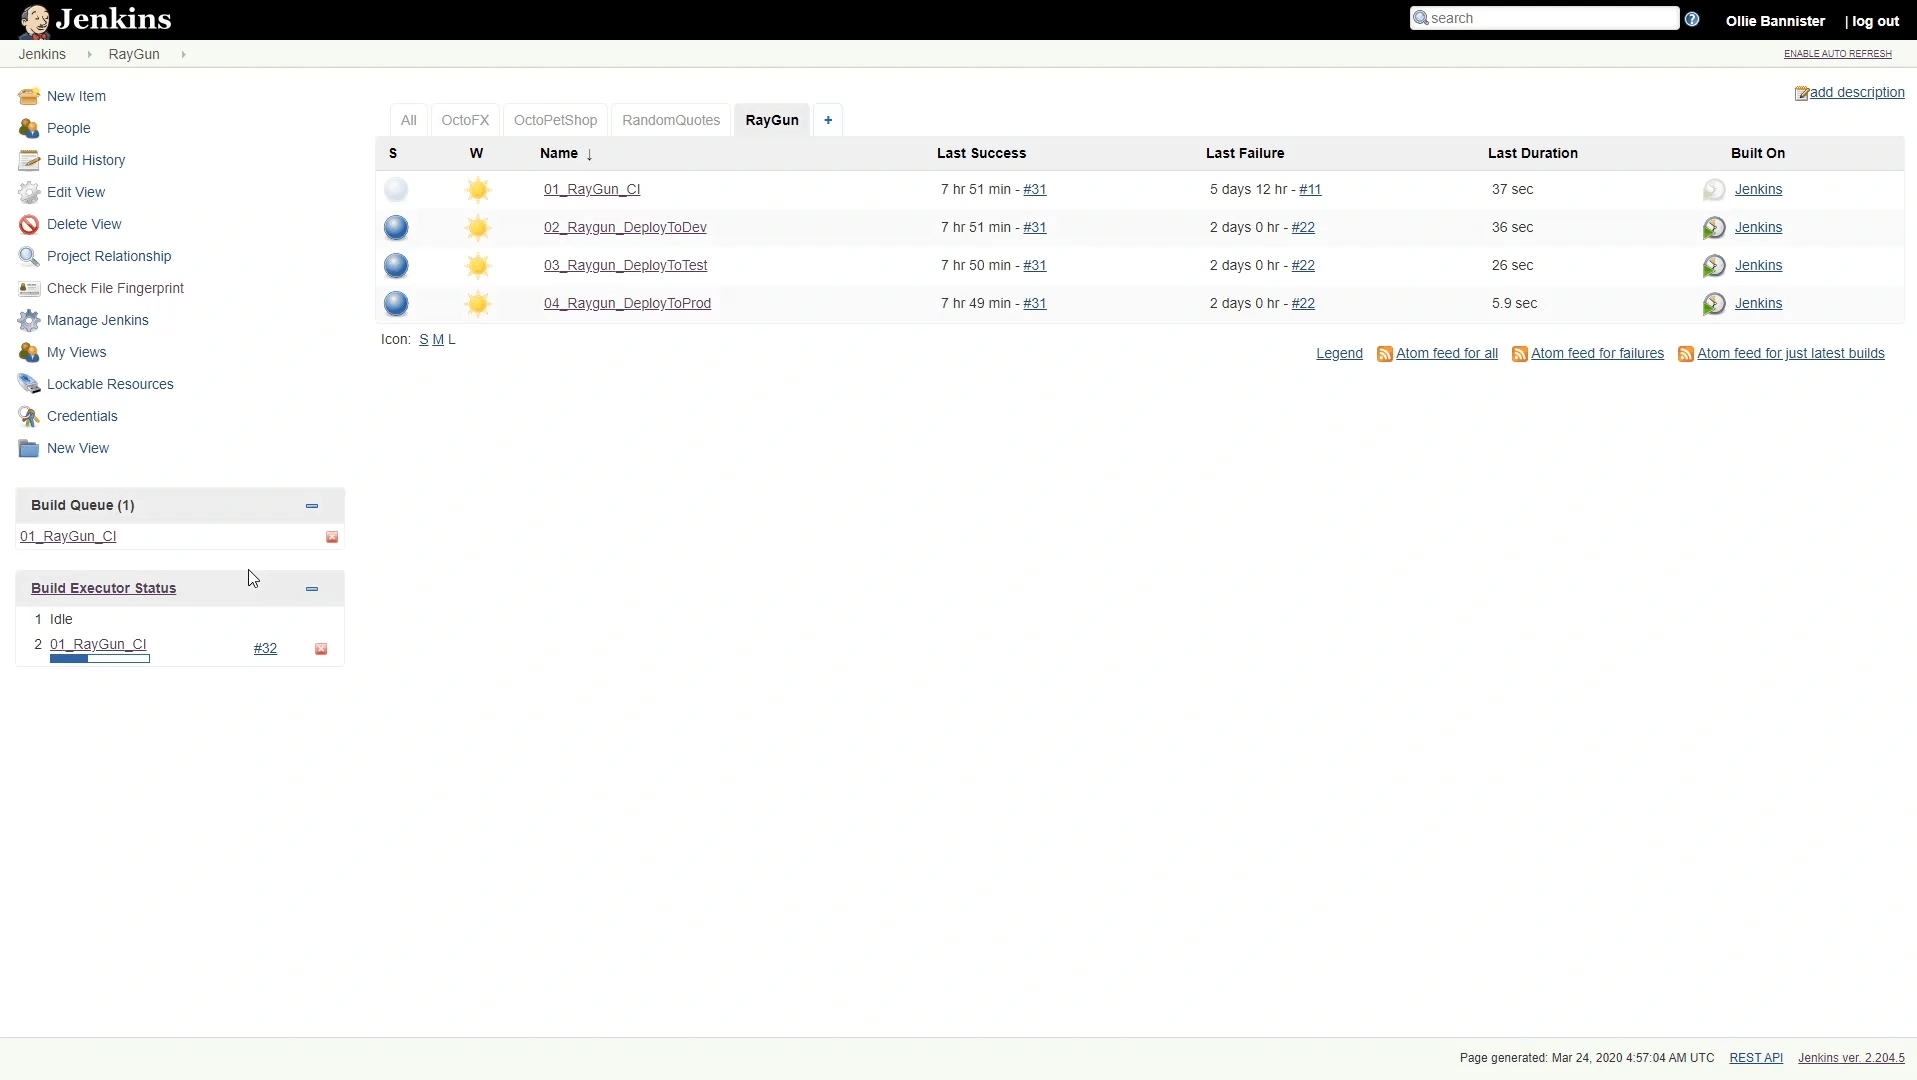
The purpose of this job is to take our master branch, install any dependencies, run our task runner (Grunt) then generate a NuGet package for us to deploy using the generated distribution files.
Once the “01_Raygun_CI” job has been completed this will then trigger downstream projects that have been set up to deploy the built package out to a dev environment “02_Raygun_DeployToDev”, test environment “03_Raygun_DeployToTest” and then onto our production environment “04_Raygun_DeployToProd”.
Octopus
When Jenkins triggers our 03_Raygun_DeployToTest and 04_Raygun_DeployToProd jobs this will cause two deployments to be registered inside octopus under the specific build number. These kick-off a post-build action that will then deploy this package out to our Azure server.
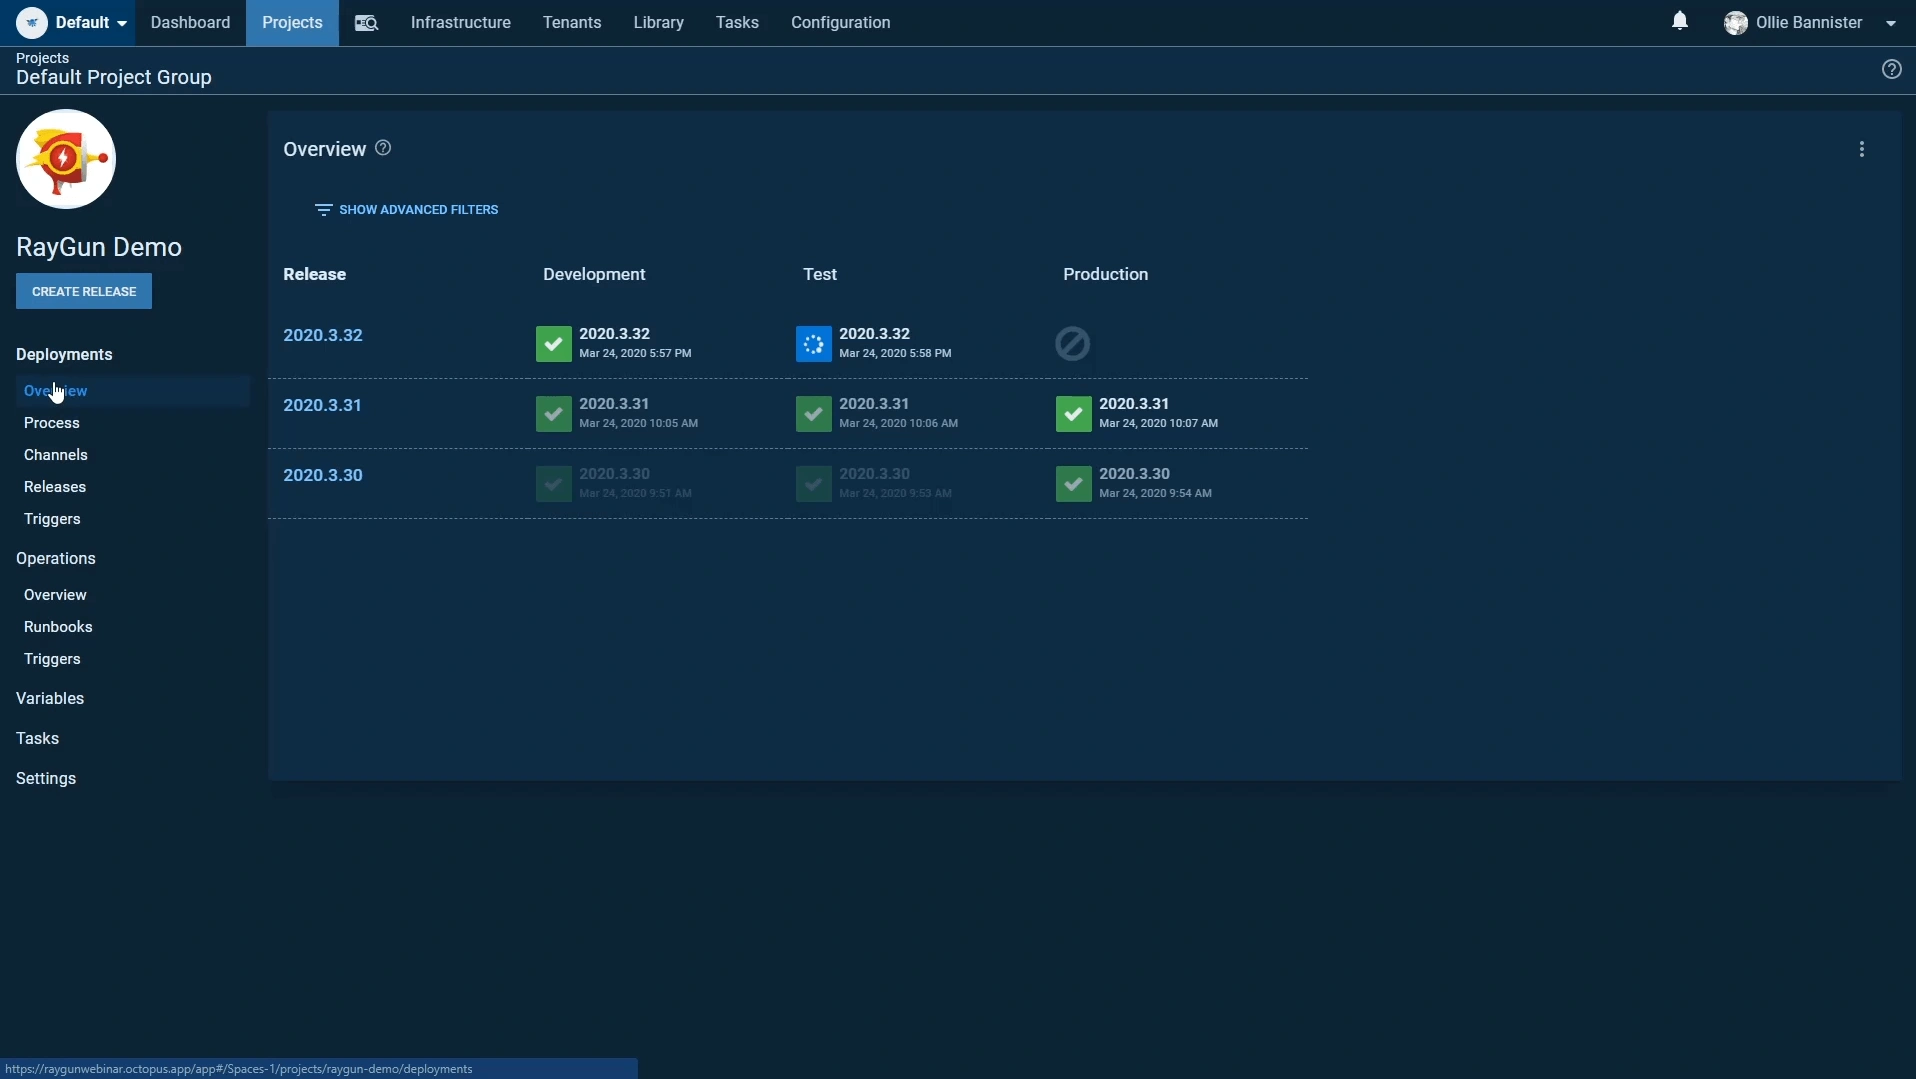
For each deployment we have a 3 step process:
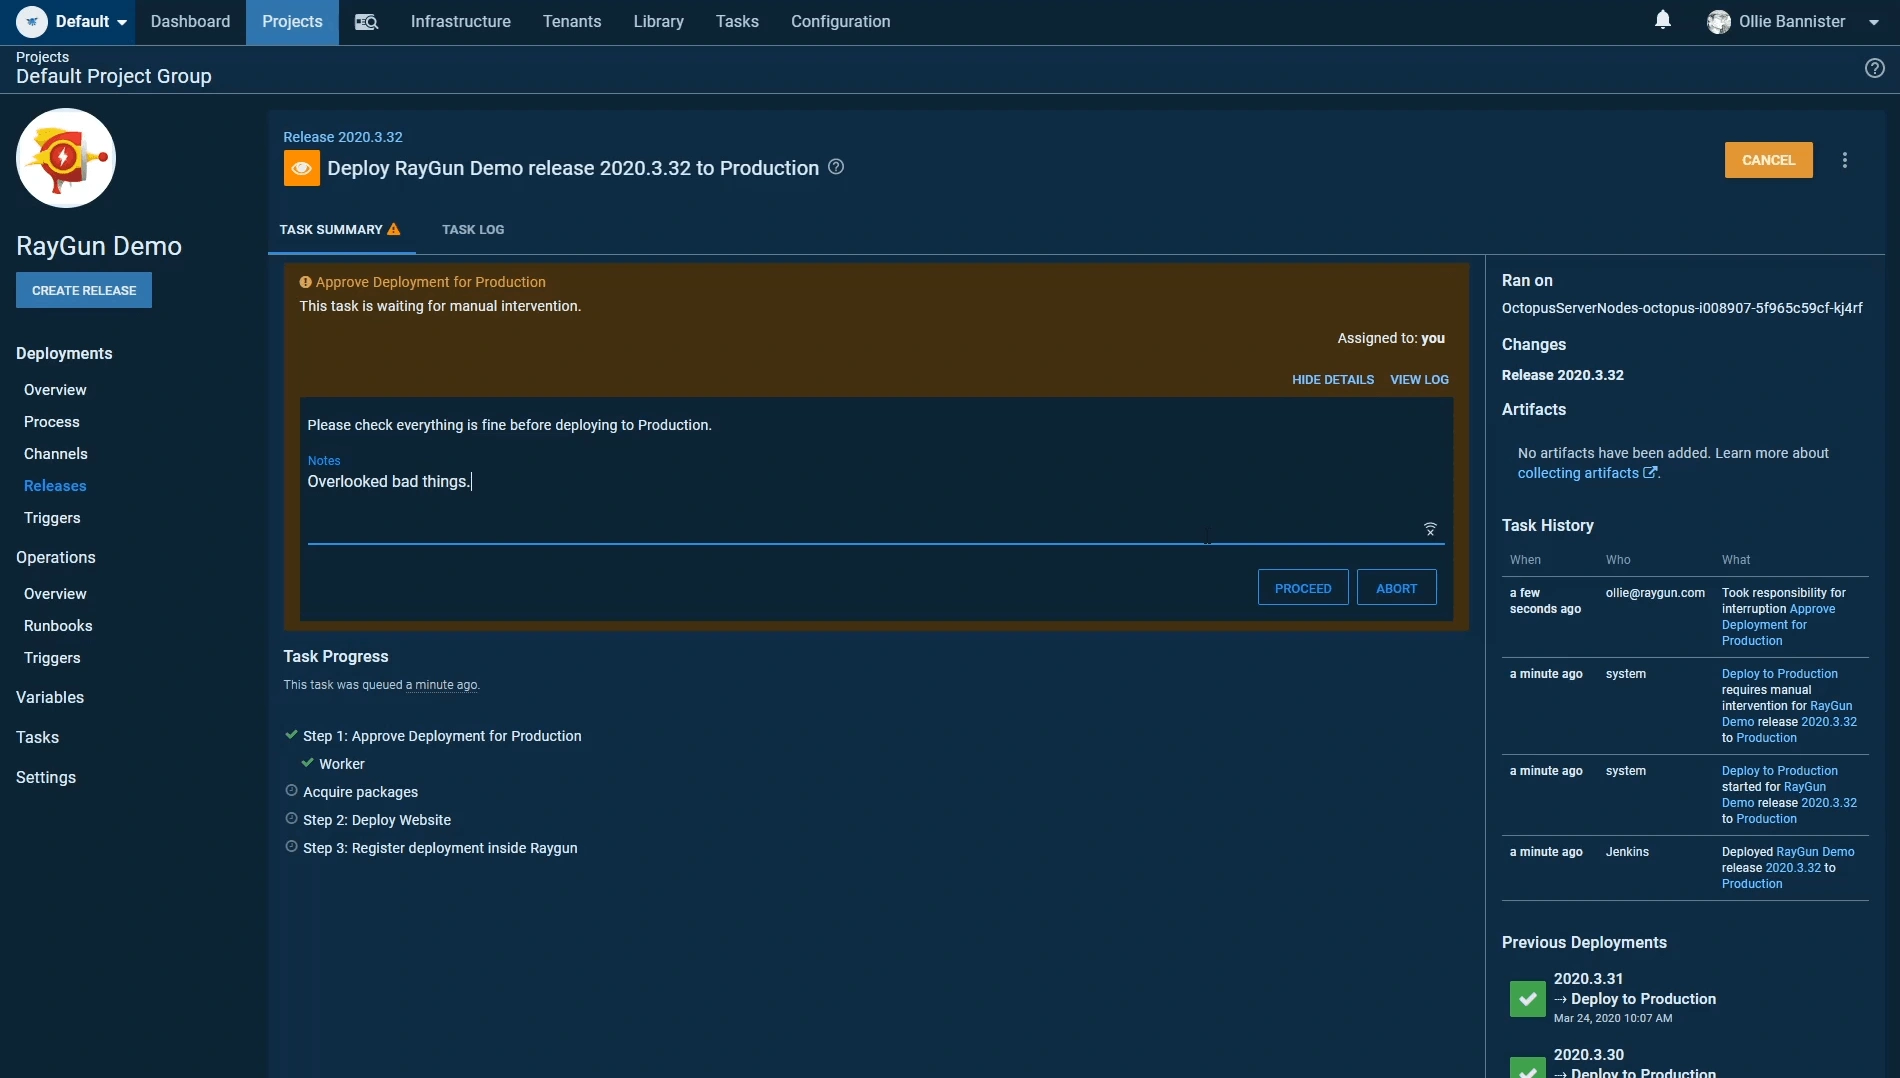
Step 1: Manual intervention
The manual intervention step allows us to implement an additional check before the deployment goes live. This is perfect in situations where we want to approve any changes before Octopus continues with the deployment.

In our demo flow today, we have configured this step to only run when we’re deploying out to our production environment. I have approved the deployment to emulate what might happen when a problem is overlooked.
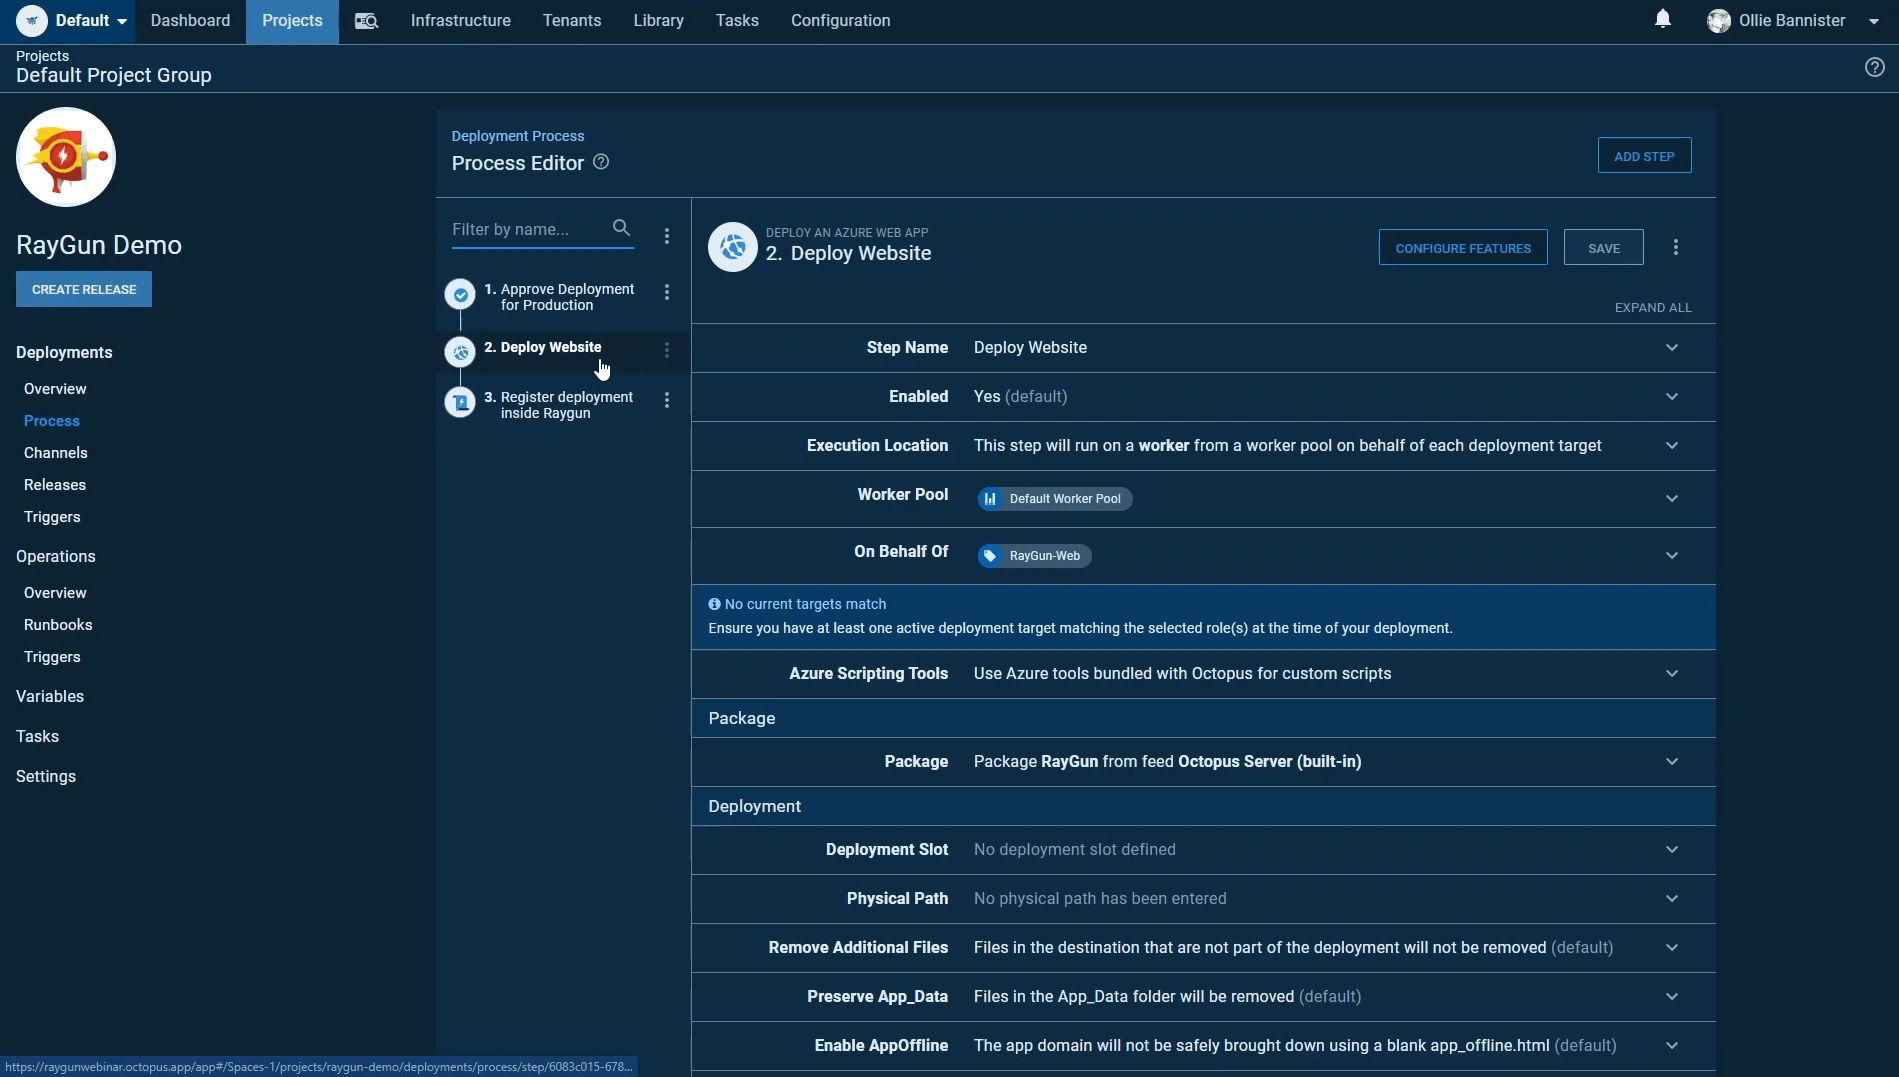
Step 2: Deploy website
Our deployment step is what will upload our files to our webserver. Depending on the type of deployment (test or production) this will change the deployment target respectively. This makes maintenance easy as we only have to define a single process for across multiple deployment options.
Step 3: Register deployment
Finally, once our site has been approved and deployed we want to notify Raygun that a deployment has gone out and provide any associated metadata to do with the deployment.
To achieve this we just need to execute a simple PowerShell script that will fill our payload with some Octopus variables; like build number, user information and any deployment comments then post this off to our deployments endpoint, effectively timestamping our deployment.
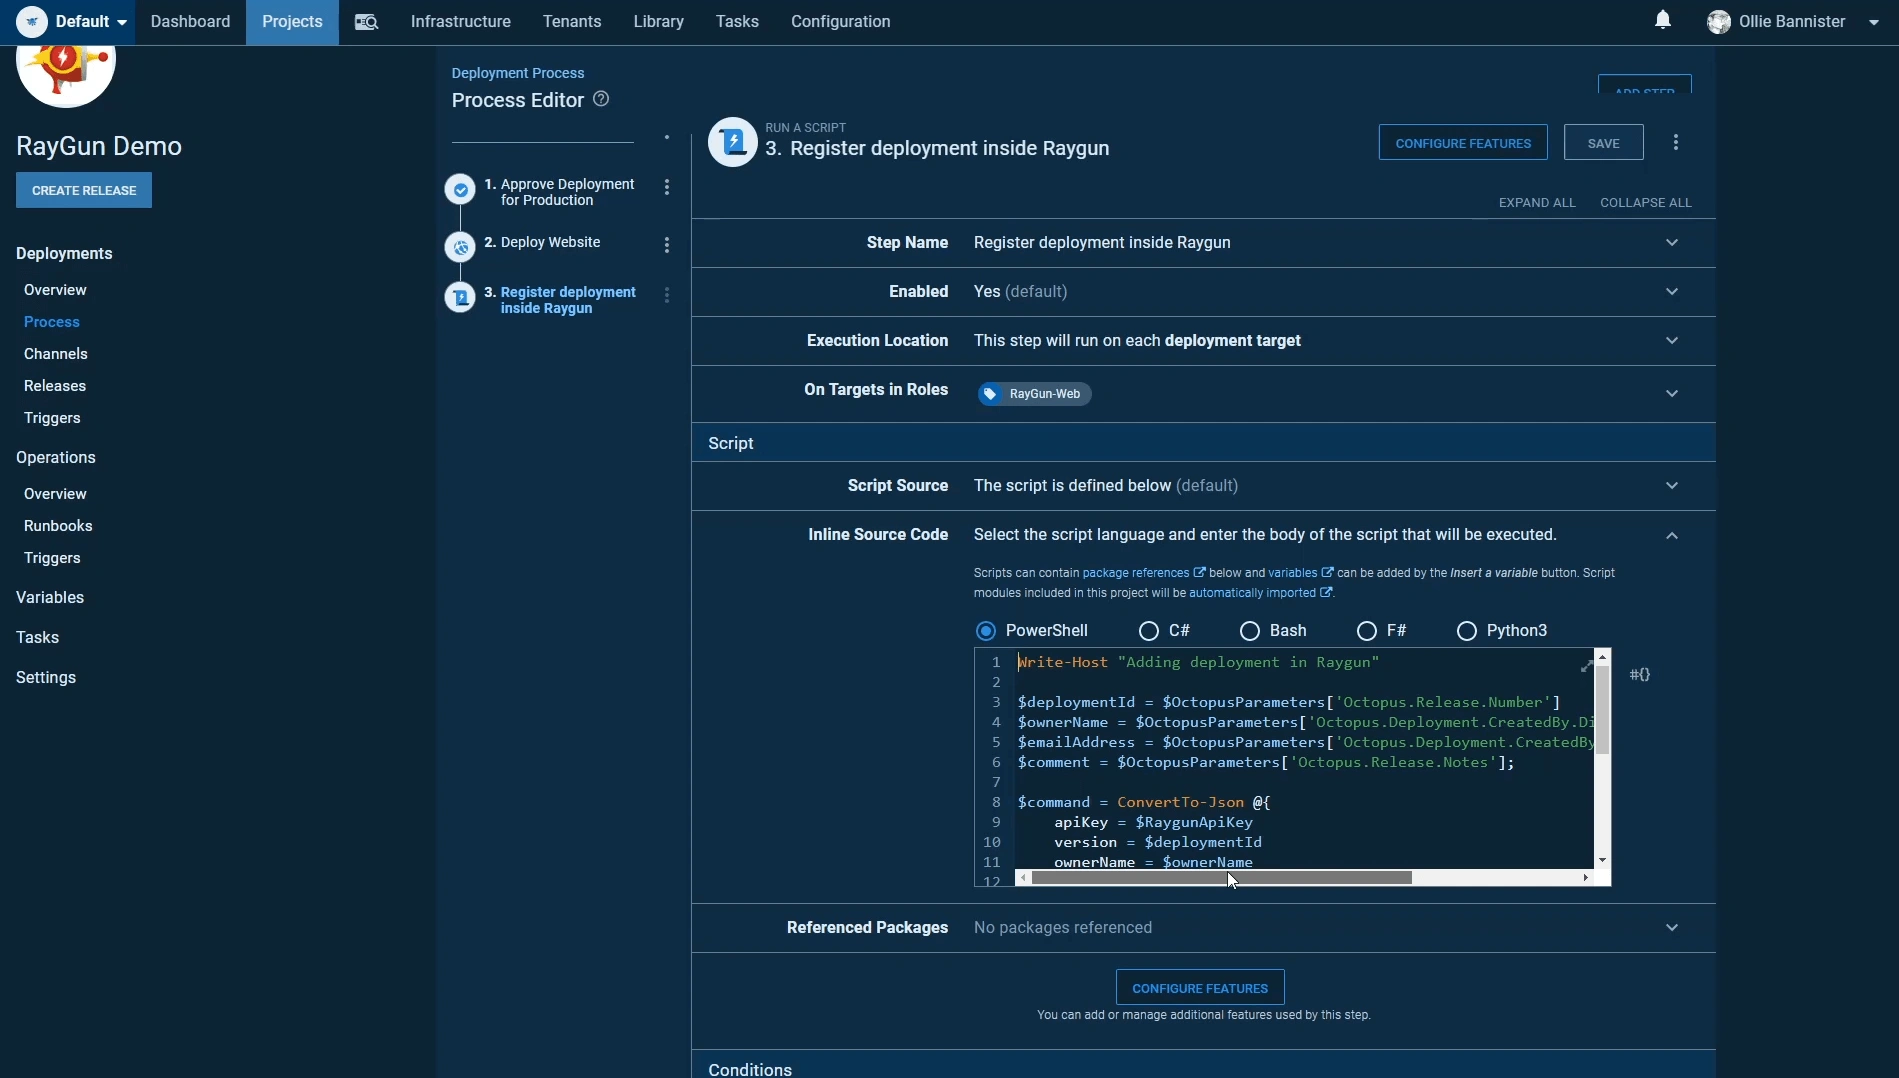
More information on how to set this up can be found in our deployment documentation and you can see and install the Raygun register deployment Octopus community step in your Octopus instance.
Encounter problems
Now that the errors we introduced have been released out to production, we can revisit our demo website and try completing the signup process again.
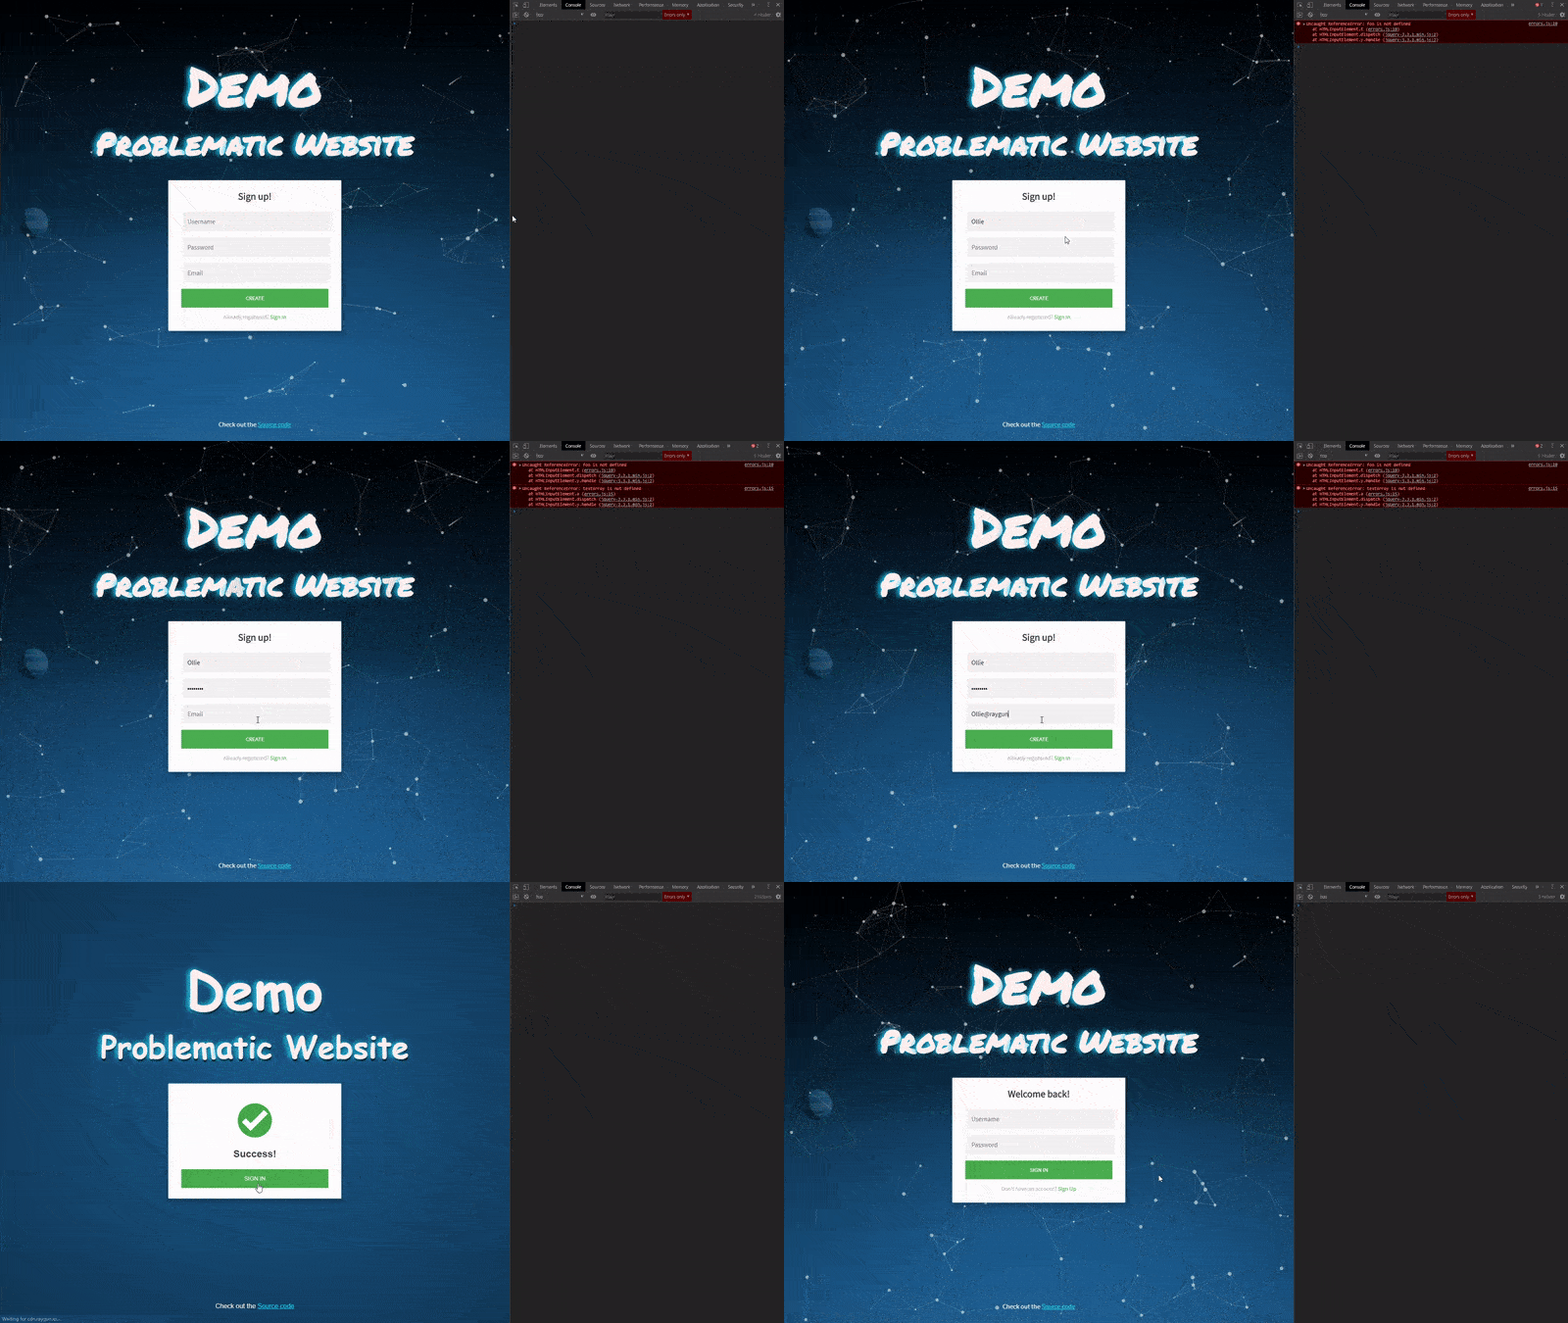
As we filled out the form we triggered three different errors when filling and submitting the form, however, we were still able to proceed with the signup. This gave us the impression that everything was working as intended. This makes identifying issues with your software a difficult task without appropriate monitoring in place.
Identifying issues and bad deployments using Raygun
Making use of a monitoring tool such as Raygun makes it easy to detect issues early, diagnose the cause of the problem and come up with a plan to resolve these issues.
Looking at the Raygun Crash Reporting dashboard we can see that there was a deployment that correlated in a spike in errors.
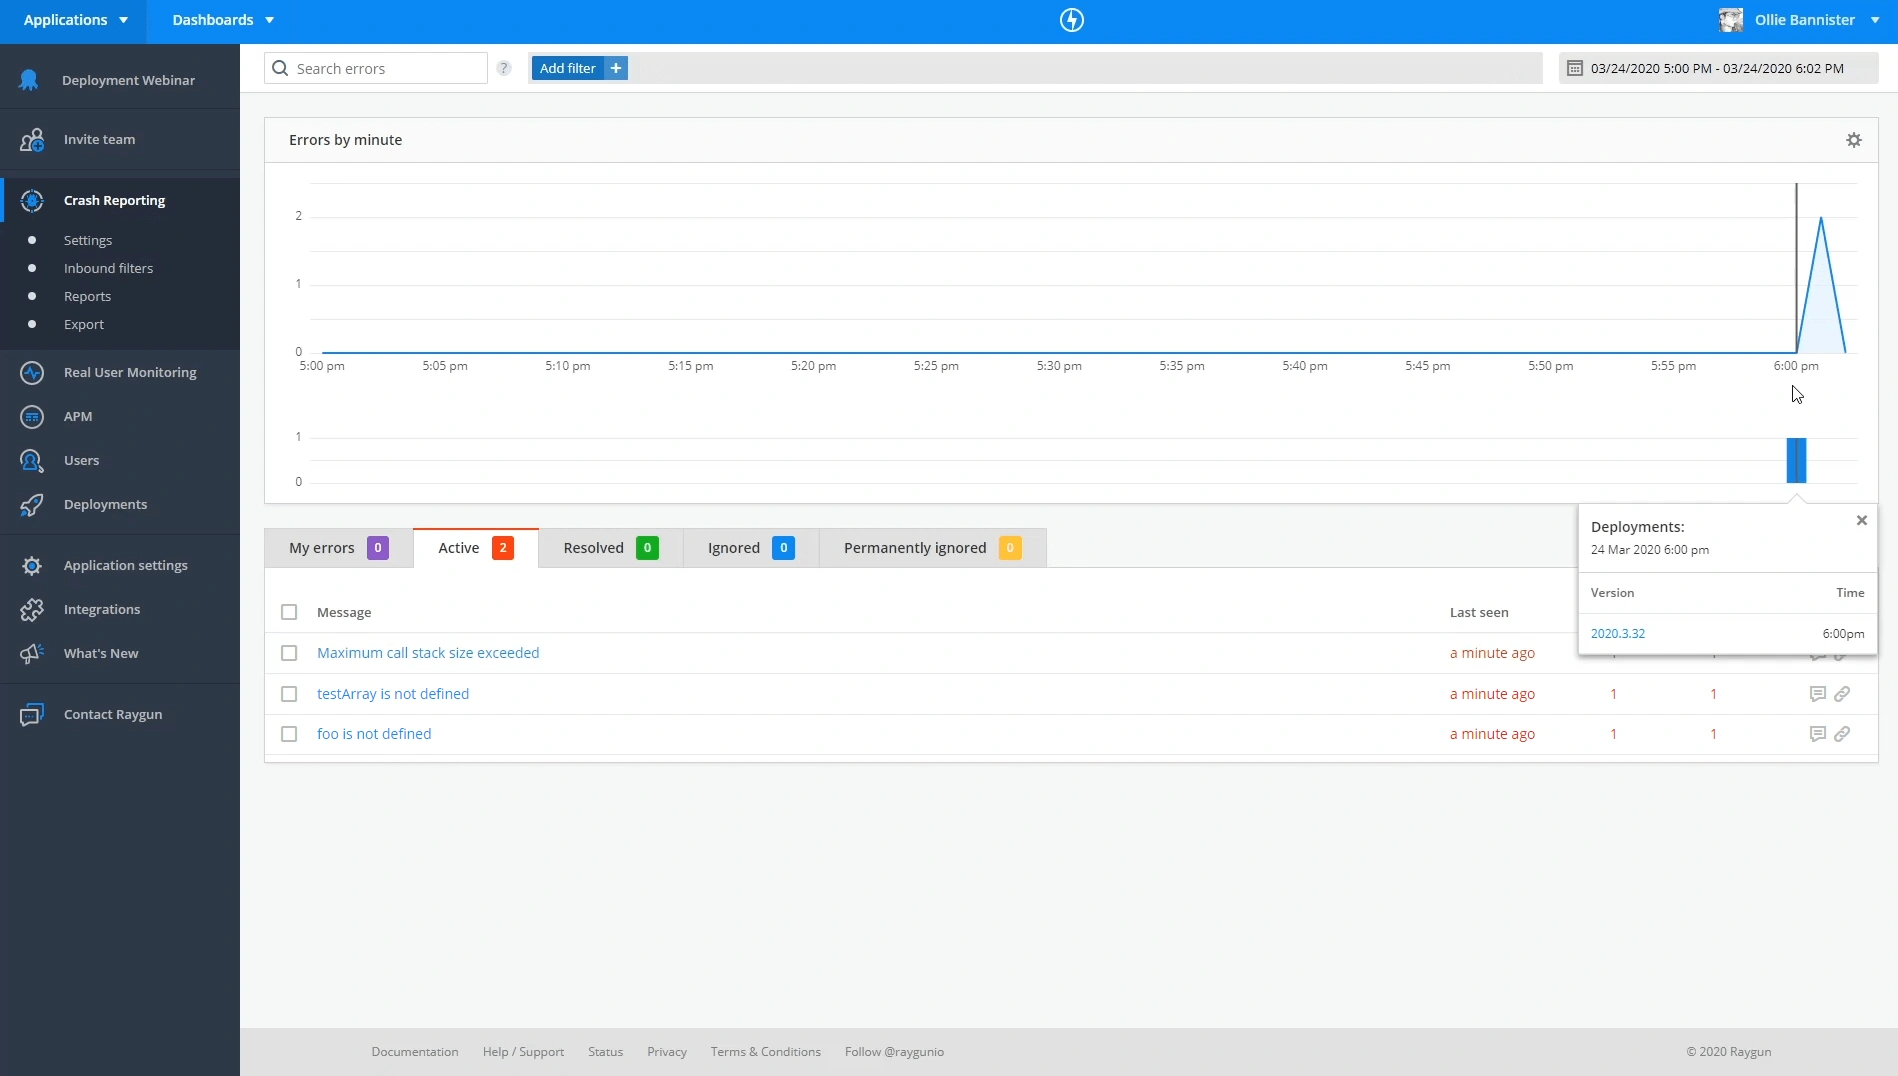
We can drill into the specific deployment and see information such as new errors caused since the deployment, any regressions (issues that have reappeared) and also any issues that are still occurring. Making use of our Slack integration and email alerts ensures you can pick up on problems quickly and resolve them before they start impacting customers and costing you revenue.
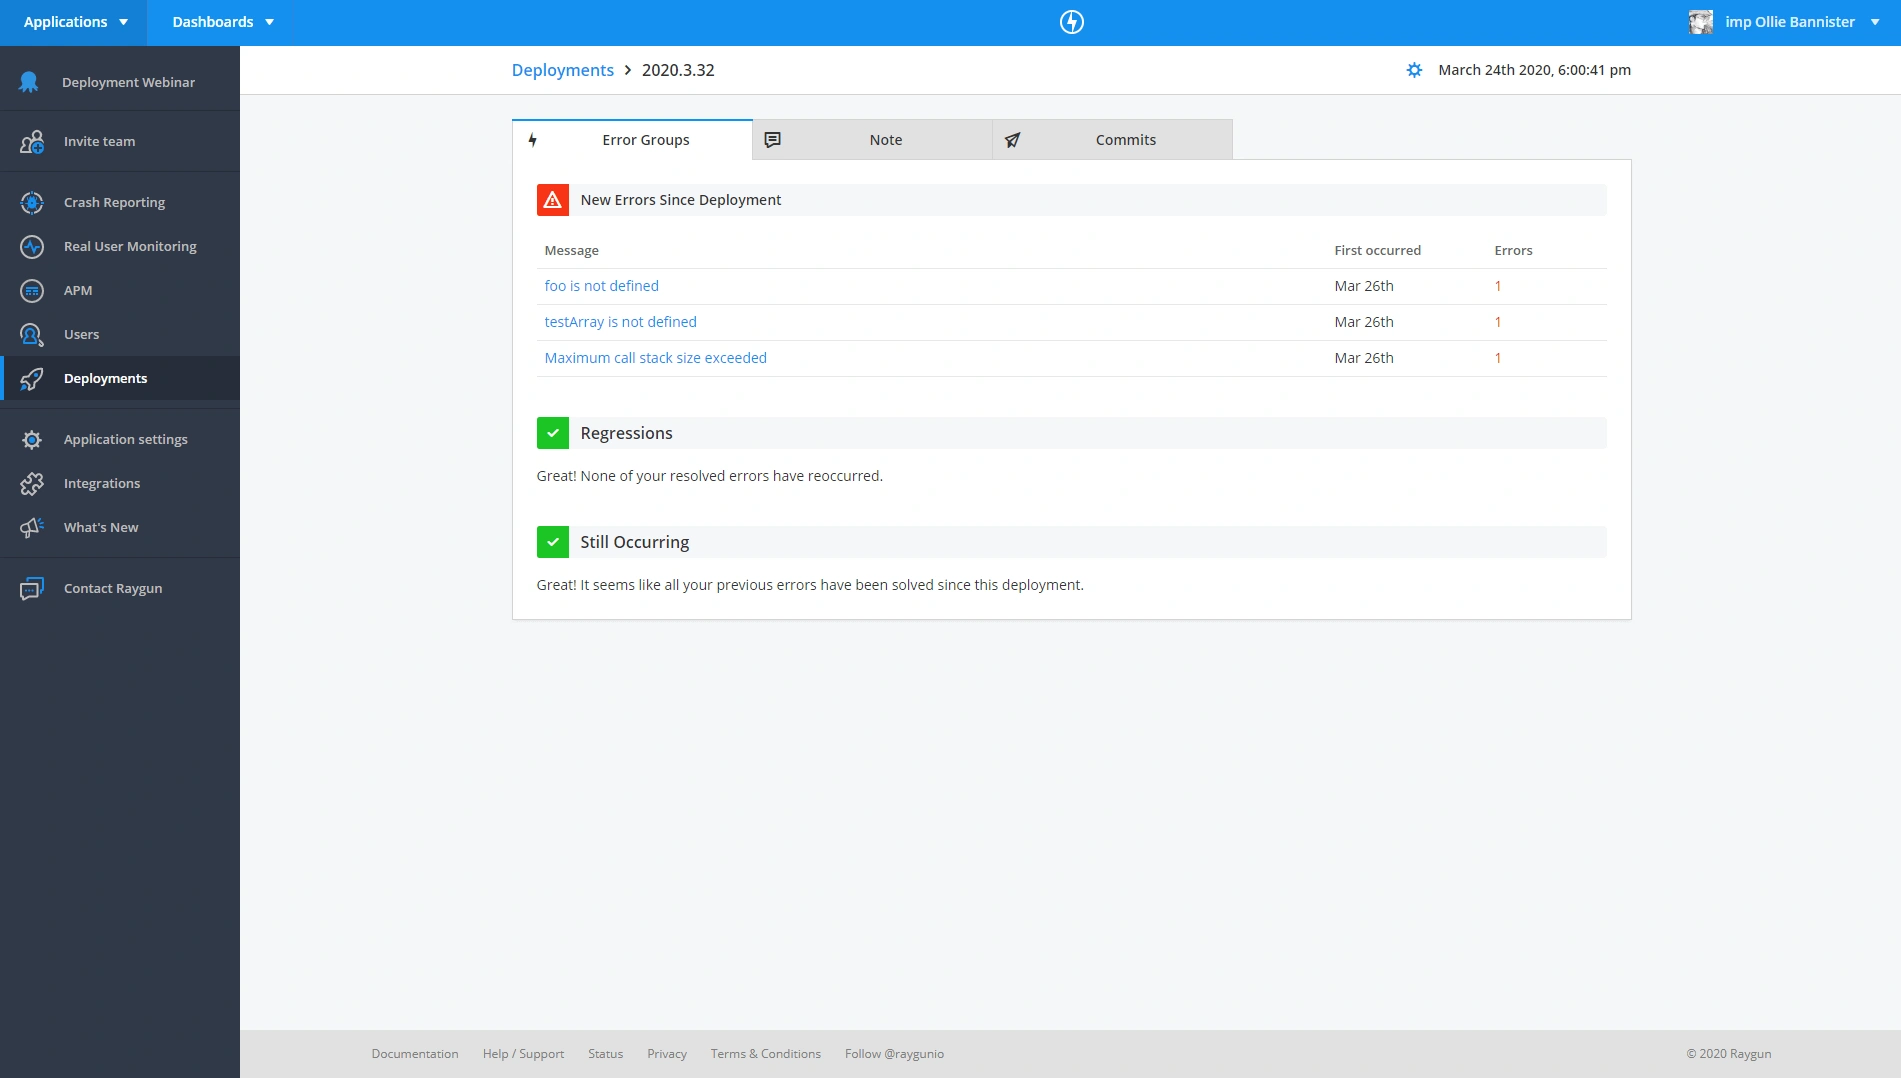 Our latest build version introduced 3 new errors.
In addition to this, by making use of our top-level filters feature in conjunction with Real User Monitoring we can also gain visibility into specific performance metrics associated with each build version.
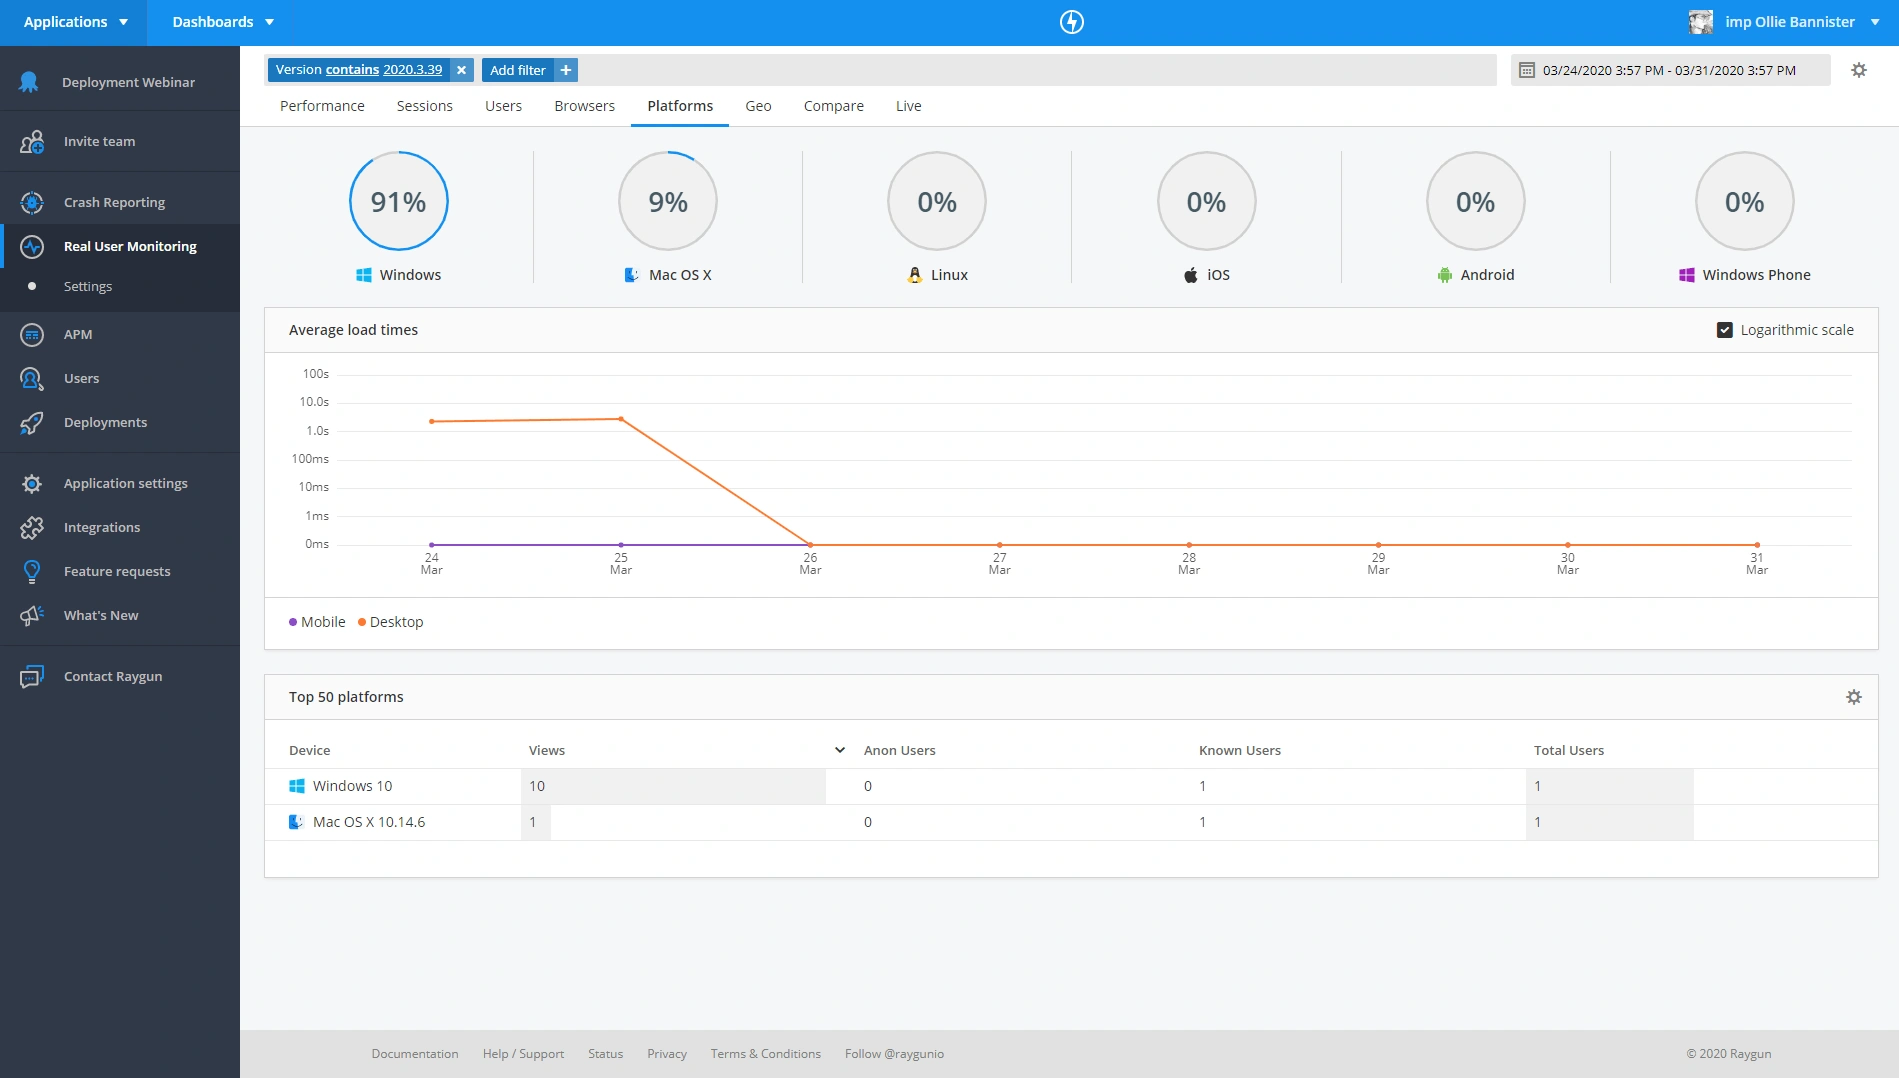
Comparing two versions against each other can also highlight any positive or negative impacts our changes have had on our website.
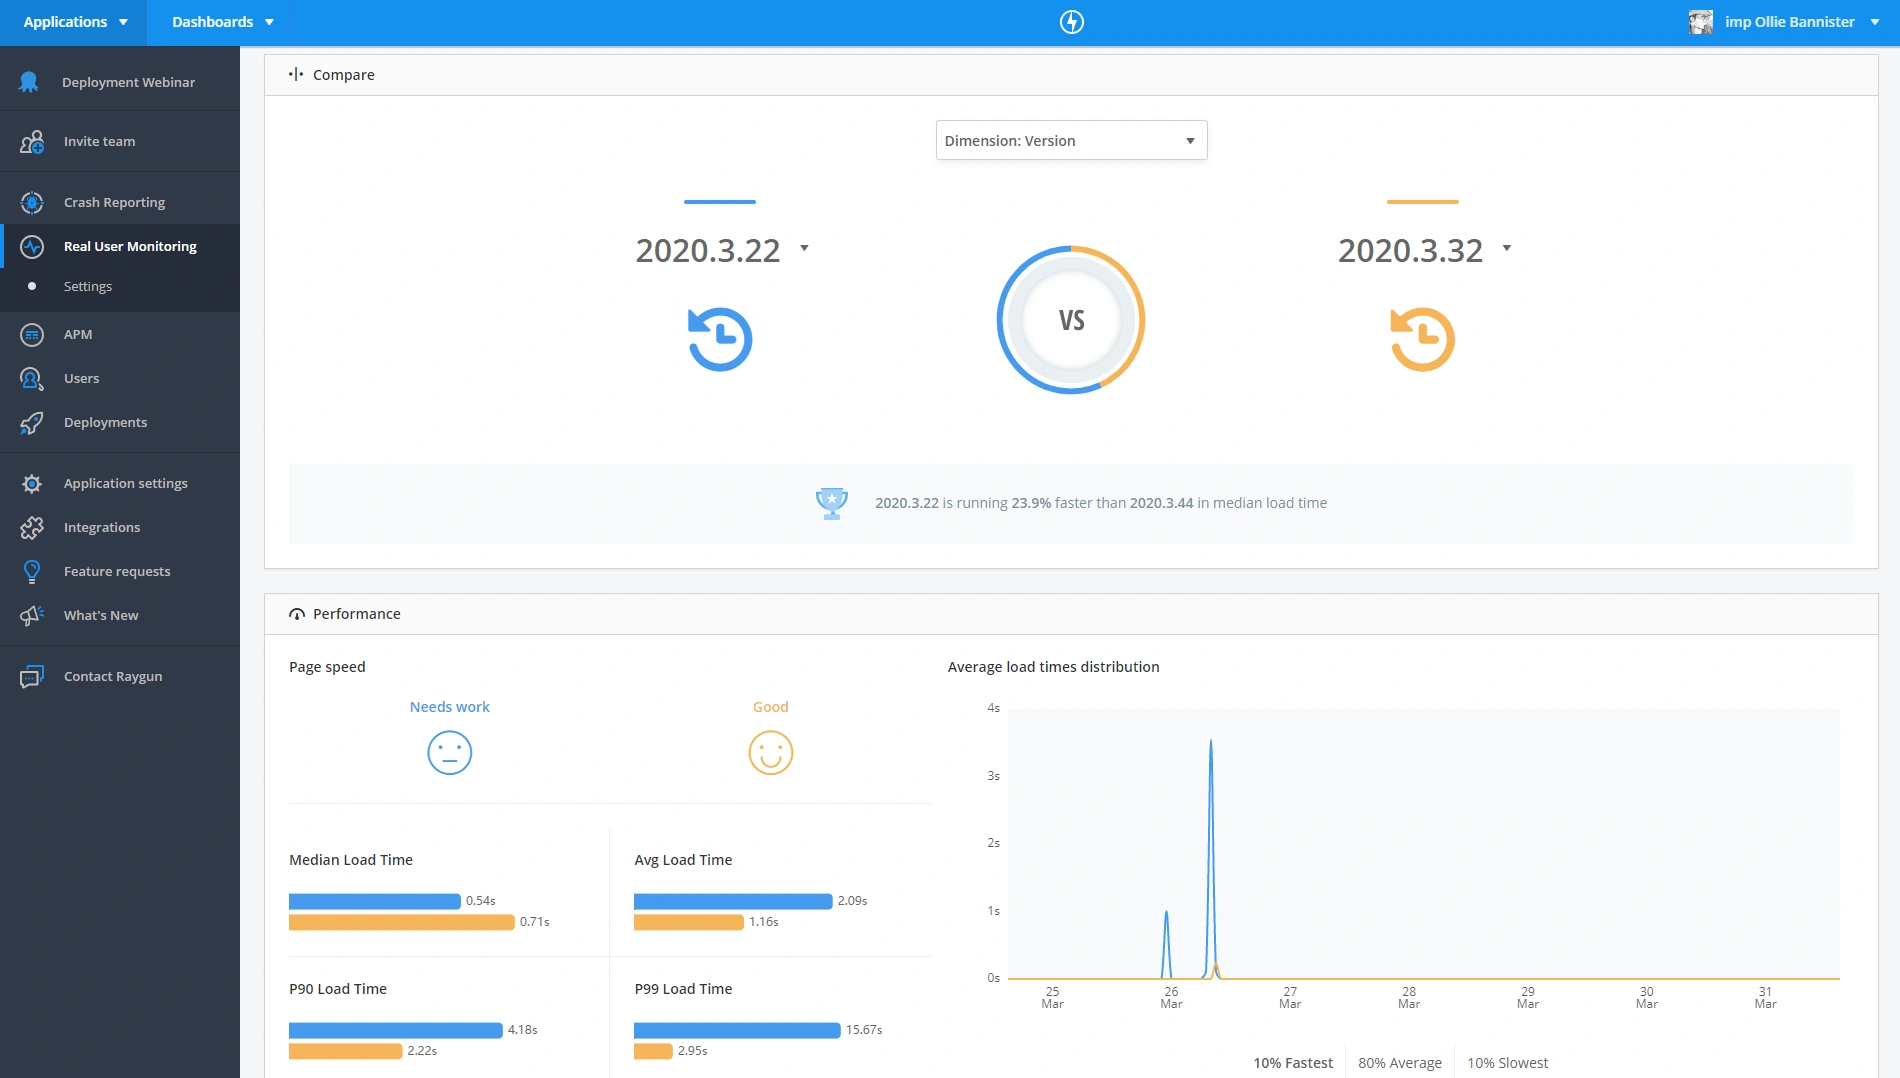 Our latest build version made things slower.
Resolving issues
Now that we’ve identified that our latest deployment wasn’t desirable, we can jump in and fix the problems. To do this I’m simply going to revert my previous change setting enableErrors = false;, committing and pushing up my changes and letting the build pipeline work it’s magic.
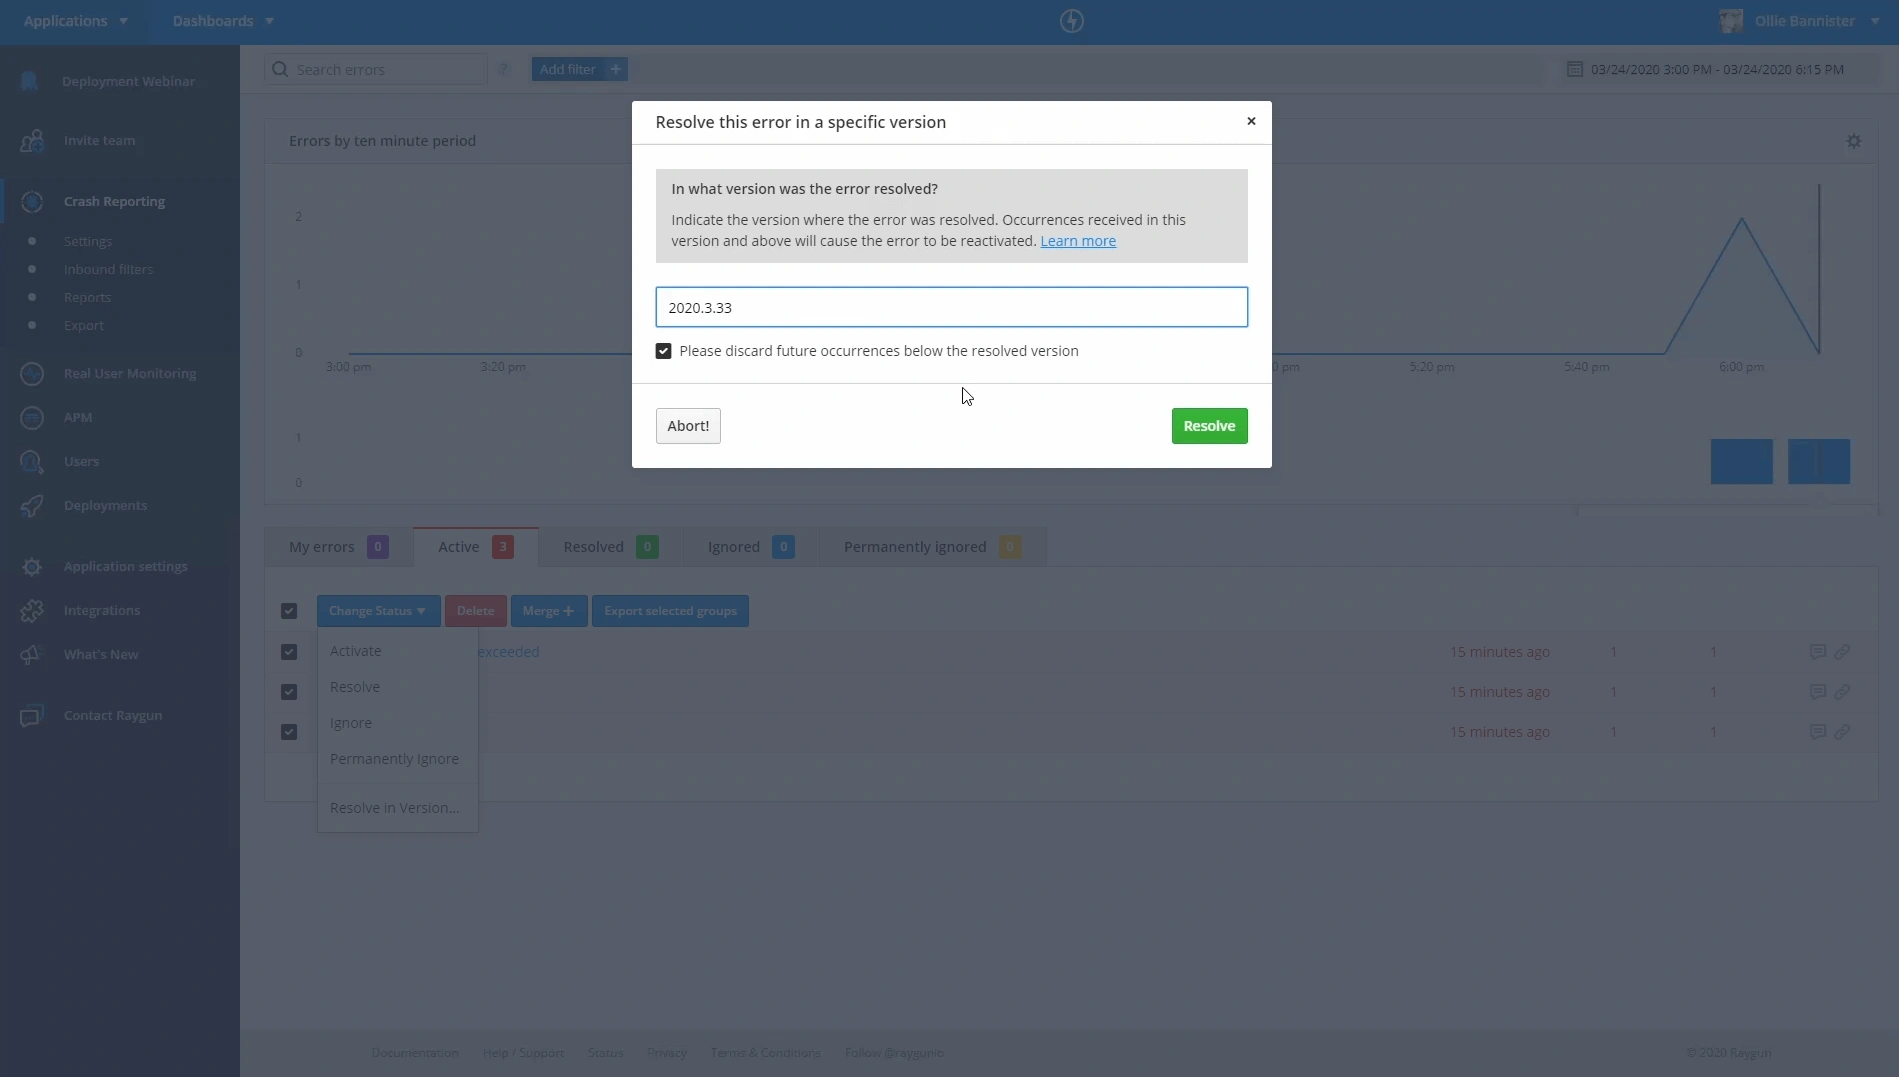
We’re fairly certain we resolved the errors captured by Raygun but often at times, it can be hard to be 100% sure. This is where our “Resolved in version” status comes in handy. Resolving these errors and setting the build version to match our latest deployment gives us peace of mind that if these errors arise after this has gone out we will be notified once again.
Rolling forwards vs Rolling back
One approach within Octopus to fix any bad deployments is to re-deploy the previous version. So, for instance, if you deployed version 2020.3.16, which caused issues, you could re-deploy the previous version and be back stable while you figure out what the problem is with your new release so you can then roll forward to a new version with the required features.
Rolling back doesn’t scale to systems that have a data layer, which is what almost all applications have in one way or another. In this approach, you probably have about 1-2 minutes during which you can rollback, and not many bugs, if any, are caught in Production in that time frame, and if you’re past this point, it is the point of no return for that release. Your only option is to roll forward with a new version that contains the bug fix, which is affecting your Production systems as you’re looking at a considerable amount of data loss.
One approach to help mitigate these issues is blue-green deployments. Blue-green deployments are a pattern whereby we reduce downtime during production deployments by having two production environments (“blue” and “green”). You could deploy different releases to different environments, and test this before switching them over at the Load Balancer level.
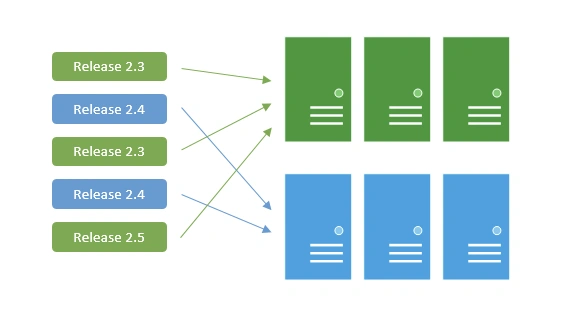
Blue/Green is not without its issues. With Blue/Green, you need to keep the data layer consistent for both releases and requires a lot of discipline from database developers. You can use Turquoise Database Development to stick to predefined development rules that will help keep your data layer consistent and flexible enough to deal with different releases.
The real issue here is that you haven’t tested or monitored enough. The recommendation is to test and monitor more in your Dev, Test & Pre-Production to catch any of these bugs before they become bugs affecting mission-critical applications. The issue is that data layers are almost impossible to roll back to unless in a situation where there is a system-wide failure and it becomes a necessity.
The one key take away from this section is to ensure that you have a fully automated CI/CD process with monitoring to allow you to get fast feedback on your application and rollback or roll forward based on your and your applications requirement.
Wrapping up
Setting up the correct tooling to build, deploy, and monitor your website plays a key role in ensuring your users are left feeling confident in your service. Hopefully today I’ve demonstrated that using Jenkins, Octopus and Raygun in conjunction with one another can make this process easy for you.
Resources mentioned
Live recording
Link
Blog posts
Inside look at Raygun’s CI/CD workflow
Documentation
Octopus documentation
Raygun documentation
Videos
Tooling
Free Starter edition for Octopus Server
14-day free Raygun Platform trial
Previous webinar recordings and upcoming webinars
Samples
- Octopus sample repositories
- Problematic website example
- Octopus sample apps
- Jenkin sample projects
- Team city sample projects
- Azure sample apps
Reach me on socials @Olwiba | @DevOpsDerek
