How we made an 83% performance improvement using Real User Monitoring
Posted Aug 18, 2020 | 4 min. (779 words)As applications evolve, we may start to lose visibility into why things are slow.
Web apps often suffer in silence as customers are more likely to leave when they’re unsatisfied rather than reach out. Complex user flows, resource-intensive API calls, and an ever-growing codebase can all contribute to poor performance.
This is why we don’t have scheduled performance days. At Raygun, the engineers are empowered to investigate improving the performance of our product, using our own tools to support us.
Today, I wanted to share a story about how we surfaced a performance bottleneck using Raygun Real User Monitoring (RUM) . This process helped us make an 83.8% performance improvement in the time taken for a React component to mount, and saved our customers an estimated 197 hours per week.
I hope it inspires you to improve software performance for your customers. Here’s how we did it.
The discovery process in Real User Monitoring
RUM gives us a high-level overview of how our entire application is performing, but we wanted to refine this to a specific area of our codebase. We separate our application by product using top-level filters that allow us to remove anything we aren’t interested in. We already knew that we wanted to look at improving the performance within our RUM product, so we applied this as a top-level filter:
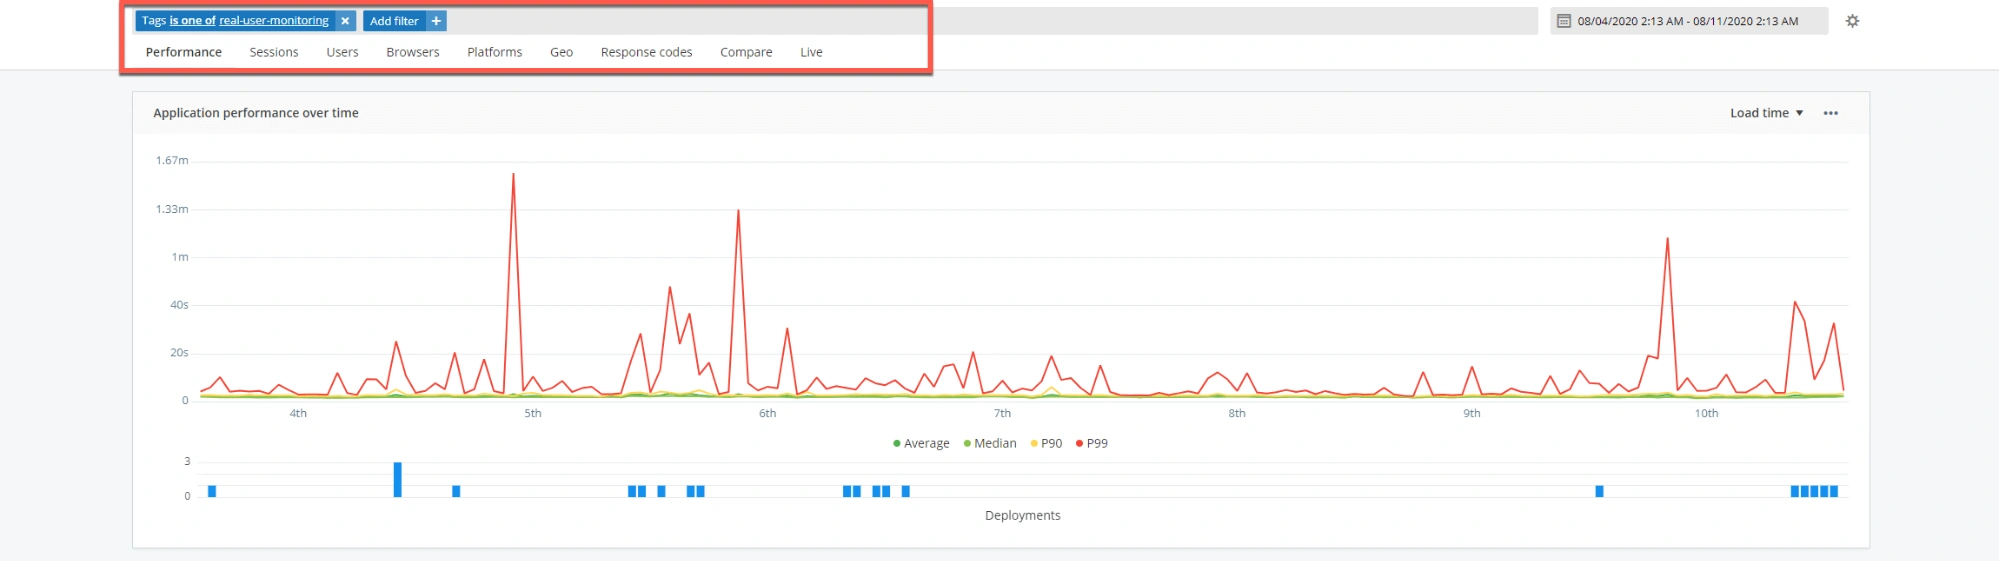
Looking at the most requested pages module, it was easy to identify where our efforts should be focused. We then looked at the 99th percentile (P99) of users who experienced slow load times on our most popular page, and ascertained that the render portion of the load time breakdown was a prominent issue.
That’s great — we now understood what was contributing to the slow load time. But we weren’t satisfied yet. At this point we knew where to start looking, but we still wanted some more information. That’s where custom timings came in.
Using custom timings to track our ‘hero’ element
The Custom timings module in RUM gives us the flexibility to track the performance metrics that we care about. By identifying our ‘hero’ element (the most important element of our page) we were able to configure custom timings to not only track the time taken to render the view, but also the time it took for our ‘hero’ React component to mount.
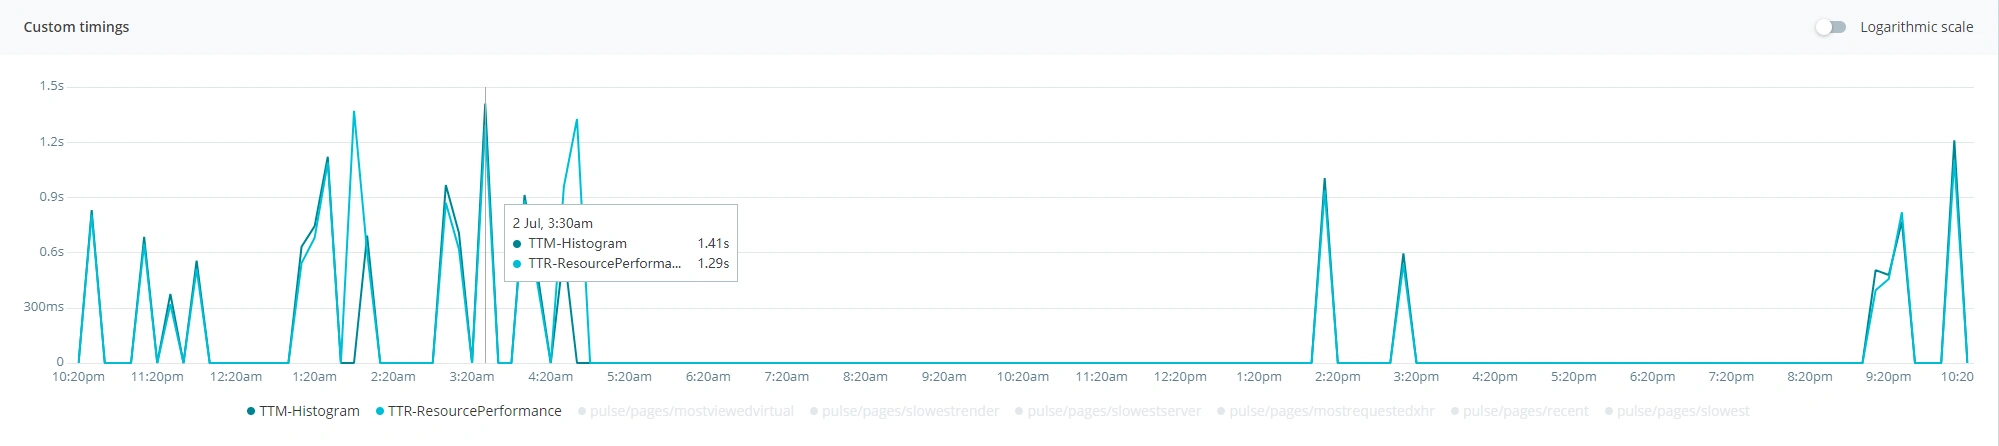
What we found was that the component was mounting upwards of 1.4 seconds into the render cycle. That’s far too long to be waiting for the most important element on the page to show.
An interesting point that we noted was that the time between the view rendering and the component mounting was around 200ms on average. Another possible area for improving performance.
These were all great insights into where the problem was lying, but what was causing the issue?
Dusting an old tome
We started digging into the codebase, confident that we would find something of interest and equipped with the knowledge of where to look.
It didn’t take us long to find the issue. An unnecessary API call which was blocking the rendering of our component.
We were delaying the rendering of our component with an unnecessary API call.
That was it. A call to fetch information was needed for the page to render, but over many iterations became information that we already had access to!
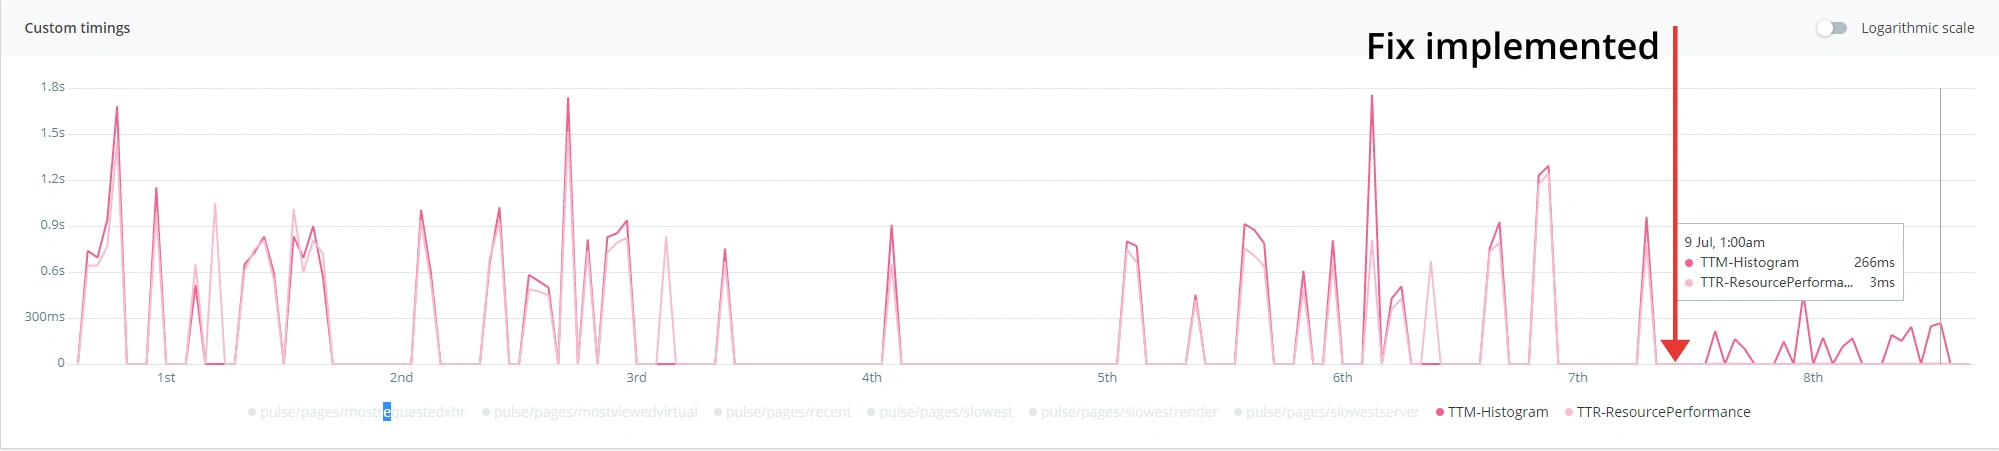
Improving performance and the fix
The fix itself took almost no time at all. The issue may have never come to light without insights into exactly where we were experiencing performance bottlenecks.
We were able to pull the required information from the previous page and the query was only needed to get the non-wildcarded version of the URL, but nothing else is reliant on that. It was straightforward ensuring that the query would no longer block the rendering of our component.
Our team only spent a few hours diagnosing the issue and applying a fix, saving valuable time, and allowing us to focus on bigger tasks.
The best part is that our customers no longer have to wait unnecessarily to see the most important part of our page. We saved the customer upwards of 1 second per visit. Based on the number of views for this page per week, that’s 197 hours saved.
The return on investment is apparent for improving performance for customers. Empowering developers with performance monitoring tools like RUM is critical in surfacing issues before they become long-standing, unwanted features of your application. Why not try to see if there are any quick application performance improvements you can make?
Diagnose front-end performance bottlenecks and deliver faster software experiences for your customers. Try Raygun’s Real User Monitoring tool free for 14 days.
![.NET Core or Node.js? [We increased throughput by 2,000%] featured image.](/blog/wp-content/uploads/2017/05/net-Raygun-um.png)