Debug iOS applications in six easy steps
Posted Oct 29, 2018 | 7 min. (1307 words)In this tutorial, we’ll debug an iOS application with Apple’s Xcode. Xcode is a robust environment for developing and troubleshooting iOS applications. We’ll see how we can use it, alongside Raygun’s iOS Crash Reporting, to quickly address an application deficiency.
Raygun lets you detect and diagnose errors and performance issues in your codebase with ease
We’ll follow six steps to examine a simple application and isolate and fix a bug.
- Setup a sample project
- Analyze a Raygun debug report
- Explore Xcode’s debugging tools for iOS
- Set a breakpoint in Xcode
- Run the application with a breakpoint
- Isolate the bug and fix it
This tutorial requires a macOS computer with Xcode installed. We’ll be using the current version of Xcode at the time of this writing, which is version 10. The source code for this project is available on Github.
So, let’s get started!
Step 1: Sample project
We’ll use a single view iOS application for this tutorial. The single view has a button with text that changes for each press.
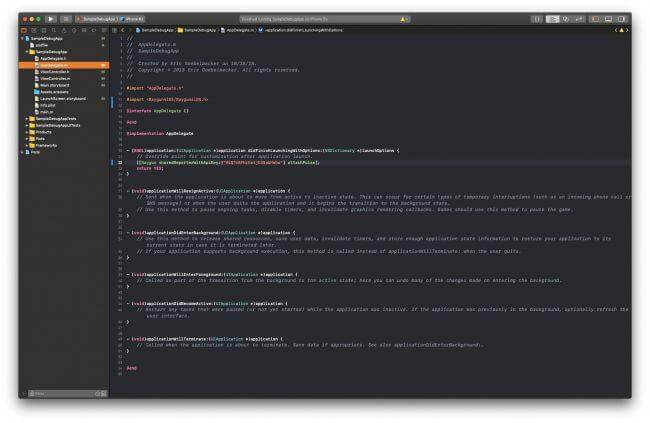
If you want to follow along, you’ll need to sign up for a Raygun account. After you check out the project, add your Raygun API (Application Programming Interface) key to didFinishLaunchingWithOptions in AppDelegate.m
- (BOOL)application:(UIApplication *)application didFinishLaunchingWithOptions:(NSDictionary *)launchOptions {
    // Override point for customization after application launch.
    [[Raygun sharedReporterWithApiKey:@"YOUR_RAYGUN_KEY"] attachPulse];
    return YES;
}
You can find complete instructions for setting up an iOS application. You can follow this tutorial with your application if you prefer.
Here is the sample application’s startup view.
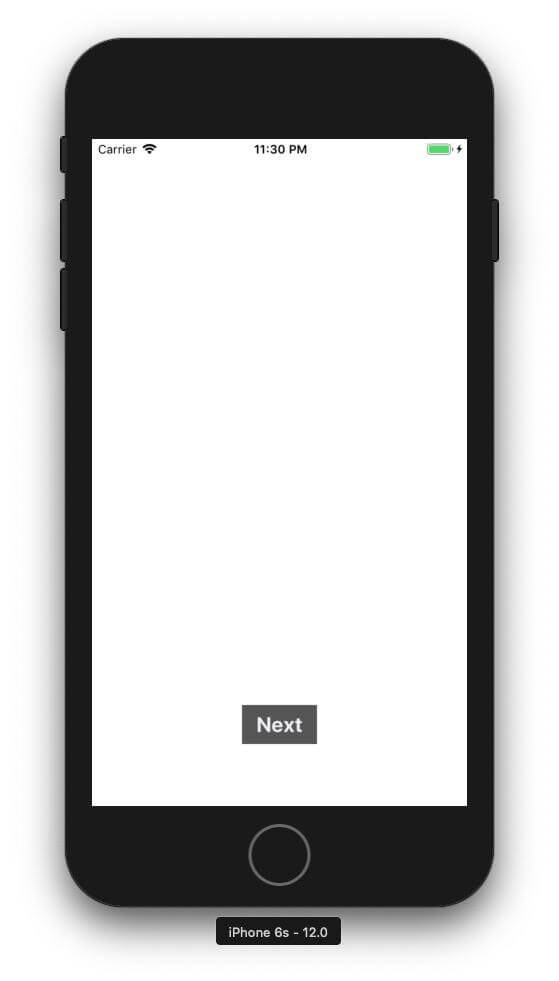
Each time you tap the button, the display text changes. After a few presses, the application crashes. Imagine that this application has been released to the App Store and was already approved. You need to track down the bug fast!
Step 2: Analyze the Raygun debug report {analyze}
Fortunately, you integrated your application with Raygun Error Monitoring and Crash Reporting, so you can use the information to get an idea of where to look for the bug.
First, let’s look at the error summary.
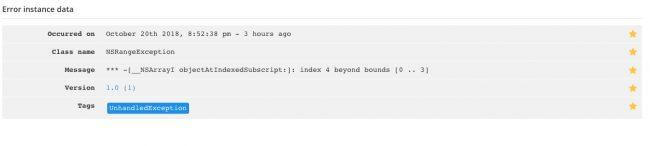
Since we forced the error now, we don’t need the date and time. But in the event of any errors happening in deployed applications, the date and time can be advantageous. The class name and error message tell us a lot about the error. NSRangeException indicates that the code exceeded the bounds of a data structure, and the report suggests a subscript out of range is causing the crash. Raygun also provides a backtrace for the error.
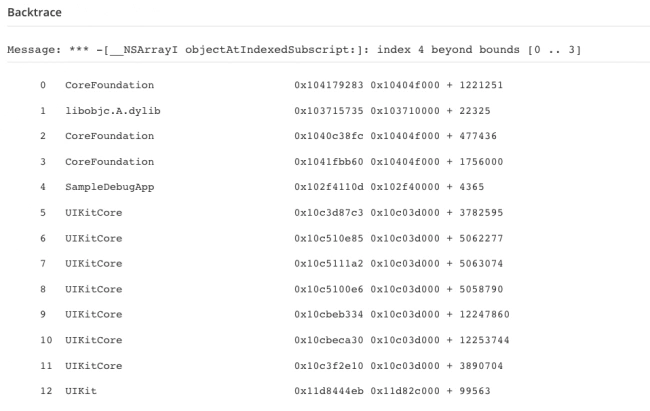
Since we’re dealing with an uncaught exception, the backtrace only provides us with a rough idea of where the error is occurring; somewhere in UIKit. So, we’ll need to run the application in a debugger to find the exact location.
Step 3: iOS debugging with Xcode
Xcode provides iOS developers with an integrated environment for developing, testing, and debugging iOS applications. The simulator supports all current iOS platforms. You can install and run applications with a single click, and the environment has integrated support for the lldb debugger.
So, you can debug your application on your development desktop. Let’s start with replicating the error in the simulator.
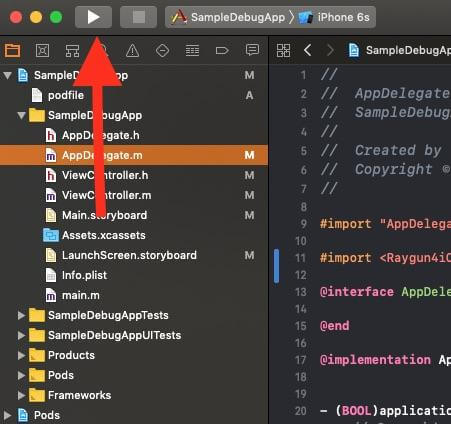
We want to be sure we run a debug build, so start by holding the option key and clicking the run icon on the upper left-hand side of Xcode. This brings up the run options dialog.
Make sure that you have Run selected on the left-hand side, and debug build enabled on the right. Now, click on the run button. After the build completes, the application will start in the simulator.
Next, click the iOS app’s button until the application throws the exception and the debugger comes up in Xcode.
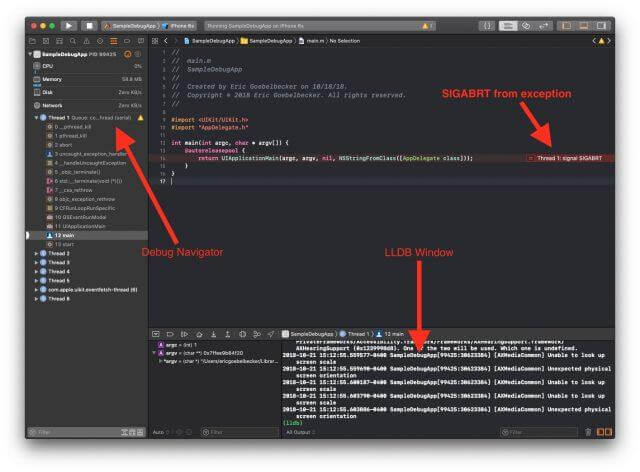
On the left-hand side, the debug navigator displays the application threads. Xcode highlights main in thread #1 since uncaught exceptions “bubble up” to that location in the application. In the editor pane, Xcode highlights that function in main.m. Xcode shows us that a SIGABRT was thrown inside main. Down at the bottom of Xcode lldb’s command line interface is available. We’re going to control it from the GUI (Graphical User Interface).
Finally, click the stop button, next to run, to stop the debug session. Raygun already told us that the application has an uncaught exception, so we haven’t learned anything new about the bug yet. Now, let’s use Xcode to catch the exception and discover where it’s coming from.
Step 4: Set exception breakpoint
So, go to the Debug menu, select Breakpoints and Create Exception Breakpoint.
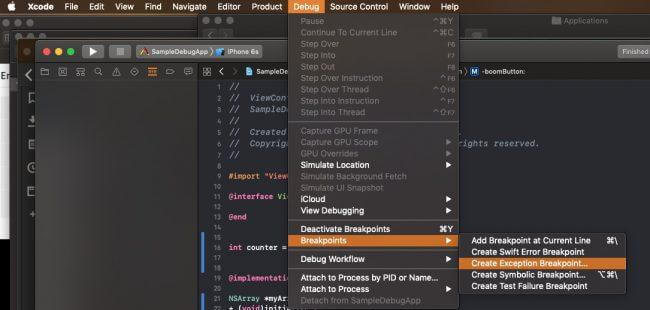
Xcode brings up the breakpoint navigator on the left, and a popup will appear.
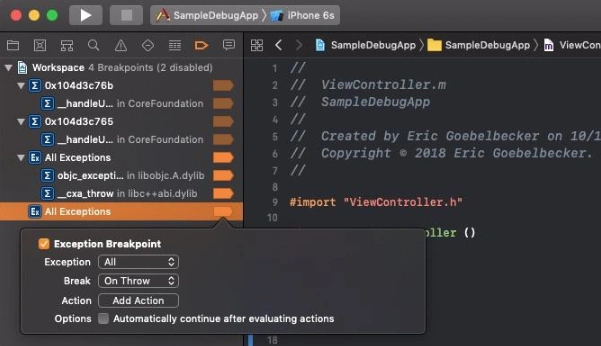
The default is to break on both C++ and Objective C exceptions and to stop the debugger where they are thrown. This will take us to where the problem occurs. Next, click anywhere to dismiss the popup and accept the defaults.
Step 5: Run the application with breakpoint
Now, rerun the application and force the error.
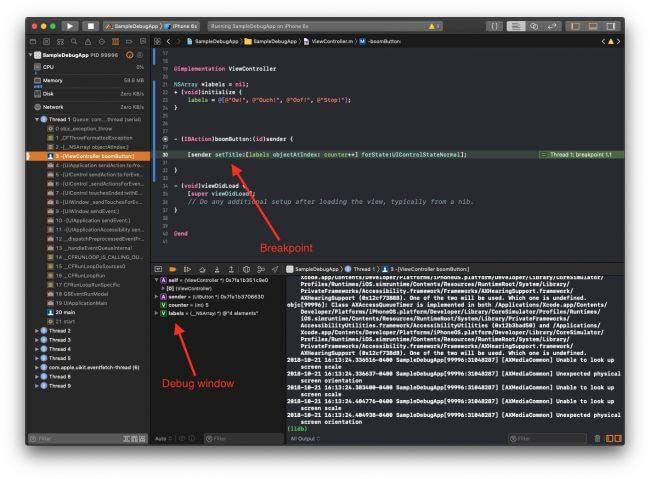
The debugger stopped when the application generated the exception and highlighted the line of code that is responsible.
Just as you might expect from the Raygun error report, the code references an array. The problem is clear from viewing the highlighted line. We’re incrementing the array index without checking bounds. If you look down in the debug window in Xcode, you can see that counter somehow made it to a value of five when the array is only four elements long.
The application should have crashed sooner than it did.
But what if the problem was more difficult to isolate? Let’s add one more breakpoint and step through the application again.
Step 6: Isolate the bug and fix it
First, stop the debug session
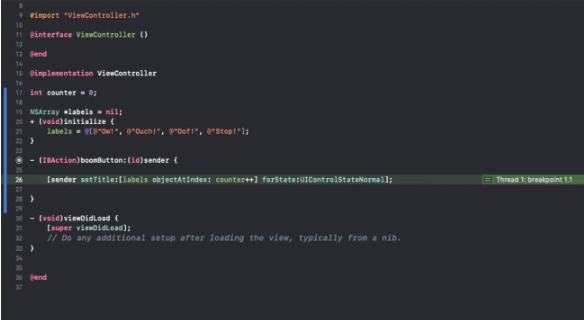
Next, double-click next to the offending line in the source code to bring up a breakpoint dialog popup.
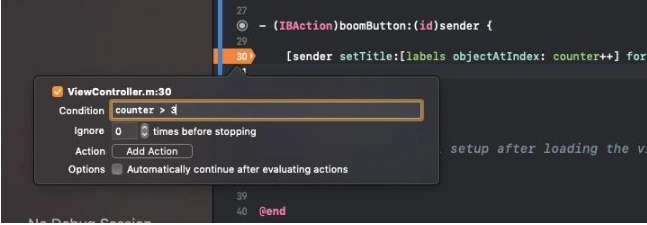
Add a condition for the breakpoint; counter > 3.
Rerun the application, and when you force the error, it will stop before iOS throws the exception. The array index and the increment are on the same line of code. So, continuing after the breakpoint will still result in iOS throwing the exception. This breakpoint makes the bug clear, and we can see how conditional breaks can help isolate a thorny problem.
There are several ways to fix this bug. Most of the better ones involve a different design, but let’s go for a quick fix.
@implementation ViewController

int counter = 0;

NSArray *labels = nil;
+ (void)initialize {
    labels = @[@"Ow!", @"Ouch!", @"Oof!", @"Stop!"];
}

- (IBAction)boomButton:(id)sender {

    if (counter == 3) {
        counter = 0;
    } else {
        ++counter;
    }

    [sender setTitle:[labels objectAtIndex: counter] forState:UIControlStateNormal];

}

- (void)viewDidLoad {
    [super viewDidLoad];
    // Do any additional setup after loading the view, typically from a nib.
}

@end
By checking the array bounds before we increment the counter, we never exceed the array length. Rerun the application, and the crash is gone.
Next steps
Apple’s XCode development tool simplifies debugging iOS applications. It provides integrated support for an advanced debugger as well as GUI-based shortcuts for common tasks like adding breakpoints.
Fortunately, you can also rely on their simulator to accurately emulate the full set of iOS devices since Apple controls the platform. Once you’ve verified an issue is addressed in the simulator, you can push to local devices and test there too.
Of course, with Raygun, you have an extra layer of protection for detecting, diagnosing, and eliminate iOS errors. The Raygun report in this example told us what the failure was, and made it much easier to isolate. Raygun’s smart alerts and error grouping means you never miss a bug in your app again. Read more about iOS crash reporting