Symbolicating stack traces from Apple system libraries
Posted Nov 1, 2023 | 9 min. (1913 words)In the world of software development, quickly finding and fixing errors drives better experiences for both end-users and developers. One key tool in this process is the symbol map, which records debugging information that was lost in the compilation process. Symbol maps (or source maps if we’re talking JavaScript) connect the code developers write to the minified code in production, making it easier to decipher crashes by pinpointing the exact source code that caused the error. This very same concept of symbol mapping for “symbolication”—the term we use to refer to the process of mapping back to source code—is used by nearly every language. This includes Apple’s Objective-C and Swift, which are used to develop native software for Apple devices.
In contrast to the transparency of JavaScript source maps, Apple’s symbol mapping landscape appears rather mystifying. Allow me to pitch a scenario that illustrates this. You’re a macOS developer working on a seemingly simple application. Your application has a “Submit” button, which performs as expected during isolated testing. However, once your app is in the wild, you receive sporadic crash reports from the button’s controller. Your logging tells you that the crash occurs far less frequently than the submission, so not every press of the button is plagued by the crash. Baffled, you test it again in isolation. No crashes. So, what’s causing the issue?
The crash reports tell you that the button’s controller is trying to operate with an invalid state, the dreaded NSInternalInconsistencyException. Where this Schrödinger’s exception is originating from, you have no idea. Hoping to gain more insight, you dig into a crash report, but the stack trace just contains raw memory addresses instead of useful method and class names.
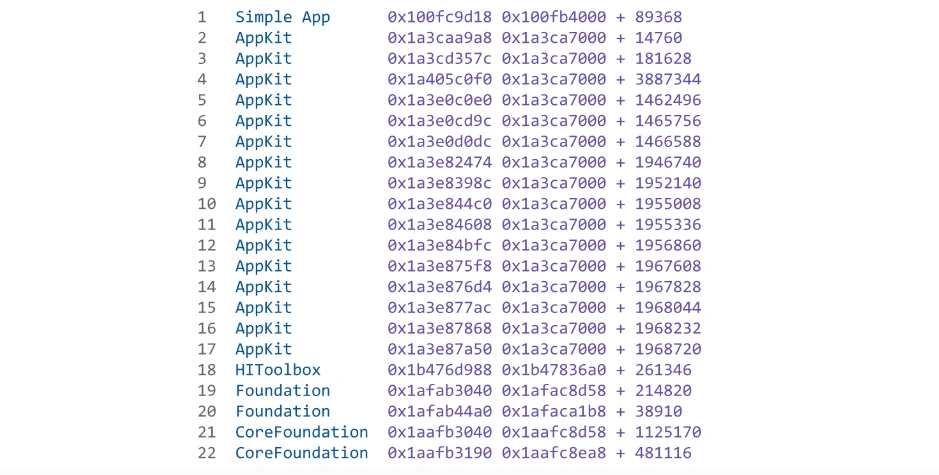
The trace originates from your application, “Simple App,” but the error seems to be coming from the CoreFoundation system library. Apart from that, you can’t make any sense of the seemingly unusable memory addresses and offsets.
So, how do we extract any value out of this stack trace? Symbol mapping, of course! If you’re familiar with Apple development, you know about dSYM (debug symbol) files. dSYM files, like every other type of symbol map, record debugging information that was lost through compilation. These sound like the solution to our cryptic stack trace, right?
Well, let me ask you a question: which of the above lines could be symbolicated using only Simple App’s generated dSYM file? The correct answer is one of them, the very first one. Nothing after the Simple App call would be covered by its debug symbols alone. For that, we would need some special Apple-sauce.
That, at last, brings us to the focus of this article: Apple-sauce, probably better described as symbol mapping for Apple system libraries. Without the ability to decipher Apple system library calls, debugging can feel like trying to solve a jigsaw puzzle that’s missing half the pieces. Fortunately, there are ways to obtain some of their original source code structure for symbol mapping. I’ll walk you through how it can be done below. Then, we’ll go back to our scenario and see what we can figure out.
Setting the stage
Enter the dylib file. While dSYM files are the gold standard for debugging because they directly map compiled code back to source code, dylib files can be used in a similar way. dylib files are dynamic libraries that, while not specifically designed for debugging, typically contain some supplementary information—more on that later. They can only provide method names and class names, never file names or line numbers, which wouldn’t be much help anyway considering Apple system libraries are often proprietary sources. dylibs come in handy when dSYM files are unavailable, which is the case with system libraries. When it comes to Apple’s proprietary code, this is as good as it gets. So, for an exhaustive symbol solution, all we need are dylib files for every version of every Apple system library! That’s about as arduous as it sounds.
Note that from this point onward, when I refer to symbols for system libraries, I am talking about dylibs.
Let’s go ahead and extract some symbols (dylibs) from an Apple “IPSW” firmware image. IPSW stands for “iPhone Software,” which is antiquated terminology given that they are now used for all Apple devices. All you need to know about them is that they contain system files for Apple devices. There are some third-party APIs that can be invaluable here, pointing us directly to IPSW firmware images hosted on Apple’s own content delivery network. Let’s pick an image for, say, iOS 17.0.2. The specific device targeted by this firmware image is inconsequential for this demonstration, so we’ll just go for the iPhone 13 Pro (confusingly identified as an iPhone14,2). If we download and unzip the image, exploring its content unveils several .dmg files alongside some other critical files for navigating through firmware data and validating its version and build details.
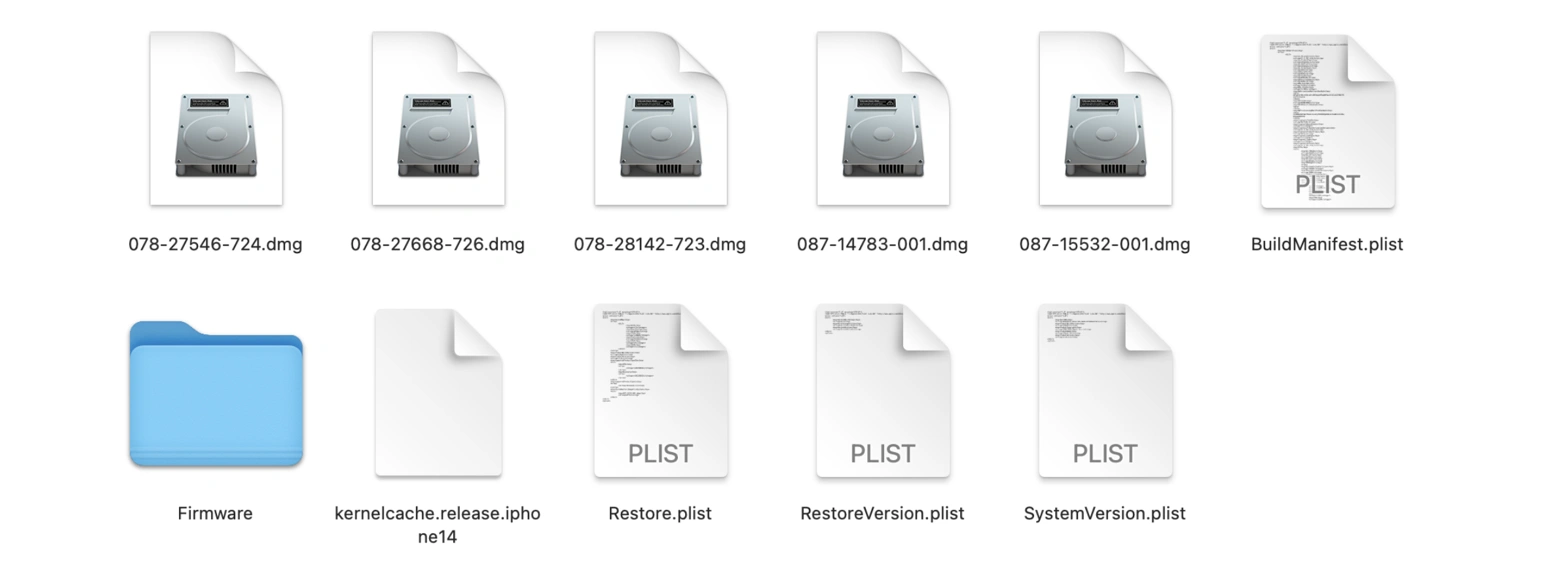
Using hdiutil attach, we can mount each of the .dmg files. This allows us to peek inside, where we will find the precious dylib files we are after.
…But wait, they are nowhere to be seen!
Surely they are present in Apple devices’ filesystems! Well, it turns out they were, at least on macOS. However, these days, Apple firmware comes embedded with a “shared dynamic linker cache” of all its system libraries. This allows Apple to save resources by reusing the compiled classes across all running instances. (If you’re interested in this concept, Dr. Panos Patros, principal engineer at Raygun, wrote a relevant paper—and even has a software patent!)
Fancy technologies aside, the important fact is that our dylibs are no longer directly accessible in the traditional sense. That said, they aren’t encrypted either. Apple’s documentation notes that we can check for a library’s presence using the dlopen() method, implying the dylibs are still reachable in some capacity. Here is a reverse engineering discussion that elaborates on this.
Alright, so at this point, we have some shared caches that somehow contain the dylibs we want. How do we extract them? Well, there are essentially two options. The first is to download the dyld project from Apple Open Source where we can find the dyld_shared_cache_util. However, this tool isn’t really built for public use. In fact, using it involves diving into its Xcode project to make changes, before finally compiling it yourself. For those of us who are after a more adaptable—even if slightly less capable—solution, Xcode’s dsc_extractor.bundle is the tool of choice. This is accessible via Xcode’s command-line tools, which do need to be enabled.
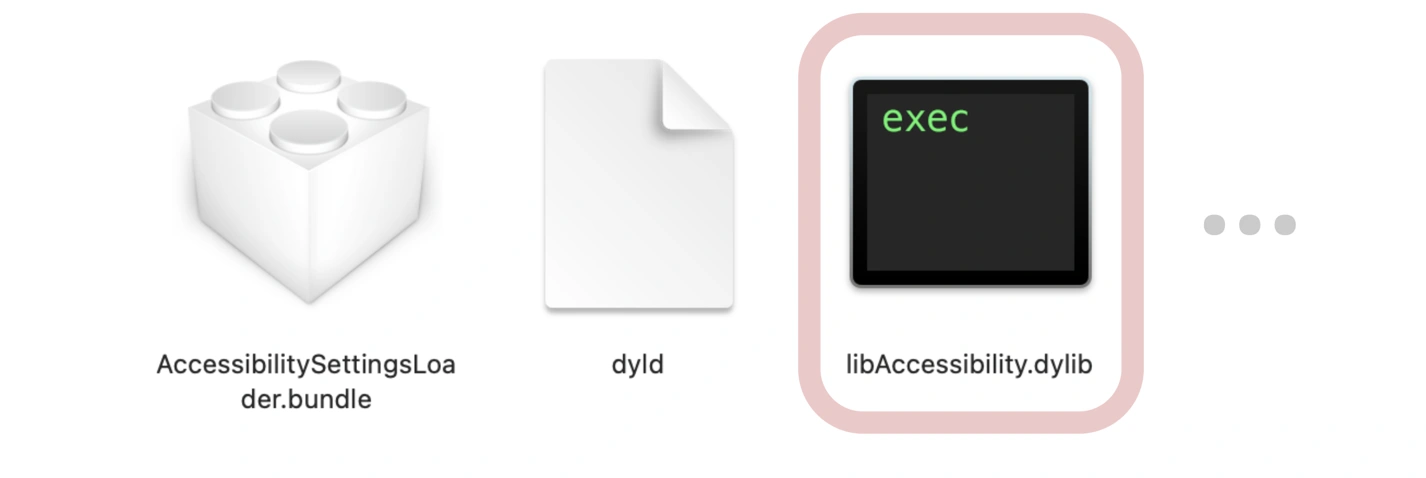
Now that we have our dyld extraction utility at the ready, we can aim it at a shared cache, and fire. When the extraction is complete, we’re left with a directory teeming with .bundle files, a dyld file, and… what’s that? dylib files!
The main event: Making sense of stack traces
Earlier, I mentioned that dylib files contain supplementary information that can be used for symbol mapping. More specifically, I said that they can provide method names and class names. To get an in-depth understanding of how, let’s open one of the dylib files—say, libAccessibility.dylib—in Hopper Disassembler.
The disassembler provides us with assembly code representations of the libAccessibility.dylib file. It reveals a jumble of sections and commands. Let’s take a closer look at one of the code procedures identified by the disassembler: _AXDarkenSystemColors. This procedure’s control flow is represented in Hopper by a branching diagram:
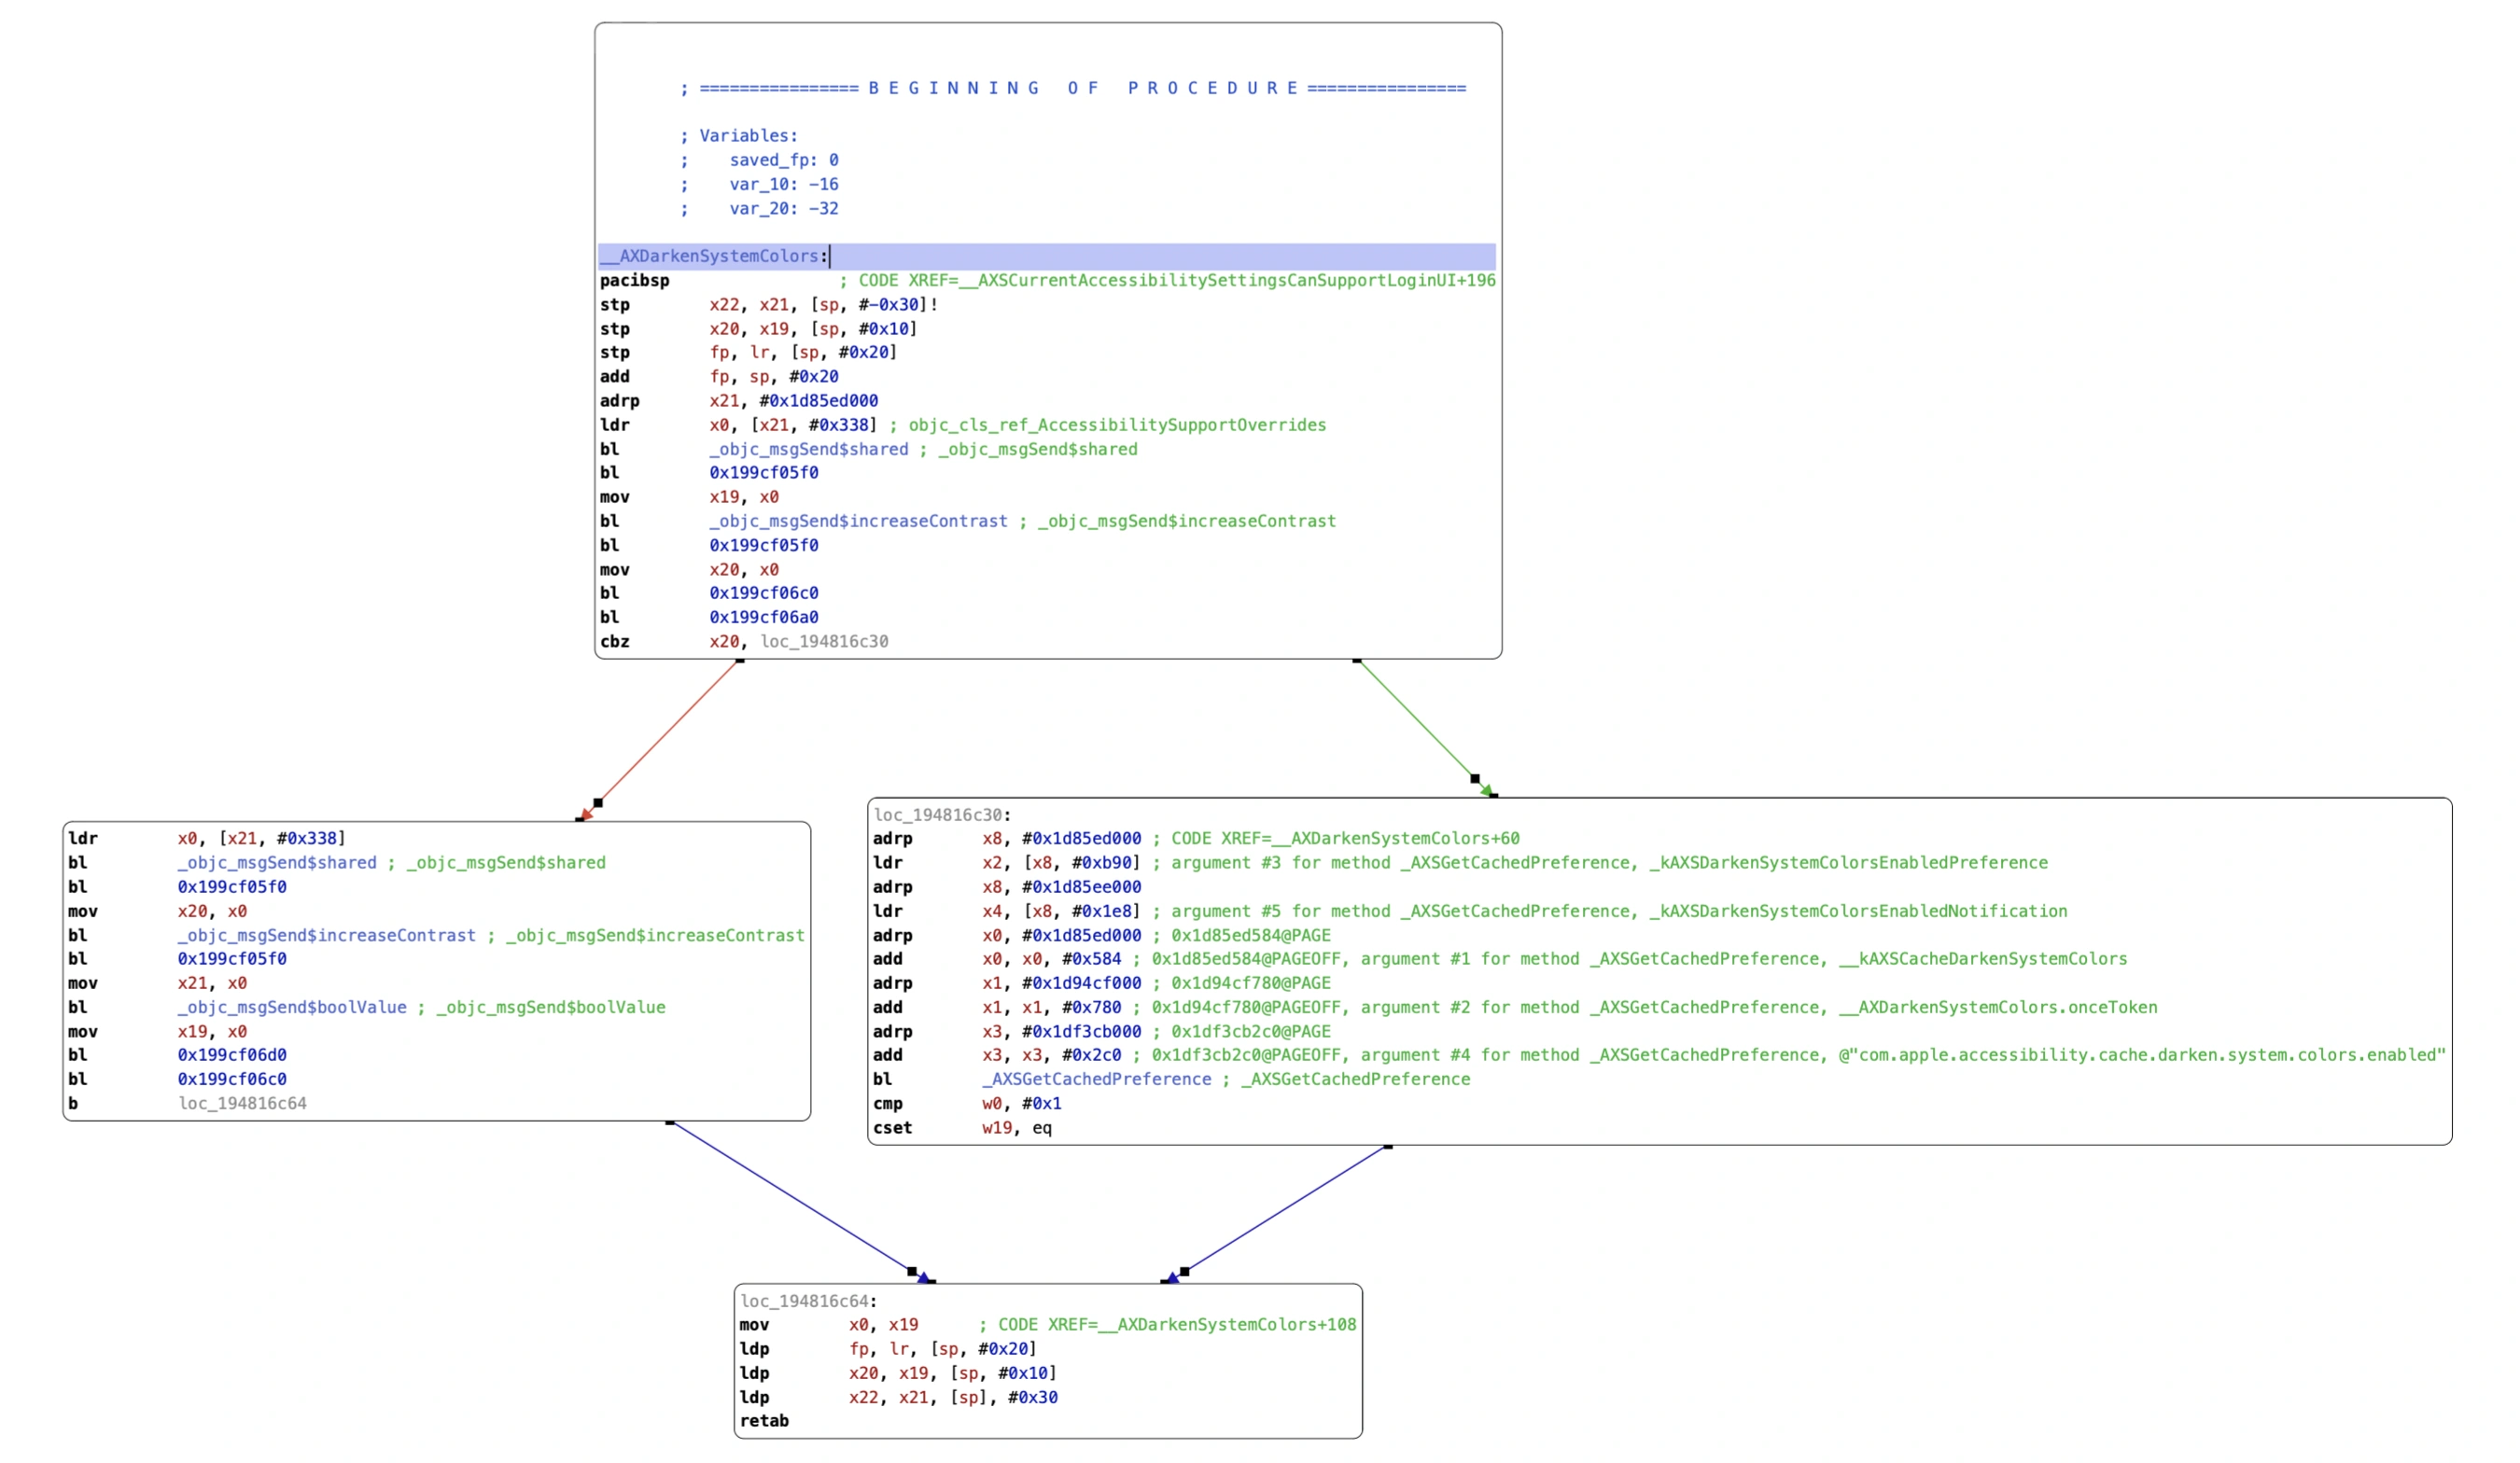
The assembly code for _AXDarkenSystemColors includes multiple bl (branch with link) instructions, such as bl _objc_msgSend$shared (shown by the red arrow) and bl _objc_msgSend$increaseContrast (shown by the green arrow). These instructions are essentially function calls to Objective-C runtime methods.
Remember those seemingly unusable memory addresses in the stack trace I displayed at the start of this article? Those addresses correlate to specific instructions in assembly code. By disassembling dylibs, we can identify the precise function calls related to such addresses. This enables us to map low-level assembly instructions back to their higher-level Objective-C or Swift method calls! In the case of _AXDarkenSystemColors, it makes calls to Objective-C methods for setting system color configurations. dylib files are far from being opaque blobs of compiled code; they contain crucial information for symbol mapping.
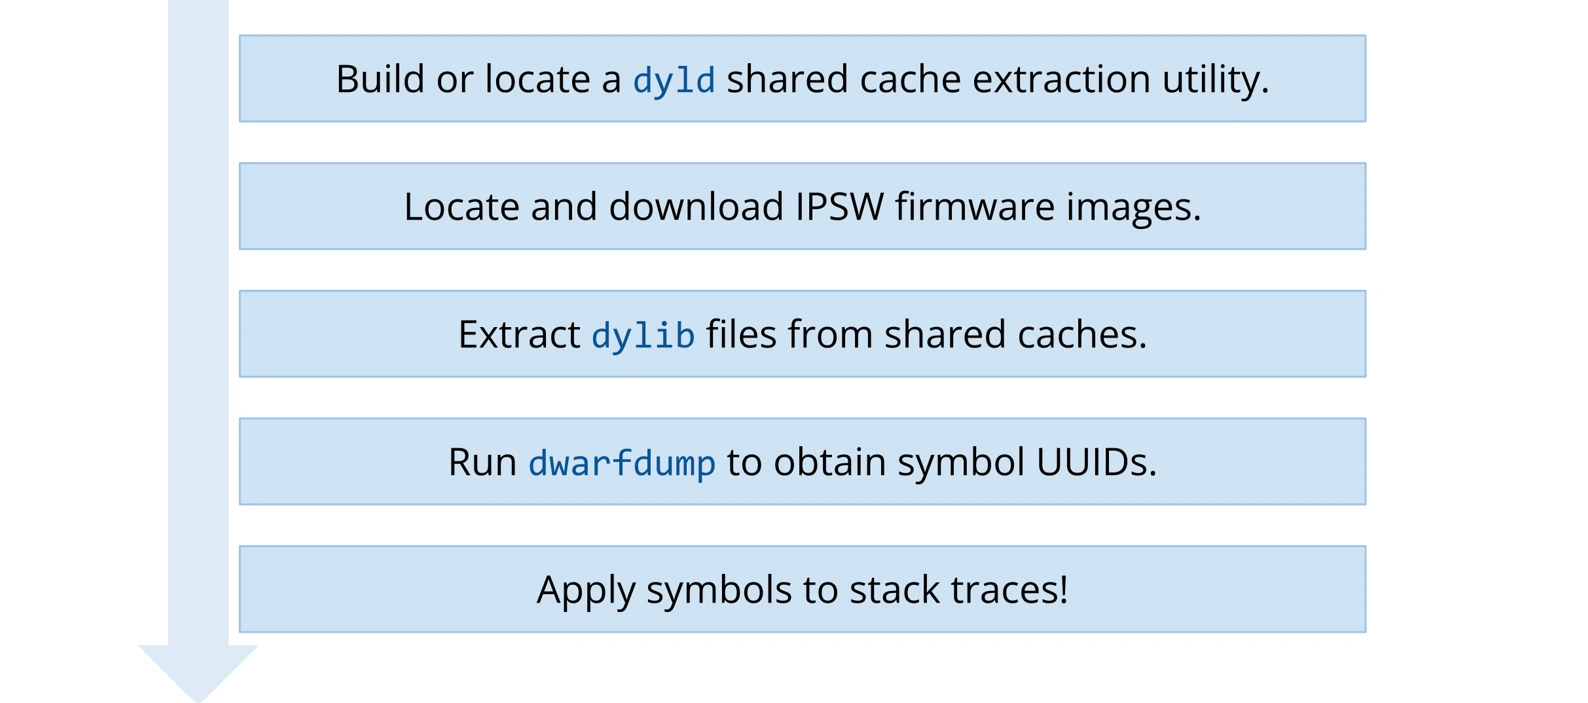
Alright, now how do we actually use dylib files for system library symbolication? The first step in the process is to understand what exactly we have in hand. For this, we can use the profoundly well-named dwarfdump command to obtain the UUIDs (unique identifiers) of dylib files. Every call in a stack trace will also include the UUID of its corresponding file. By matching these UUIDs, we can figure out which call might belong to which dylib file.

This is where the magic happens. When a Crash Reporting tool like Raygun receives an Apple crash report, we scan the stack trace for UUIDs and look them up in our symbol storage. When we find a match, we apply that symbol file to the stack trace. Generally speaking, this can be accomplished with utilities like the macOS atos utility. Raygun automatically provides this utility with any applicable dylib files, along with your dSYM files.
What does this mean for the developer?
The end result? Your stack trace goes from being an inscrutable list of memory addresses and offsets to a meaningful summary of what happened. This is invaluable for understanding the behavior of the application at the time of the crash.
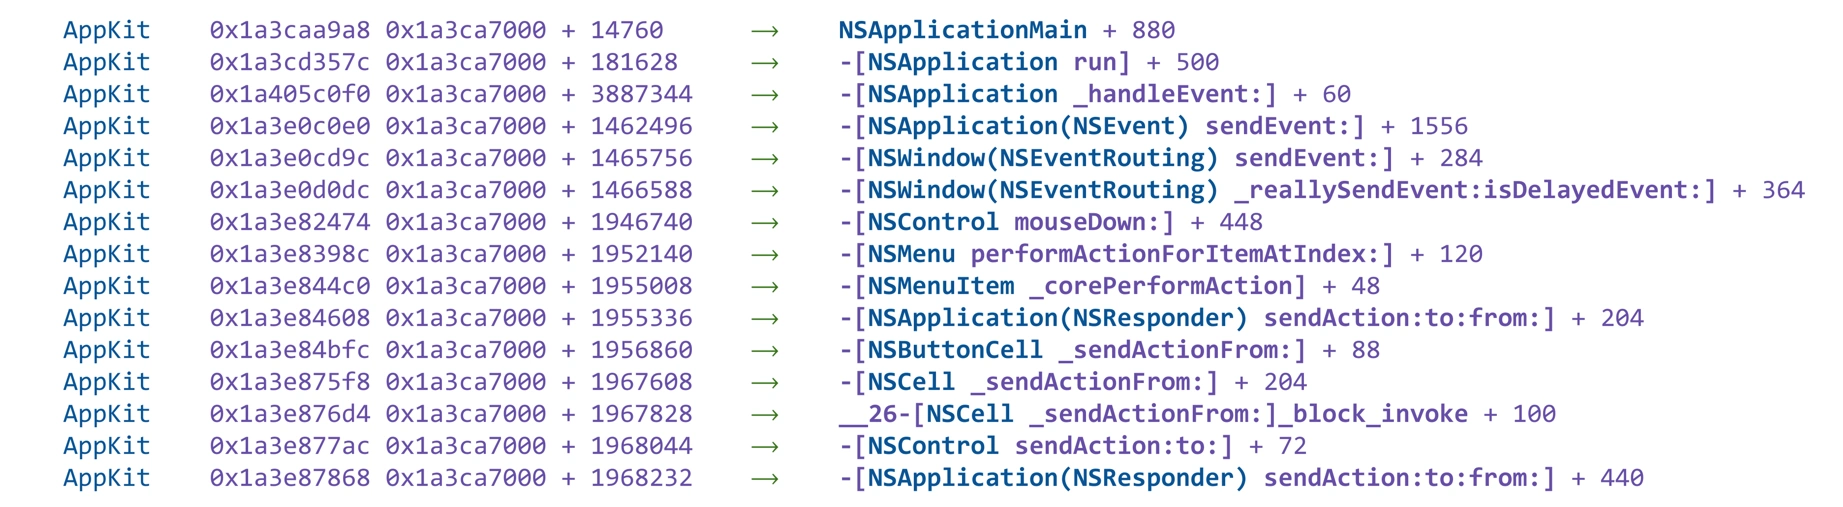
Let’s get back to that scenario I pitched at the beginning of this article. The beauty of the now-symbolicated stack trace above is that it reveals a story. All of the information that you need to figure out the issue is contained within the AppKit calls. What stands out is the line -[NSMenu performActionForItemAtIndex:], which indicates that an item in a menu—perhaps a dropdown menu—was acted upon. When coupled with the subsequent events of the “Submit” button being pressed, this sets off alarm bells in your head and becomes the focal point of your investigation.
You study it for a moment, and suddenly, it clicks: there’s a dropdown menu located just above the “Submit” button in your application! This dropdown menu influences certain parameters that the button relies on when activated. To probe further, you simulate rapid interactions with both the dropdown and the “Submit” button. You discover that if a user selects an option from the dropdown and then quickly clicks the “Submit” button, the application struggles to update the parameters in time. This race condition between the dropdown’s state change and the button’s action leads to the NSInternalInconsistencyException.
You’re now able to reproduce the bug consistently, fix it, and then test to confirm that it’s completely resolved. The symbolicated stack trace transformed what was once a mysterious crash into a clear sequence of events, leading to a precise diagnosis and solution.
That’s it! You now have all the tools you need to symbolicate stack traces from Apple system libraries. If you’re already using Crash Reporting, the good news is that Raygun is adding an internal automation for obtaining up-to-date system library symbols from Apple firmware images, meaning consistent symbolication of Apple system libraries in your stack traces. Pair this with Raygun Sidekick for automatically uploading your application’s dSYM files upon building it, and your stack traces will always provide maximum debugging value.
If you’d like to try out Raygun, you can grab a 14-day Crash Reporting trial for free. There’s no credit card required, and you’ll be able to see error data within minutes.