The hidden impact of cache locality on application performance
Posted Sep 18, 2023 | 19 min. (4013 words)Author & Affiliations
Dr. Panos Patros, CPEng
- Principal Engineer, Raygun, New Zealand
- Adjunct Professor in Computer Science, IBM Center of Advanced Studies-Atlantic, UNB, Canada
- Steering Committee Member, IT Engineers, Engineering New Zealand
My favorite technical experience from grad school was all the cool ways we were trying to squeeze every last bit of performance out of the IBM JVM (now called Eclipse OMR). The majority of such optimizations required an intricate understanding of how CPUs and memories look under the hood. But why is there such an impressive performance gain in padding objects with blank space to the closest multiple of 64 bytes and ensuring they always start at addresses that are exactly divisible with 64?
We’ll need a bit of background before being able to answer this.
As anyone with a passion for computing and software engineering knows, the quest for heightened performance is never-ending. Up until the dawn of the new millennium, we were enjoying rapid CPU clock-rate increases. The expectation was that applications would continue to double in speed with each generation. Moore’s law, proposed in 1965 predicted that transistor counts would continue to double every two years. However, the quirks of quantum mechanics derailed our straightforward approach of merely miniaturizing transistors. Once a diode narrows down to a mere few nanometers (with a handful of atoms acting as the barrier), electrons’ quantum leaps start to significantly bypass voltage barriers. This quantum behavior sets definite limits on our ability to extract performance from CPUs by simply miniaturizing or overclocking them.
So CPU architects started looking for alternative ways to sustain the momentum promised by Moore’s Law. Instead of shrinking the atomic gaps between input-output pathways, they introduced (massive) parallelism. Not only could multiple threads execute simultaneously on a CPU, but with hyperthreading, even a single core could manage multiple threads concurrently.
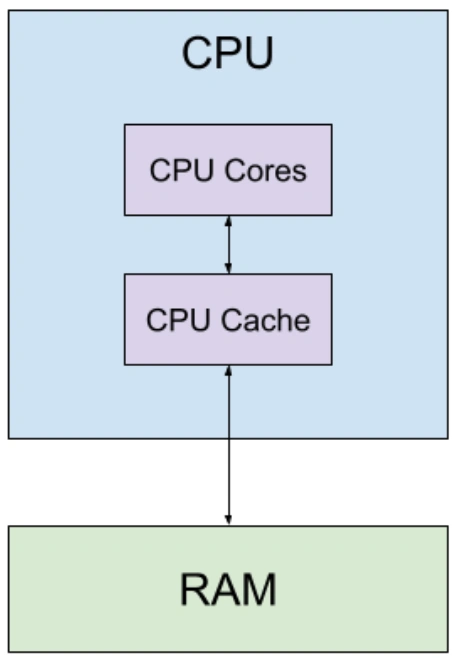
A simplified CPU architecture
There are always tradeoffs though, and this created a new bottleneck: the memory wall. While CPUs evolved at breakneck speeds, RAM lagged behind. Don’t quote me on this, but from the CPU’s perspective, RAM is roughly as fast as a dot-matrix printer. This causes CPUs to idle while waiting for new data to consume.
To address this, we adopted a smart workaround: minimize reliance on the snail-paced RAM by keeping essential data within arm’s reach, courtesy of small, nimble memory units called CPU caches. Paired with cache-aware software engineering design patterns, contemporary cutting-edge CPU cache algorithms can minimize RAM fetches while also enabling multiple CPUs to seamlessly share and edit data. This sidesteps any synchronization hurdles.
In this article, we’ll delve into the nuances of cache locality and the art of crafting software to harness the power of CPU caches, emphasizing their crucial role in application performance. We will uncover the brilliance behind contemporary CPU cache algorithms, prefetching mechanisms, and other strategies to sidestep the imposing memory wall, before wrapping up everything up with an actual cache-aware experiment we conducted on two CPUs. And by the end, we will be able to answer why 64-bit object alignment makes good sense!
The nerdy stuff!
My old students (and maybe myself too at some point) used to confuse Computer Organization and Computer Architecture, so let’s start by seeing how these two Computer Engineering concepts are different:
Computer Organization
Computer organization delves into how the CPU’s hardware components are interconnected and how they function. This deals with the operational units, their interconnections, and their functionality, and includes features that remain transparent to the programmer—things like control signals, interfaces between the computer and peripherals, and memory technology used. It is exactly because these features are transparent (i.e., not directly controlled by the engineer) that we should pay extra attention to them to maximize performance!
Computer Architecture
In contrast, computer architecture focuses on the design and specification of the computing system from the perspective of a programmer. It looks at concepts like instruction set architectures (ISAs), machine code, and fundamental logical structures.
Architecture defines what the system can do, while organization details how it achieves things. In Object-Oriented Programming terms, Computer Architecture is the Interface while Computer Organization is the Concrete Class. And because of this abstraction into machine code, computer architecture is normally the realm of compilers—unless a developer writes in x86, amd64 or arm32 directly of course!
Zooming into CPU Caches
The analogy we often draw is that the CPU cache is like your fridge at home, while the RAM is the distant supermarket. Think of the cache as a handy spot where the CPU stores a limited quantity of ‘food’ (or data) that it frequently needs—though this ‘food’ might sometimes go stale or expire. While the CPU can always make a trip all the way to the ‘supermarket’ (RAM) for a more extensive selection, this journey consumes time and energy—like the hassle of driving, fuel, and the dreaded traffic (or databus) jams.
The following CPU cache concepts could probably fill an entire undergrad course, so feel free to read up on these for further detail:
Cache Line
At the heart of a cache lies the cache line (or cache block). When data is fetched, it isn’t fetched in single bytes or words but in blocks called cache lines–pay attention here, this is crucial! So you can think of a CPU cache as a collection of cache blocks, each able to store one cache line’s worth of data.
Let’s work out an example. Many contemporary CPU organizations define the cache line size at 64 bytes. When you execute a command that makes a cache reference, say load 6432, which means read the word located at address 6,432 in the process’ virtual address space, the address will be first divided by the cache line. So:
6432 div 64 = 100
and
6432 mod 64 = 32
Which means that the word we want to read starts in the middle of cache line number 100. Assuming we are working on a 64-bit system, the word will be 8-bytes long. That means (and again pay attention here) the word we are reading is fully contained in the 100th cache line and we need only that one cache line fetched (or already in the cache) to perform that load operation.
Hierarchies
Modern systems employ a hierarchical approach to caching: L1, L2, L3, etc., with L1 being the smallest and fastest and L3 (or beyond) being larger and slower. This hierarchy trades off access speed against size to ensure that frequently accessed data stays close to the CPU. The CPU first looks up in the smallest and fastest L1 (which is actually two, one for data and one for instructions). If the data is not found, it moves on to L2, and so on, until it’s forced to fetch data from the RAM.
The Last-Level Cache (LLC) highlights the boundaries of the CPU cache before using the CPU databus to go to the RAM. Note that in CPU Organization lingo, “upwards” typically refers to moving closer to the CPU (i.e., from the LLC to L1); and “downwards” further away, from L1 to LLC. So a memory request starts from the CPU and goes downwards to the first cache that matches, while data travels upwards from the cache level it was found in (or the main memory) through all cache hierarchies until it reaches the CPU.
Associativity
A cache operates similarly to a hash map, with buckets being similar to cache blocks. Associativity determines how many locations in the cache (i.e., cache blocks) a cache line can end up. A cache can be direct-mapped (each memory location maps to exactly one cache spot), fully associative (data can be anywhere in the cache), or set-associative (a middle-ground approach). The tradeoff is that the direct mapping needs very little hardware design and is super fast, but conflicting cache lines can immediately evict each other. On the other end, full associativity maximizes cache utilization but requires more logic to be printed on the chip.
Prefetching
The CPU cache, apart from fetching a new cache line from the memory, can go a step further and try to predict the lines your application will soon need. Prefetching, predicting future data needs and preemptively loading this data even before it’s explicitly requested, helps in reducing cache misses. One common pattern is when a specific cache line is brought into the cache, its neighbors (spatially close in main memory) also come along. In our previous example, fetching cache line 100 might also prefetch lines 99 and 101, even if they are not needed (yet).
Eviction Policies
When a cache (or all associative cache block options) is full, and new data needs to be loaded, we need to determine which existing cache line to eject. Popular policies include Least Recently Used (LRU), First-In-First-Out (FIFO), and Random. The tradeoffs of cache utilization vs. circuit complexity still stand, so we avoid extremely complicated eviction policies. Contention for cache blocks doesn’t only come from references of your application though; your application (OS process in particular) is not the only one competing for CPU cache resources. Since all OS processes run concurrently, there’s heavy potential for reduced performance due to CPU cache interference.
Cache Hits, Misses, and References
We move now to events that are direct and measurable via hardware performance counters. When data is found in the cache, it’s a hit. If not, it’s a miss, leading to fetching from the main memory, which incurs a performance penalty. On the other hand, a cache reference is when a request is made to the cache. Even though every memory request will always result in an L1 cache reference, if a higher hierarchy cache (like L1) is unable to serve the CPU, the cache reference will propagate further downward. However, if any of these caches can satisfy the request, it won’t need to continue further. Hence, remember that the number of LLC references is generally far fewer than the number of CPU references. Going back to hardware counters, CPUs might count/expose references, misses, hits and other cache metrics per different cache level hierarchies, so we might be able to retrieve, say, L1-instruction misses and LLC references.
Cold Cache vs. Warm Cache
A cold cache is one that hasn’t been populated with data relevant to the current operations, leading to high miss rates initially. This can also happen when the relevant data gets evicted–either because the same process needed new, different data or another application running concurrently on the CPU interfered. As operations proceed and the cache gets populated, it “warms up,” increasing the hit rate. Keeping the cache warm is a core strategy to improve performance.
Coherence
Multicore systems add further complexity, leading to data races. Different cores could be making the same reference, which is okay if they just want to read it. But what happens if they also want to write it? In that case, local caches need to be recursively synchronized, potentially all the way up the main memory. Coherence ensures that all processors in a multi-processor system have a consistent view of memory.
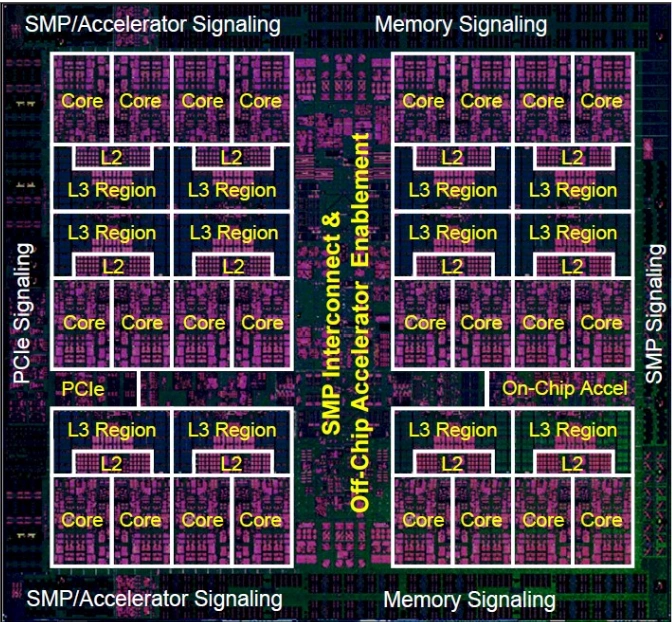
Looking at a common cache and core organization, we notice that a core might have its own L1 cache but a nearby group of cores might share L2, and an even broader group of cores might share L3, and so on. This approach can both help with increased cache utilization but also minimize the up-down cache traversal needed to maintain coherence, as long as execution threads that operate on the same data are also placed on nearby cores that use the same cache hierarchy.
True & False Sharing
What do we mean by core sharing the same data? Remember, that from a cache perspective, a reference is not a CPU word (8 bytes in a 64-bit system), but is equal to a cache line size (64 bytes commonly). So, coherence needs to be maintained across the cache line, not the actual reference the programs read and write.
This results in cache line synchronization being triggered for two reasons when two cores reference the same cache line: Either both cores look at the same word in the cache line (True Sharing) or at a different word in the same cache line (False Sharing). Both types exert equal pressure on the cache, but it does feel a bit painful to incur a slowdown for data you don’t even share! To avoid false sharing, you need to design your applications to consider thread locality.
NUMA and Cache Design
Extra complexity arises when in the hierarchy we add multiple main memories or RAMs, a feature used by datacenter servers. Non-Uniform Memory Access (NUMA) architectures do this by using multiple sockets for massively multicore chips and each of these sockets is also connected to its own RAM. Now, let’s say a thread operates on Socket 1 but it needs a memory reference from Socket 2. The second socket would need to interrupt its operations to fetch data for the thread in Socket 1. Imagine having to pay frequent cross-socket synchronization penalties because of False Sharing events because of lack of NUMA-awareness in your application. Ouch.
Cache and Memory Locality
Assuming that software engineers develop their applications using well-structured design patterns, programs tend to reuse data and instructions they’ve recently accessed (temporal locality) or access data elements that are close together in memory (spatial locality).
Let’s see how effective caching strategies exploit these tendencies. Your program is likely to maintain a contiguous memory space for its code. A CPU goes through a compulsive fetch-decode-execute cycle, where for each clock cycle, it fetches the next instruction from the main memory, decides what to do with it, and then runs it. This is where the instruction L1 cache comes into play. The CPU is guaranteed to always need the next instruction from the main memory, so let’s add a specialized cache just for memory that handles instructions. Instructions are normally fetched sequentially–assuming your application doesn’t perform frequent Goto statements to distant addresses–so a simple prefetch can minimize instruction misses.
Next, your program maintains a call stack that stores information about the current function executing and those that called it, as well as local variables and parameters. This info is also normally stored together and in a sequential order. Once again, a simple prefetching approach will do great!
Things become a bit more complicated, though, when you start using the heap. This happens when you allocate an object. The OS and even the language runtimes above it (if you’re in a high-level language, like Java, C#, or Node.js) will be doing their best to allocate your objects in contiguous areas. Language runtimes in particular will do their best to keep the cache warm when they run background tasks (e.g., garbage collection) to minimize impact on your application.
When multithreading comes into play, an engineer is likely to maintain high levels of isolation among the operational specifics of a thread and then periodically synchronize with other threads on common data. The hierarchy of caches combined with a smart thread allocation (usually by the OS) on the appropriate cores can maximize using L1 caches for each thread, while minimizing roundtrips to lower-level caches when synchronization is needed.
Plus, when we take into account multiprocessing, we now have multiple OS processes (applications) to manage. Some of those might be interrelated and part of a broader system, while others might be completely unrelated and even belong to different users or tenants. Smart thread allocation mechanisms and even thread pinning (restricting a process’ threads to only run on a predefined subset of available cores) can maximize cache utilization while minimizing sharing contention. For example, a tenant on a data center server could be assigned solely within a NUMA node.
Finally, let’s tackle the question posed in the introduction: “Why does padding objects with blank space to the closest multiple of 64 bytes, and ensuring they always start at addresses that are exactly divisible by 64, improve performance”?
Now we know that this optimization method can improve locality for small space tradeoffs. The contents of objects are likely to be accessed at the same time. By fitting them all together, in a single-cache line if possible, we are achieving good temporal locality. For longer objects, we achieve good spatial locality by storing the object in multiple sequential cache lines. And when multi-threading brings in the risk of cache invalidation due to maintaining coherence–potentially across NUMA nodes–by padding objects in separate cache lines, we avoid the worst-case scenario of false sharing.
Experiment (or, let’s thrash the cache!)
Let’s conduct an experiment to check some of these ideas. Being too lazy to do it myself anymore, I got ChatGPT (with a few back-and-forths and me doing some final editing) to write a Java application that creates and repeatedly accesses a buffer array. For each iteration, it increments the buffer’s contents with a random number. Crucially, we scan the contents with a variable stride length that loops back to the start of the buffer if it overflows. That way, we ensure exactly the same number of operations, regardless of the stride length.
import java.util.concurrent.ThreadLocalRandom;

public class Main {
    /**
     * Usage: bufferSizeKB strideLength repetitions
     * Recommended examples:
     * 1) Uses cache locality and prefetching to be fast: 512 1 16
     * 2) Breaks cache locality and prefetching to be slow: 512 129 16
     *
     * No2 is 2 x LLC-cache-line-size + 1 to also break prefetching, assuming line size = 64 bytes
     *
     * @param args
     */
    public static void main(String[] args) {
        try {
            final int bufferSizeKB = Integer.parseInt(args[0]);
            final int strideLength = Integer.parseInt(args[1]);
            final int repetitions = Integer.parseInt(args[2]);

            final byte[] buffer = new byte[bufferSizeKB * (1<<20)];

            performBufferScans(buffer, strideLength, repetitions);

        } catch (Throwable thr) {
            System.err.println("Usage: bufferSizeKB strideLength repetitions");
        }
    }

    private static void performBufferScans(byte[] buffer, int strideLength, int repetitions) {
        final long t0 = System.currentTimeMillis();
        for (int i = 0; i < repetitions; i++) {
            System.out.println("Running " + ( i + 1 ) + " out of " + repetitions + " repetitions");
            performBufferScan(buffer, strideLength);
        }
        final long t1 = System.currentTimeMillis();

        System.out.println("Execution time = " + (t1 - t0) + "ms");
    }

    private static void performBufferScan(byte[] buffer, int strideLength) {
        int position = 0;
        for (int i = 0; i < buffer.length; i++) {
            buffer[position] += ThreadLocalRandom.current().nextInt();

            position = (position + strideLength) % buffer.length;
        }
    }
}
At a glance, we wouldn’t expect any performance difference. However, due to cache locality effects, we actually do get significant slowdowns! To validate these hypotheses, we can use the Linux perf tool to collect CPU hardware metrics:
perf stat -e LLC-loads,LLC-load-misses,l2_lines_out.useless_hwpf,instructions,cycles java Main <buffer-size-kb> <stride-length> <repetitions>- LLC-loads: The number of memory references made at the Last Level Cache.
- LLC-load-misses: The number of LLC-loads not found in the cache and had to be fetched by the RAM
- L2_lines_out.useless_hwpf: The number of prefetched cache lines that were not used
- instructions: The number of CPU instructions executed
- cycles: The number of CPU cycles the application took
Results
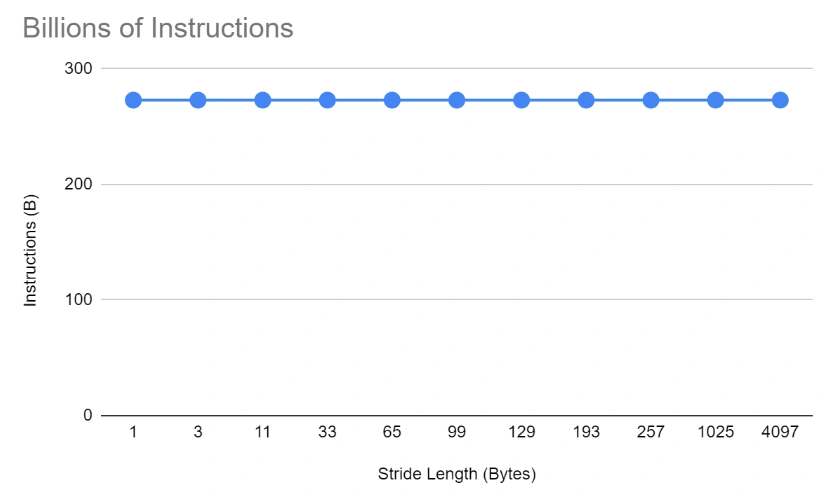
All stride lengths execute the same number of CPU instructions:
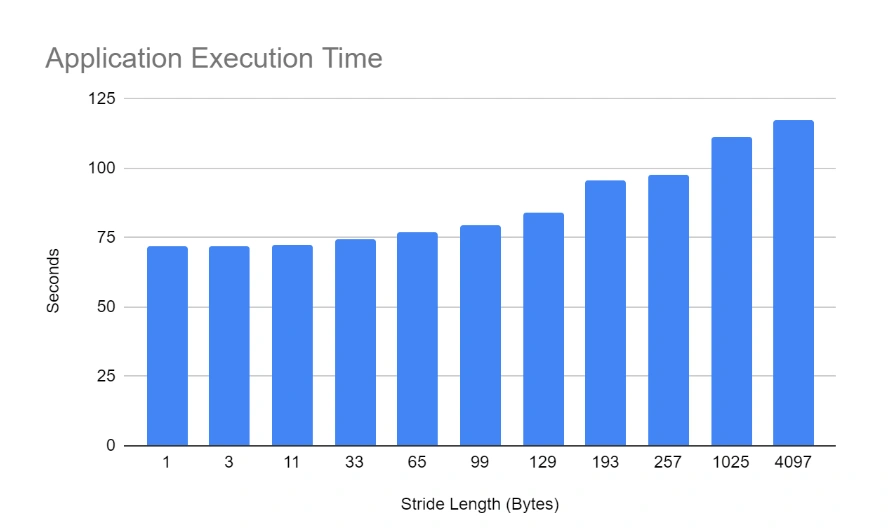
However, as the stride length increases, so does the application’s execution time:
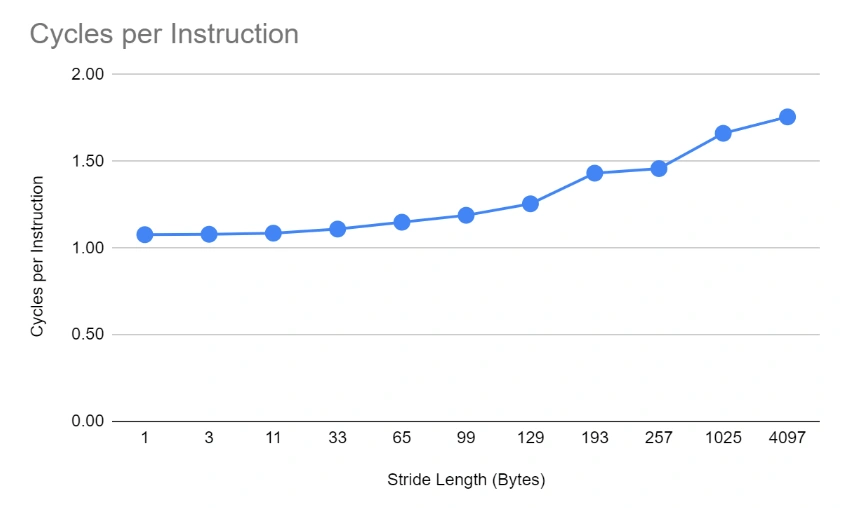
Looking at the effectiveness of the CPU, we can see that as the stride length increases, more and more cycles are required on average to execute an instruction.
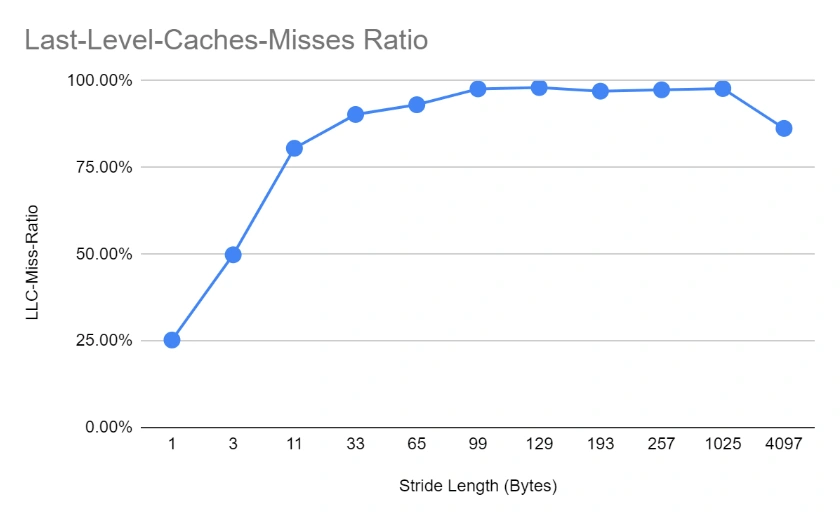
This is caused by decreased utilization of the CPU cache. We can see that the proportion of cache misses increases to virtually 100% by stride length of about 100, and remains more or less stable from that point on (even though performance still deteriorates). This is happening because the cache line size on the tested hardware is 64 bytes, hence the moment we cross that length, further nearby accesses will not benefit from being already loaded in the cache.
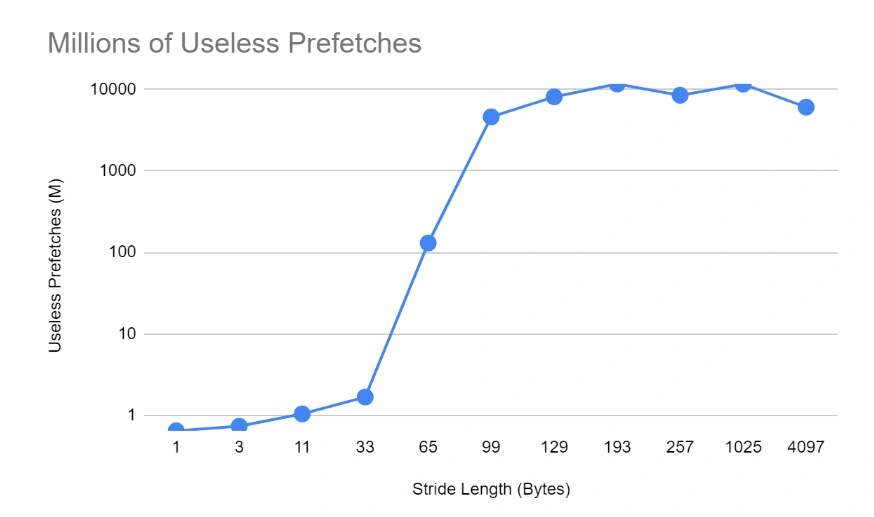
The biggest telltale of the cache line size is the effect of prefetching utilization. We can see a sharp increase in the number of prefetches that are never used (almost at 100%) the moment we cross to about twice the length of the cache line (which is 64 bytes long for this system). At that stage, bringing in the next cache line is not useful because the application just jumps over it!
Finally, we see the full picture of why there’s a further delay in higher strides by studying the raw numbers of LLC loads and misses. We can see that for low stride numbers, the number of LLC loads (and also misses) is very low. This is an indication that the inner cache layers (L1 and L2) are not getting overwhelmed and can contain the relevant references without bubbling them up to the LLC. However, as the stride length increases, the smaller L1 and L2 are quickly thrashed and they start relying on LLC, which for the most part doesn’t contain the references requested (it is possible, due to the 16 repetitions, that a reference might be present from the previous iteration and not evicted yet) and has to fetch them from the RAM, resulting in significant slowdowns.
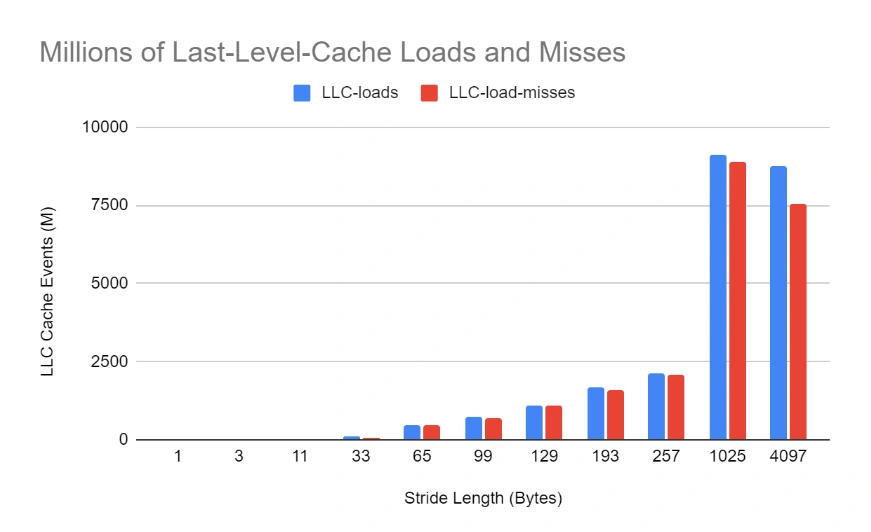
A final observation concerns the dip in cache metrics for the 4097 case, even though the execution time is still higher. It’s likely that because the stride length is so large, the scanning of the buffer loops back quickly, so more items are likely to be found in the last level cache–in other words, the cache stays warm. However, the inner caches (L1 and L2) are completely circumvented, which results in a bigger slowdown.
Remember when we discussed how CPU references are not equal to cache references? Well, as LLC cache references start to approach the actual number of CPU references, the cache gets more and more practically removed from the system. Eventually, it’s almost as if it doesn’t exist and the CPU fetches data directly from the RAM.
Validation Mini Experiment
To further test our observations, we can do a simple comparison between two CPUs, a newer and an older one.
You might be thinking, what is there to test? A new CPU will just do better, right? Well, yes—but remember earlier on when we said newer CPUs are no longer clocked faster? In order for the new CPU to actually be faster, it uses other tricks, like smarter cache designs/algorithms and denser parallelism.
In this test, we executed the Java buffer application from above on an Intel iCore i5 and an Intel Core i7. I used the same stride lengths as before.
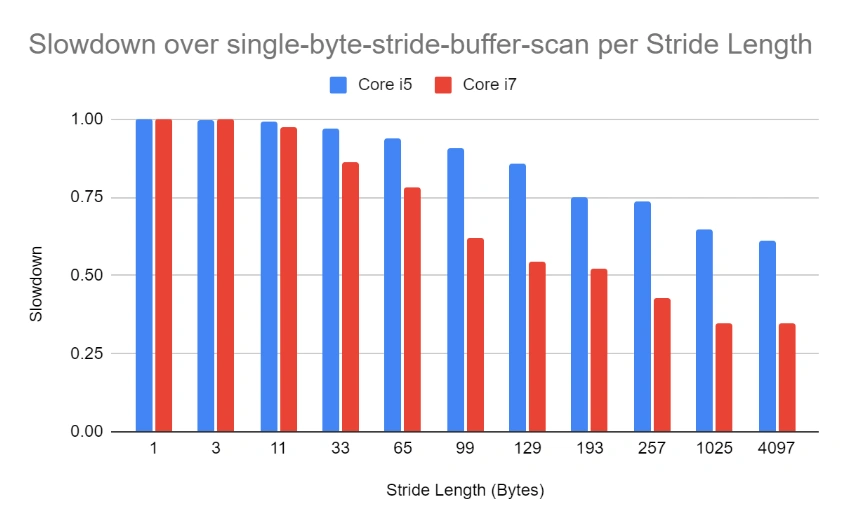
Comparing performance between the older and newer CPUs, slowdowns are way more dramatic for the newer CPU. So, our cache-thrashing attack has somehow confounded the Intel Core i7 more than its predecessor.
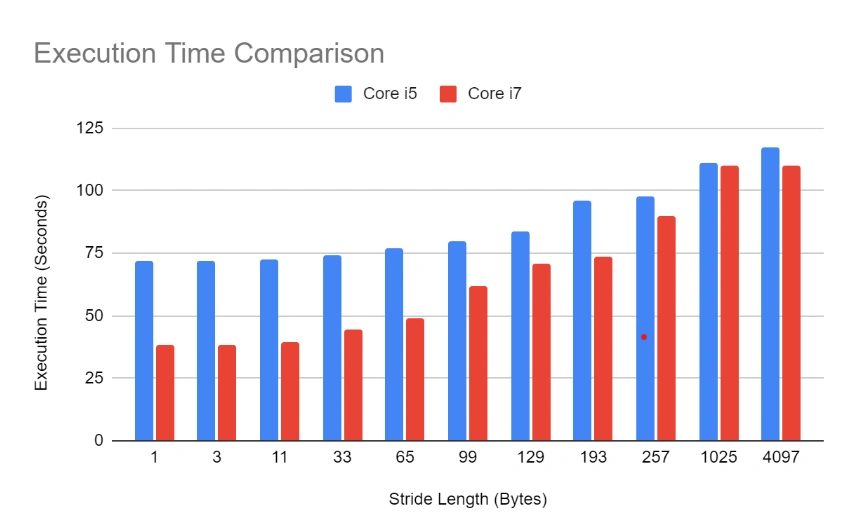
Let’s look at the actual execution times now. Core i7 starts very strong with low stride lengths, which represent expected, good software development patterns. However, Core i7’s advantage disappears as the cache is thrashed and they even reach rough equality at 1025 stride length! So, because this is a single-threaded application (and doesn’t even allocate objects that would trigger garbage collection), much of the performance difference must be due to advanced cache designs!
From our simple experiment, then, we can infer that Intel achieved a speedup of roughly 2x between Core i5 and Core i7 just by developing more advanced cache algorithms—as long as you write your application in a cache-aware way, of course.
Final thoughts
I hope you enjoyed this window into computer and software performance engineering! Look for more write-ups from the Raygun team about performance and how things work - this type of knowledge is critical to our work at Raygun, with performance as the entire purpose of the tools we build. For instance, my team has done wonders over the last year for our Application Performance Monitoring product, reducing CPU overheads threefold. The goal is that a customer should measure the performance of their software and not the overhead of their monitoring tools.
Check out previous posts from the team:
Using a possibility tree for fast string parsing
Why every developer needs to learn about source maps (right now)
If you’d like to see for yourself the results of our efforts, you can try Raygun error and performance monitoring free for 14 days!