Best practices for tracing and debugging microservices
Posted Jul 21, 2023 | 9 min. (1752 words)Tracing and debugging microservices is one of the biggest challenges this popular software development architecture comes with — probably the most difficult one.
Due to the distributed architecture, it’s not as straightforward as debugging traditional monolithic applications. Instead of using direct debugging methods, you’ll need to rely on logging and monitoring tools, coding practices, specific databases, and other indirect solutions to successfully debug microservices.
In this article, we’ll look into the main differences between microservices and monoliths, see why it is harder to debug microservices, then go through nine best practices that can help you with setting up a proper debugging workflow for your microservices application.
In this post:
- How are microservices different from monolithic applications?
- Debugging microservices vs monoliths
- Best practices for debugging microservices
- 1. Implement microservices logging
- 2. Complement logging with crash reporting
- 3. Generate a unique ID for each request to trace microservices
- 4. Prepare each microservice for accepting and storing request IDs
- 5. Create and implement your own logging patterns
- 6. Use a logging framework
- 7. Store all your logs in a single database
- 8. Consider time-series databases (TSDBs)
- 9. Use an application performance monitoring tool
- How can debugging microservices be made easier?
How are microservices different from monolithic applications?
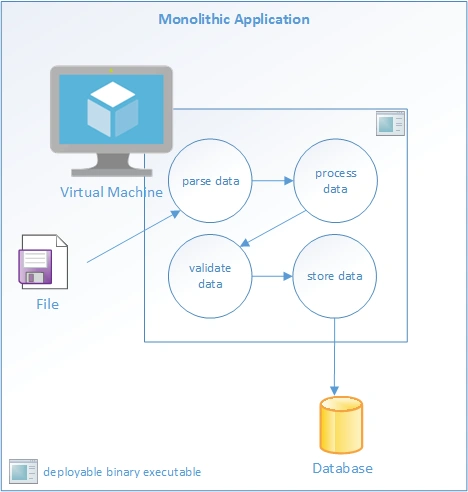
Traditionally, applications have been developed as “monoliths.” This term describes how application code is compiled and delivered.
Monoliths are compiled and/or packaged into a single binary or a bundle of code, then deployed as a single unit. That single unit contains hundreds, sometimes thousands of lines of code. The functionality packed into that deployable artifact is most, if not all, of the functions of the application.
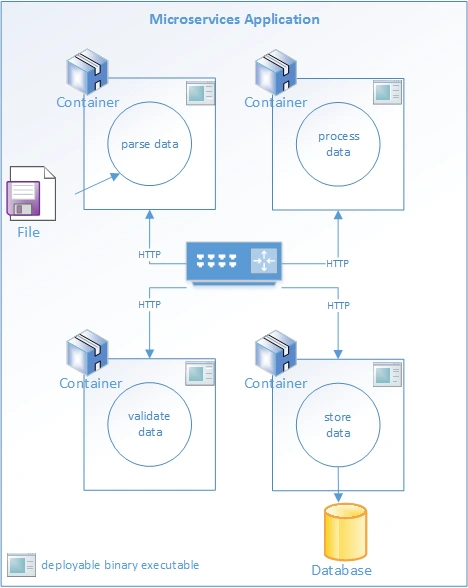
In the era of modern web development, this method of software delivery has been challenged by the microservices architecture. Microservices contrast with monoliths in that each microservice is tightly “bounded.” It performs one essential function of an application, and nothing more. All interactions with microservices are governed by the contract it exposes, in the form of an API. The most common form of this is a small collection of REST-supporting endpoints.
Debugging microservices vs monoliths
The operational differences between monoliths and microservices become more evident when it comes to troubleshooting a failure. Monoliths are convenient because all the code is bundled together. It’s easy to track a request to the code through its entire lifecycle. This might start with a button on a web page and move through a “stack” of functions that lead to a database query. Everything the debugger and logging systems need to gather and report on application behavior is concentrated in a single deployable.
Microservices are not conveniently bundled. They’re distributed by design. Each microservice is deployed independently. Requests may flow through many microservices as they pass data back and forth from client to server. Debugging a problem, such as malformed data and exceptions, or performance issues such as slow response times, is a more complex task when working with a microservices application.
Best practices for debugging microservices
How does a team split a monolith into a set of microservices, without losing the ability to respond to operational problems? Let’s find out.
1. Implement microservices logging
The term “debugging” creates specific associations in the minds of developers. If you’re most comfortable in an IDE such as Visual Studio, Eclipse, or another platform, you likely have images of breakpoints and stack traces running through your head. This interactive form of debugging is extremely useful in dev environments.
Extreme situations may call for remote debuggers in other environments, perhaps even production. However, this is the exception and not the rule. Attaching remote debuggers requires additional configuration and sometimes elevated privileges. As a result, remote debugging is not necessarily the most efficient way to track down problems. Debugging modern distributed applications is best accomplished with effective microservices logging. This is a reactive method of debugging that provides visibility into the behavior of an application. As logging is the best way to debug microservices, proper logging practices are the first place to start improving your ability to debug. Your developers can’t debug behavior they can’t see. Lean towards “too much information” when logging. Disk space is cheap, and your logs can roll every thirty days or so. Don’t be shy about recording everything your services do.
In addition to debugging errors, you can also use logging to optimize your microservices application for performance — to learn more, check out some performance-focused Java debugging practices.
2. Complement logging with Crash Reporting
Logging is most effective when paired with a Crash Reporting tool, which will surface the exact line of code where the error occurred, making the debugging process much faster.
Every function of every microservice must be instrumented. It’s not enough to just log errors in a catch block. You’ll want informational logging of the entry and exit points of functions so you can measure the time they take to execute. Each log should include enough context to understand where it is coming from, including the name of the function, and the name of the user, where applicable.
3. Generate a unique ID for each request to trace microservices
Each microservice will have its own set of logs. Requests are passed, “hot-potato” style, from one service to the next. A single button click on a web page may result in a cascade of requests flowing through several microservices. But how do you track that request through all those services? The simplest solution is to generate a unique “correlation” ID that will follow all requests. There are several ways to implement this solution. For example, an “edge” service that initiates interactions with all internal microservices can generate the ID. Alternatively, microservices can generate the ID on any call that does not have an ID.
4. Prepare each microservice for accepting and storing request IDs
All your microservices must have the ability to accept the ID and include it in their logging. This will tie the requests together, no matter how many “hops” there are between services. The ID will then be included in all logs that correlate to that request. Searching the combined logs for an ID should return all the calls related to that request. The context of an ID is up to you. It can be anything; a user-generated action, a scheduled job, or a call to a public API.
5. Create and implement your own logging patterns
If you’re not logging much, or at all, that is your starting point. Your team’s ability to debug will depend on the completeness of your logs.
Past outages are an excellent source of guidance for how and what to log. Use incident postmortems to ask: “What data did we need to detect this outage? How can we include that in standardized logging?” Use as many incident reports as possible to develop generalized logging patterns. Apply your new logging patterns to your development practices. Review them regularly, and discuss them in code reviews.
Enforce basic logging patterns by including static code checks in your continuous integration pipeline. Code quality analyzers can be configured to look for missing logging code. Testing your code for logging patterns can prevent un-logged functions from being deployed.
6. Use a logging framework
One of the best ways to standardize your approach to logging is to use a framework. Logging frameworks are among the oldest and most common open-source software, so finding a few to pick from isn’t tricky. Every popular language and framework has at least one, usually two or more logging frameworks targeting them. Here are some examples:
The “right” one for you will depend on your requirements. Key considerations include:
- Code cleanliness – Is the logging code easy to read?
- Performance – Does the logging cause request latency or other performance problems?
- Familiarity – Does your team already have experience with a particular framework?
Work with your developers to rate these and any other considerations you can think of by impact. Use that priority to create a shortlist of frameworks that may work. If two are ranked close together, try a bake-off. Develop a spike using both frameworks and run some performance tests.
7. Store all your logs in a single database
Searching multiple files and databases for logs is difficult. Where possible, your logs should all go to a single database. Most popular logging frameworks support redirection of logging to a database or an HTTP endpoint. Keeping all logging data in a single location will greatly simplify the task of debugging and tracing. Logs can be stored in files and relational databases. Many of the logging frameworks support both.
8. Consider time-series databases (TSDBs)
Specialized databases called time-series databases (TSDB) are better suited to gathering telemetry. Log data is used to capture events. Logs, once recorded, are never modified. TSDBs are optimized for data that is only ever added and arrives in chronological order. Logging application events is a core use case for time-series databases. There are several open-source TSDBs available, including Prometheus and Kibana (the “K” in the classic ELK stack).
Some TSDBs include web-based data visualization tools that can be used to query logs. Alternatively, Grafana is a dedicated visualization tool that works with most TSDBs. The best combination of TSDB and supporting tools will depend on the operational requirements of the TSDB and the capabilities requirements for debugging and tracing your microservices applications.
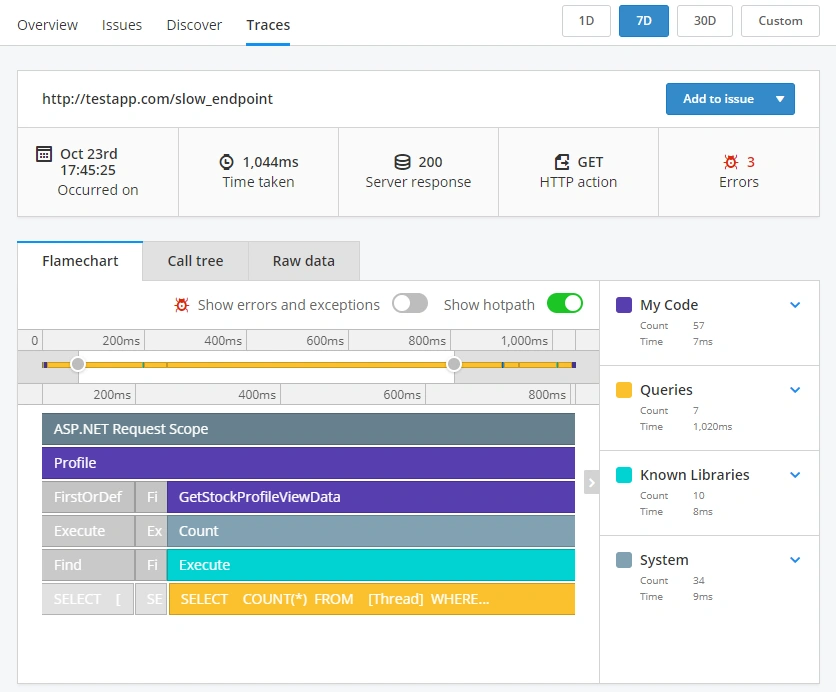
9. Use an Application Performance Monitoring tool
Application Performance Monitoring (APM) tools such as Raygun APM will surface performance problems in microservice environments using a lightweight agent. They can take debugging and monitoring microservices to the next level. In the following screenshot, you can see a slow trace causing a problem, then Raygun showing detailed diagnostics:
How can debugging microservices be made easier?
The microservices architecture comes with major advantages and greater complexity. Debugging and tracing microservices is different from debugging monoliths, and must be approached differently. Microservices architecture distributes the sources of logging across many individual services, rather than just one, so ultimately, good logs are the best source of data to troubleshoot, debug, and trace microservices.
Create robust, standardized logging practices in your development teams. Use code reviews and code quality tools to enforce those standards. Open-source and commercial databases and tools round out a complete strategy for keeping your microservices healthy and your systems running.
Wondering how you can monitor microservices for performance problems? Raygun APM is designed with modern development practices in mind. See how the Raygun platform can help keep your Microservices architecture performant.