Monitoring microservices: Everything you need to know
Posted Feb 24, 2023 | 10 min. (2094 words)This article first appeared on [The New Stack](rel=canonical https://thenewstack.io/the-hows-whys-and-whats-of-monitoring-microservices/).
Monitoring remains a critical part of managing any IT system, while the challenges associated with monitoring microservices are especially unique. An example is how traditional monolithic systems, deployed as a single executable or library, have different points of failure and dependencies than those deployed with a microservices architecture.
Diagnose errors and performance problems right down to the line of code with Raygun.
It’s important to understand monitoring in general and how it is different for microservices applications. Microservices-based applications have different, and more intensive, monitoring requirements. The business logic applied to a process, such as a loan application, for example, is distributed between many separate services. In this way, tracking an application through the process requires correlating data from all these different services.
Some essential concepts relating to the hows and whys of microservices include:
-
How is monitoring microservices different from monitoring monolithic applications?
-
What tools are available for publishing, gathering and storing monitoring data?
Why monitor your microservices?
Applications developed using microservice architecture need to be monitored for the same reasons as any other type of distributed system: that is, all systems eventually fail.
Failure is the most obvious reason why monitoring is important, but it’s not the only one. System performance is not binary; systems are not just “up” or “down.” Complex systems, even monoliths, can operate in a degraded state that impacts performance. These degraded states often herald imminent failures. Monitoring the behavior of systems can alert operators to degraded states before total failures occur.
Services provided internally, or to external clients, are often provided under a Service Level Agreement. Without monitoring, it’s impossible to know whether the SLA is being honored, or violated, for example.
Monitoring systems over time produces valuable data that can be used to improve service performance. Failure and performance data can be analyzed to look for patterns in system failures, which can be correlated with events. For example, consider a case where data indicates 25 percent of total system failures occur within an hour of a new deployment. This would thus be a strong indicator that deployment processes need attention and improvement.
Given the importance it plays in IT operations, application performance monitoring (APM) is a market unto itself. Gartner publishes a Magic Quadrant (MQ) report for APM tools, for example. There are also many open source and commercial software tools available, such as Raygun’s APM platform. These tools are used to publish, gather and store metrics data.
The storage tier is specifically designed to handle time-series data.
Error monitoring is a narrower field of performance monitoring. It is mainly geared for gathering data about handled and unhandled exceptions. With Raygun Error Monitoring, exception traces and reports are reported and recorded to the same stream of events as other logging data is.
These systems are indispensable as resources for maintaining resilient and available systems. Development teams can use the data to understand how their applications run “in the wild.” Operations teams can gather large amounts of data for forensic and analytical purposes. The alerting features of application performance monitoring (APM) tools can sift through that data in real-time, filtering out all but the most critically important events. Those important events can be raised as alerts through dashboards, email, Slack and mobile applications.
Microservices are not the same as monoliths
Monitoring an application based on a microservice architecture is qualitatively different from monitoring a monolithic application. Monolithic applications are typically deployed as a single executable or binary library.
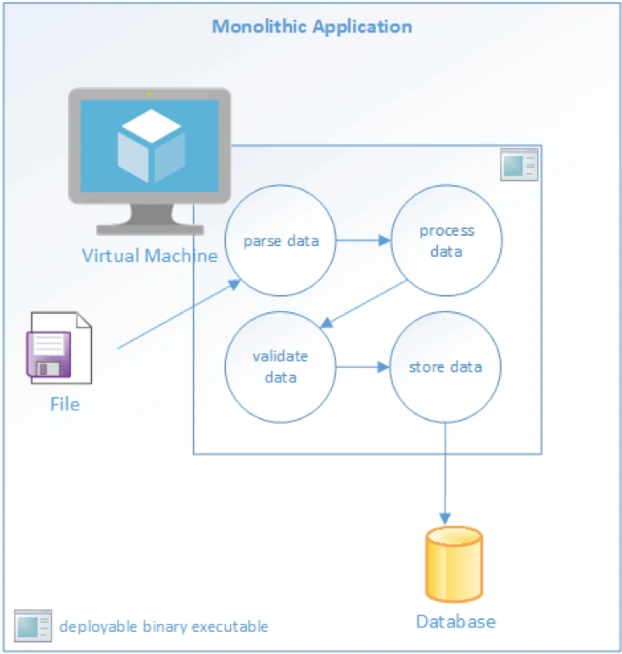
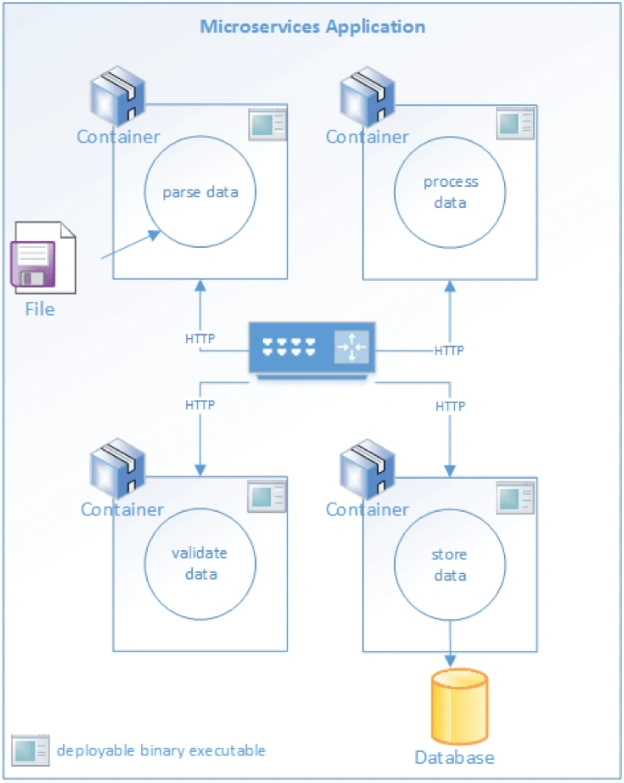
Monolithic Application Architecture Microservices applications are deployed as a family of independent services. Each service has a specific function to perform, and must communicate with other services to complete a “unit of work.” In a microservice architecture, complex workflows are orchestrated through a series of microservices. Each service may communicate with dependencies. This may be a disk, a database or other services. Every interaction between a service and a dependent resource is a potential point of failure.
Failure of a dependency, or even just degraded performance, will result in upstream effects on overall throughput. It’s important to detect these problems early on to prevent systemic degradation or failure.
A robust microservices architecture takes these facts into account and addresses them, in both development and operational contexts. Development teams can incorporate instrumentation into systems at design time as they write applications that report their behavior at a granular level. Operations teams must build and support infrastructure to gather data reported by applications and platforms. The data gathered and stored by those platforms is used for short-term, emergency scenarios such as alerts. Longer-term uses include data mining and analytics as a way to look for patterns. Those patterns can be analyzed to find and prevent common failure modes.
Monitoring Microservices: What to measure
Monitoring is a process of reporting, gathering and storing data. The first question to ask is, which data are useful. Large distributed systems process huge amounts of data every day, potentially generating gigabytes of new metadata about their behavior in a short time.
How does one find the signal amid the noise? Each application will have unique needs relating to monitoring. There are a few common metrics you’ll want to record. They include:
Application metrics
These metrics relate specifically to your application. If your application accepts user registrations, a standard metric might be how many were successfully completed in the last hour. A tax-preparation system might record context-specific events such as form validation. These top-level data are useful for development teams and the organization to understand the functional behavior of the system. If peak-volume form validation typically occurs 1,000 times an hour, and suddenly that throughput drops to 500 over the last two hours, that anomaly could be an indication of a problem.
Platform metrics
These metrics report on the nuts and bolts of your infrastructure. Examples include:
-
The overall average execution time of each of the top ten most frequently executed database queries
-
The average execution time of the fastest 10 percent
-
The average execution time of the slowest 10 percent
-
The number of requests per minute a service receives
-
The average response time for each service endpoint
-
The success/failure ratio for each service
Collectively, these metrics provide a dashboard that can be used to understand low-level system performance and behavior. Ideally, these metrics will alert you to degraded performance that is likely to affect overall throughput — or lead to a system-wide failure. It’s important to use low-level data in this way to predict and prevent broader failures before they occur.
System events
Outside forces act on systems all the time. The most common, and potentially the most disruptive, are new deployments. Operations staff knows there is a strong correlation between new code deployments and system failures. Given that reality, it makes good sense to include a log of those deployments in the time-series data that is recorded by applications, along with the rest of the metrics. Scaling events, configuration updates and other operational changes are also relevant and should be recorded. Recording these events will also make it possible to correlate them with system behavior.
Microservice monitoring best practices
The “how” of monitoring for microservices applications is not very different from any other distributed system, although there are some unique requirements. We can look to the Twelve-Factor App method for some guidance.
The Twelve-Factor methodology involves treating logs as event streams. The recommended architectural pattern calls for loose coupling between applications and logging concerns.
In his description of a 12-Factor app, Adam Wiggins writes:
“A twelve-factor app never concerns itself with routing or storage of its output stream. It should not attempt to write to or manage logfiles. Instead, each running process writes its event stream, unbuffered, to ‘stdout.’ During local development, the developer will view this stream in the foreground of their terminal to observe the app’s behavior.”
This pattern decouples the concerns of producing log data from gathering and storing the data. Operations teams are free to solve the gather-and-store problems independently of the design of the application. This is one approach among several; some development teams prefer to use instrumentation techniques other than “stdout,” such as instrumentation libraries, to do this. The correct choice is dependent on the application architecture in question.
Gathering data from applications and platforms is a passive form of monitoring. We can use “health checks” as a proactive method to regularly test a service.
A simple health check might only return a fixed value. While this does not prove the service is completely functional, it is a fast and efficient method to confirm basic functionality. If the service is fundamentally misconfigured, it will probably fail a simple health check test. Health checks can be scheduled to test services on a regular basis and report their status on a dashboard.
Health checks can be more sophisticated than just returning a fixed string. End-to-end checks can test the interaction between a service and dependent, downstream services. These types of checks can test more thoroughly by executing some of the logic used to process “real” work.
Operations teams can set up continuous integration and deployment pipelines with one or more health checks as the final post-deployment step. If the health check fails, the deployment system can raise an alert and, if desired, roll back the deployment. Health checks are especially useful for microservices applications because there are typically more independently operated services than monolithic applications are.
Microservices monitoring tools
Monitoring technology and tools come in two broad categories: libraries and platforms. Some tools include both, providing a platform for collection and a library to instrument code.
Libraries are incorporated into an application during its development. Most popular language frameworks, such as Java, .NET, Go and others; include resources for writing to data streams over a network. These resources can be used for logging and monitoring. Paid and open source third-party libraries are also available to enhance metrics reporting. Examples include open-source libraries like AppMetrics for .NET and SPF4J for Java.
Monitoring platforms focus largely on the gathering and analysis of the data that is collected from applications and operating system and network platforms on which they run. Here are a few examples of tools that can be part of a microservices monitoring platform:
-
Raygun APM: Raygun’s APM platform is another example of a complete system that provides both instrumentation and collector processes, as well as a dashboard to visualize metrics data. Raygun APM supports .NET, Ruby, and Node.js.
-
Zipkin: Zipkin is an open-source tracing system designed specifically to trace calls between microservices. It is especially useful for analyzing latency problems. Zipkin includes both instrumentation libraries and the collector processes that gather and store tracing data.
-
Apache Kafka: Kafka is a streams-processing system. It uses a “publish/subscribe” methodology for reading and writing data to a logical “stream,” which is similar in concept to a messaging system such as RabbitMQ. Kafka can be combined with other tools such as Zipkin to provide a robust solution for transmitting and storing metrics data.
-
Grafana: The data gathered by all these tools isn’t very useful unless it can be interpreted and analyzed. To this end, Grafana is a web-based visualization tool that is used to build visual dashboards.
-
Prometheus: Prometheus is an open source monitoring solution originally developed by SoundCloud. It is widely used to store and query “time-series data,” which is data that describes actions over time. Prometheus is often combined with other tools, especially Grafana, to visualize the time series data and to provide dashboards.
Conclusion
Monitoring requirements should be considered from the very beginning of an application’s lifecycle. Systems monitoring requires contributions from both development and operations. It’s a critical part of the operational support of any distributed system. Microservice architectures are even more distributed than a typical monolithic application. They require more real-time attention and proactive monitoring.
It’s just as important to collect relevant data as it is to analyze the data that is collected. Applications should be instrumented by developers to report application-specific events.
Operations teams must gather data not just from applications, but from the supporting platforms and deployment systems. Open source and paid solutions are available to support both publication and storage of monitoring events. This data is critical to support a distributed system that is resilient, reliable and available.
That’s where an APM tool can help significantly. Try Raygun free for 14 days.