How to build 3 powerful APM workflows with Raygun
Posted Nov 12, 2020 | 7 min. (1282 words)From investigating slow performance to digging into inefficient API calls, there are many ways we can approach improving application performance on any given day. Raygun gives developers actionable metrics on performance bottlenecks so you can prioritize your day to day workflow around creating better customer experiences.
While there are many ways to use application performance monitoring, if you’re just starting, we’ve created this guide to help you, as a developer, to implement and roll out APM.
By the end of this article, you’ll have a powerful new APM workflow at each stage of your SDLC that will help you detect, diagnose, and resolve performance problems down to the line of code.
This guide is best paired with our workflow guide in the documentation which provides additional technical details.
Quick links:
- Step one: Using Raygun in your development environment
- Step two: Using Raygun in your testing environment
- Step three: Using Raygun in your production environment
This guide assumes that you are set up with Raygun APM and have already sent data using our Getting Started Guide.
Step 1: Using Raygun APM in your development environment to detect problems early
In our experience, the best way to familiarize yourself with APM is to start checking traces in Raygun throughout your day. A great way to get started with that is to incorporate APM into your development environment. Whether you are working on a new feature or making an improvement to an existing area of your application, checking traces regularly helps you identify unexpected behavior quickly.
You’ll want to build your workflow to be flexible so you can check in periodically. Here are some ideas to get you started:
-
Include a trace in your pull requests so you can compare it to a trace in production where you’ve improved a request, query, or method. Raygun helps you to inspect individual traces.
-
Prioritize the issues occurring the most by sorting the issues list by trace count. Pick the top issues in production from the list to include fixes for in your next sprint.
-
Understand how long database queries and external APIs take by reviewing N+1 queries or time-consuming methods.
-
Identify unwanted method capture in the output and use code filtering to remove this from view for future captures.
A real-world example of a notification
In this example below, our Slack channel notifies us that we have an N+1 query. We can click through to Raygun to see what the query is and where it is happening. Then we make sure the problem is not overlooked by assigning someone to it and posting in the Slack channel.
This APM workflow ensures that I’m quickly notified of any issues as I’m building my project. When the issues are resolved, the Slack channel will update to reflect that, and they can be resolved in both Jira and GitHub.
Try it yourself now
-
Set up a Dev application in Raygun. There’s no limit to the number of applications you have, so set up a Dev application per developer or per team.
-
Set up a Slack integration for your Dev application to post into a special channel or to send you a direct message.
Step 2: Using Raygun APM in your test environment to spot problems before production
We strongly recommend running load tests in your test environment to spot performance problems before they reach production. Troubleshooting in test environments is one of the core ways Raygun customers can make quick wins with APM. When your code is ready and deployed to the test environment, try the following workflow ideas:
-
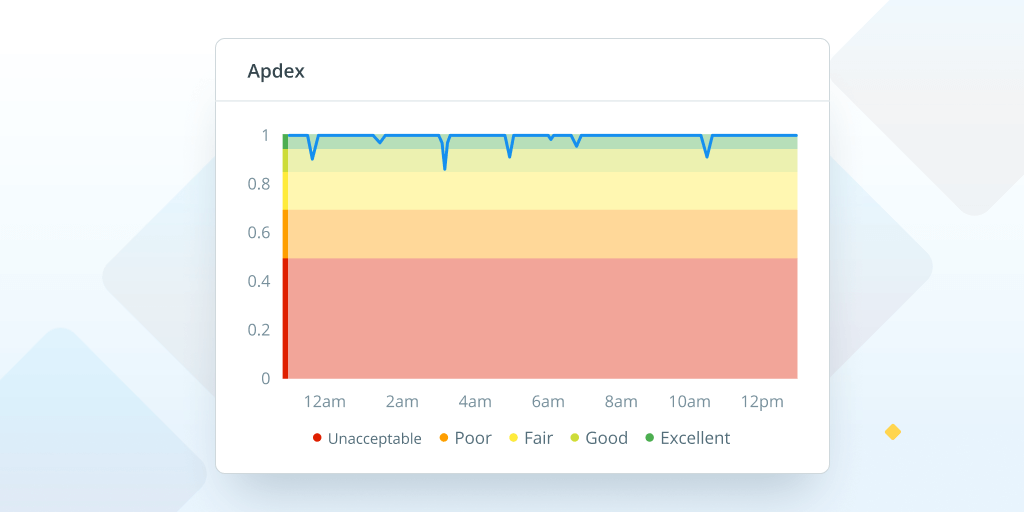
Assess the performance of the build relative to production measures using Apdex scores and request execution speeds to assess the performance of the build relative to production measures.
-
Use Raygun APM to check slow queries, methods and other issues found on the issues tab in the UI or reported in the Slack channel.
With Real User Monitoring (RUM) enabled, you’ll get an extra layer of insight into how your changes will affect the front-end experience for your users when you deploy to production. You can read more about how RUM and APM work together in this blog post.
A real-world example of a slow method in a test environment:
Here, we’ve spotted a spike on the Overview charts, and zoomed in to get a closer look. Then, we check the Discover page to see that we have a very slow method — we can address that so we don’t have any surprises in production.
Try it yourself today
- Create an additional Raygun application for your test environment.
- Copy the code filtering settings from your dev application to this new application.
- Set up the Slack integration so you’ll be notified of issues.
3. Using Raygun APM in production to discover problems affecting customers
Production problems are complex, and it’s not easy to discover performance bottlenecks. Raygun APM makes it easier to dive deeper into issues. If things go wrong, you’ll easily be able to find the exact line of code, function, database, or API call.
Try the following workflow ideas to help you get the most from Raygun in production.
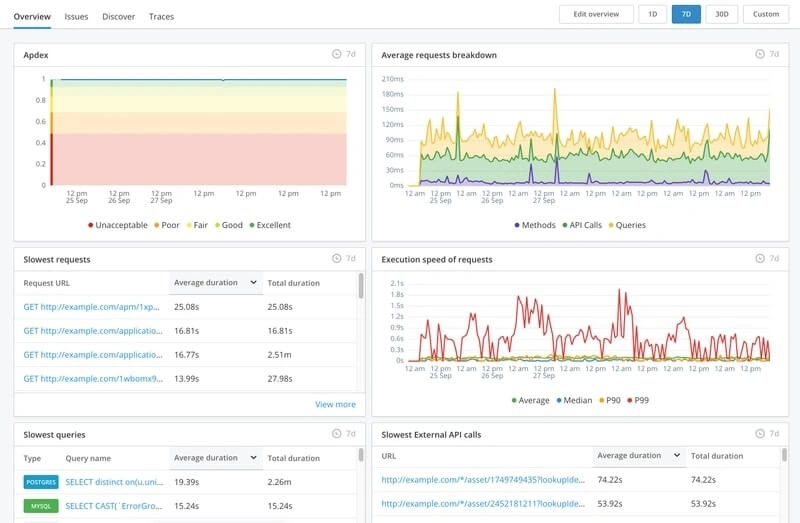
- It’s time to make the most of Raygun’s powerful dashboard functionality. Use customizable tiles to build a helpful dashboard where you can track page execution speeds and database call times for any changes.
-
Review the Discover section to identify slow running pages, queries, and external calls. Raygun APM is designed to be actionable. Raygun is designed so you can quickly take action on your application’s slowest and most popular requests, methods, queries and API calls. Check the discover page regularly to identify slow transactions that could benefit from a performance fine-tuning.
-
Raygun APM proactively curates a list of your application’s biggest performance issues and displays them for you on the issues page. Triage and resolve issues, or, mark any issues you don’t care about as permanently ignored. This workflow will reduce noise and remove them from your day to day view.
-
Are you working on a specific performance issue? While high-level dashboards allow you to spot a trend quickly, you’ll need the finer-grained metrics from Raygun’s flame chart for specific issues. Identify the trace associated with the request, then review the flame chart to understand what went wrong.
-
Gain code-level details with the GitHub integration connected to APM traces to issues in your GitHub account so you can move between tools in just one click. In the example in the next heading, you can see just how powerful this integration is.
A real-world example, detecting an N+1 query
In the example below, we’re viewing a trace that has some query issues. We zoom in on the flamechart to get a closer look at the problem, then use the GitHub integration to see that we’re executing our query in a loop! Now that we know the line of code where that happens, we can optimize that part of our application.
Try it yourself
- Create a Production dashboard with the key metrics you want to observe.
With Raygun, answers about slow areas of your application are never more than a few clicks away. Using Raygun’s capabilities at each stage of the SDLC, you can build APM workflows to help your team debug issues faster and deliver better customer experiences. There are many other use cases for Raygun APM, so start your journey today with some of the ideas outlined in this article.
Ready for more advanced setup? Check out our advanced guide in the documentation.
Raygun APM is available for .NET, .NET Core, Azure App Services, Ruby, with Node.js on the way soon. If you’re not already using Raygun to monitor your application performance, you can get started with a free 14-day trial here.