What is Real User Monitoring? Definitions, examples and benefits
Posted May 26, 2018 | 9 min. (1811 words)It sucks to spend a long time building an app then get complaints about slow loading pages. You don’t know which pages the problems occur on, let alone the environment. So, software performance problems stay elusive, and linger on in your app, causing havoc for end users and your bottom line.
Real User Monitoring (RUM), surfaces performance problems and their cause in real time. Using a small piece of code, RUM anonymously collects data on your end user via their browser, then surfaces information like slow load times and performance bottlenecks in a central dashboard.
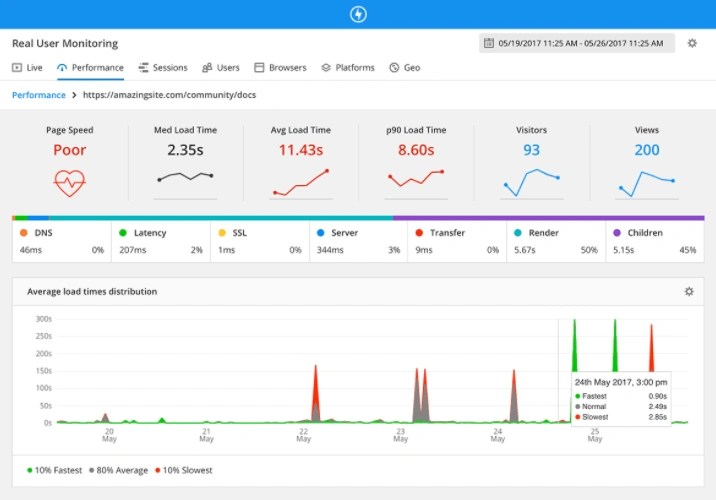
In this article, we’ll take a look at how Real User Monitoring can help decipher performance problems with real-world examples.
Synthetic Monitoring vs. Real User Monitoring
Let’s start with a common comparison. Synthetic monitoring, (also known as synthetic testing) creates synthetic interactions with your website to predict performance and monitor uptime. Because it uses scripts to predict behavior, it can’t account for the complex ways users navigate your apps—it will only test for what you ask it to.
Real User Monitoring, on the other hand, takes data from how real users are experiencing your app. RUM is a passive form of monitoring and sits in the background constantly analyzing how your application is performing for end users.
Real User Monitoring vs. Google Analytics
A common question about RUM is “Can’t I just use Google Analytics to find slow loading pages?”
Yes, you can, but Google Analytics (GA) isn’t a competitor to RUM, and you’ll need to run both as part of your monitoring and analytics strategy. The main difference is that GA looks at where site visitors came from, and how effective marketing channels are in terms of traffic. RUM, on the other hand, is designed specifically for development teams to identify and solve problems within their control, for example, which assets are slowest.
A few more differences are:
- Google Analytics uses sampled data for reporting purposes, which can show different results for large datasets
- No code-level performance view. You can see that there is a slow loading page, but Google Analytics doesn’t tell you why
- Google Analytics can’t give you any user identifiable information, unlike RUM, which allows you to reach out to frustrated users easily
Although both include browser, platform, and device data, RUM should be the choice for your development team.
How Real User Monitoring collects performance data
RUM collects data via a small piece of code embedded on each page. The code sends information directly from a user’s browser. As the user explores your website or mobile app, the code collects the information, which is sent back to a centralized dashboard.
There is usually no performance overhead, as there is no agent, and data is collected both non-blocking and asynchronously.
Here’s a rundown of how most RUM tools collect data from Alistair Croll and Sean Power and their book Complete Web Monitoring, published by O’Reilly.
The data collection process
- Capture: The monitoring system captures page and object hits from several sources—JavaScript on a browser, a passive network tap, a load balancer, or a server and its log files.
- Sessionization: The system takes data about these hits and reassembles it into a record of the pages and components of individual visits, along with timing information.
- Problem detection: Objects, pages, and visits are examined for interesting occurrences—errors, periods of slowness, problems with navigation, and so on.
- Individual visit reporting: You can review individual visits re-created from captured data. Some solutions replay the screens as the visitors saw them; others just present a summary.
- Reporting and segmentation: You can look at aggregate data, such as the availability of a particular page or the performance on a specific browser.
- Alerting: Any urgent issues detected by the system may trigger alerting mechanisms.
Good presentation and customization of data is arguably the most important feature of a RUM tool, so the tool you choose needs to do the heavy lifting when presenting the data.
Who is Real User Monitoring for?
One of the main benefits of Real User Monitoring is having one source of information across multiple departments and job roles.
Front-end Developers
As a front-end developer, you spend most of your time in the thick of the code-base. You are all about code quality, and how performance issues are affecting end users. When it comes to page performance, the performance issue is usually the most time-consuming task. RUM gives you an easy way to see individual resources causing issues, fix issues across multiple pages, improve performance and prioritize fixes.
Product Managers
If you are a Product Manager, you are responsible for ensuring your products are meeting the requirements set out in the roadmap. You don’t need the deep code-level knowledge, but you do need to discover high-value pages that perform poorly. The dashboard in a RUM tool will be most important to you. Monitor trends over time, too, to help make data-driven decisions on resource allocation.
Technical Leaders
RUM helps a Technical Lead assess the health of an application at a glance. There’s no need to interrupt your development team and ask them to manually crawl your website for issues. Prioritize the worst pages in your backlog so you get peace of mind that users are having a great experience.
The wider benefits of Real User Monitoring
-
Full visibility into software performance: Instead of manually crawling pages, RUM passively monitors code-level performance.
-
Pinpoint the reason pages are slow: Take a deeper dive into what is causing the slow page so issues can be addressed quickly.
-
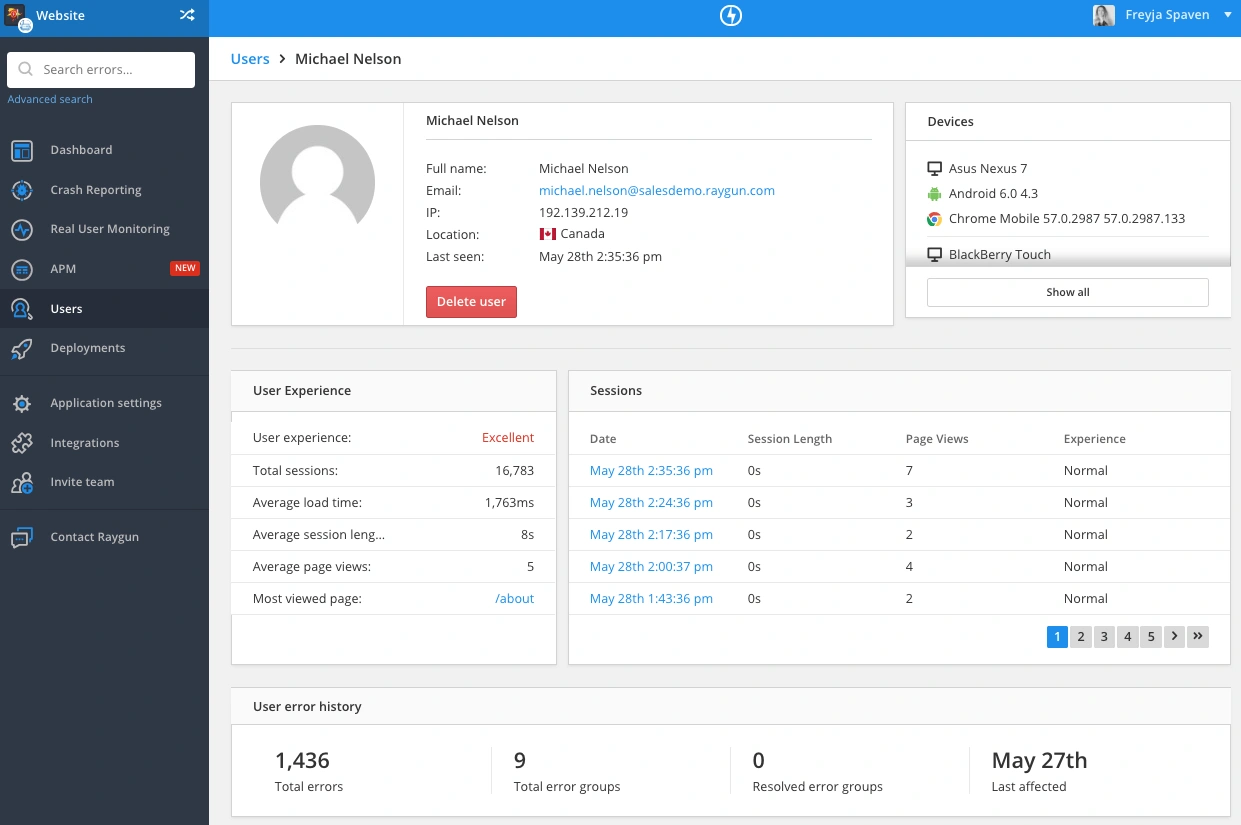
Track high-value customers and their experiences: RUM collects all the session information from users as they navigate your application.
-
Reduces cost to acquire customers: Focus efforts on providing excellent software experiences, reducing the risk of churn.
-
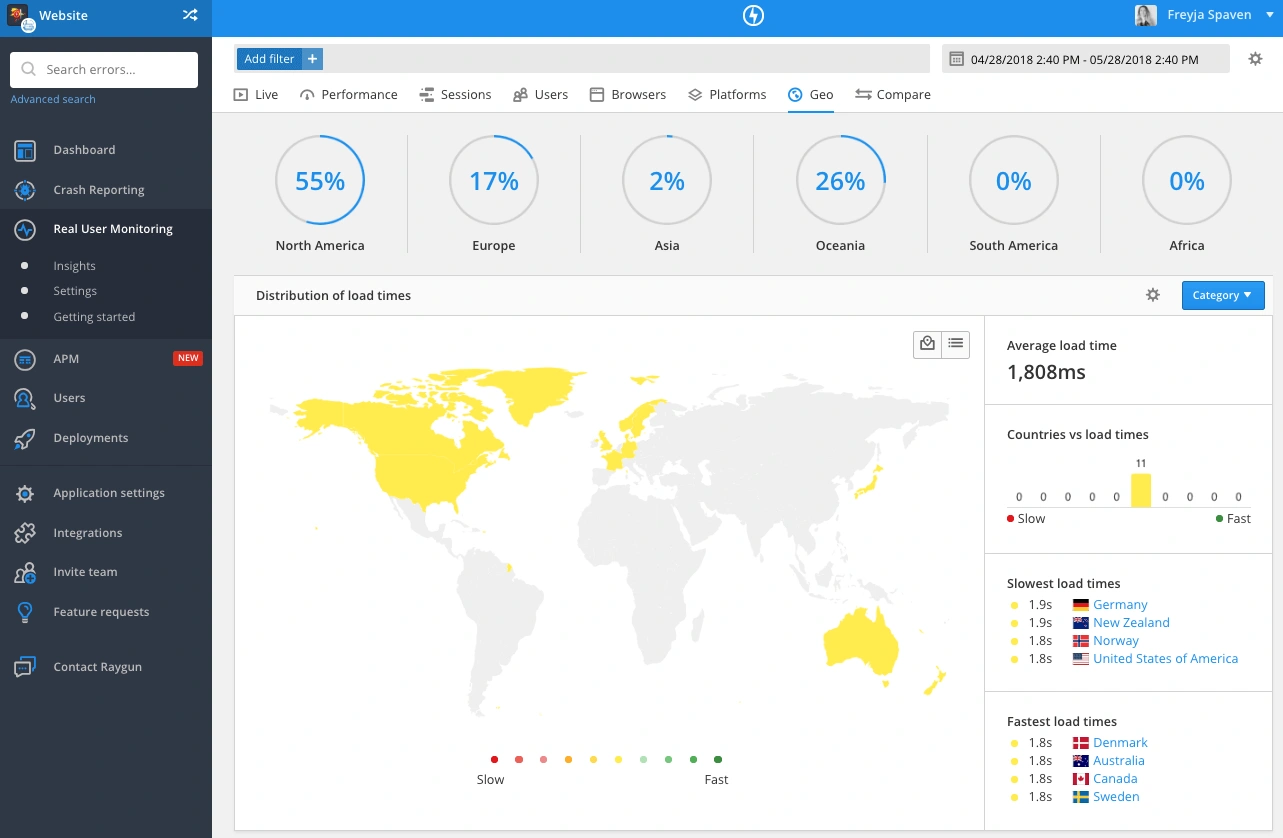
One of the best ways to understand load times in different locations: Visualize geo data on heatmaps to better understand your user’s locations and page performance.
-
Data visualizations on web and mobile performance: Make decisions quickly and tell stories from your data faster.
Limitations of Real User Monitoring
For all it’s benefits, RUM does have some limitations:
- RUM is useful in pre-production environments, just not many people may have the traffic here to get useful information. This is where synthetic testing can help
- RUM can’t track server performance or server level API calls. Rather, RUM tracks users where they are interacting with your application. Many teams use a real user monitoring tool alongside an Application Performance Management tool for this reason.
How Real User Monitoring saved our customers 75 hours per month
Here at Raygun, we also leverage our own tools to make our product better. When we reviewed our website performance using RUM, we noticed that the XDReceiever calls were not very fast. The reason was that the connection limits to the same domain were saturated, and no caching occurred on the response.
After checking why, it was because the file was being called a lot—which makes sense as every page load in the web app needs to call the API to fetch data.
Because Real User Monitoring collects all the timing data from every request and gives the average amount of time plus the total call count, we could see that even though the call wasn’t expensive, it was called a lot:
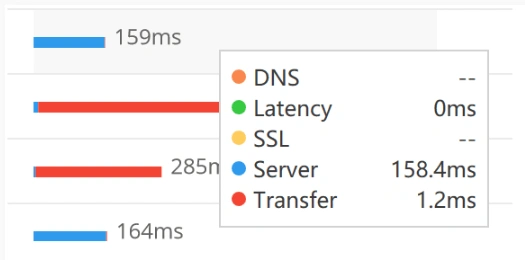
When we multiplied how often it was happening with the amount of time it took to load, it stacked up to a staggering 75 hours of time spent every month just to set up for the cross-domain calls!
Turns out we added this code to support IE9. We cleaned the code, removed support and saved our customers 75 hours per month.
6 Essential Features of Real User Monitoring
For any monitoring tool to be useful in a development team, the huge amount of data should be presented in a way that the whole team can digest. The data must be both actionable and customizable to your needs.
So with those criteria in mind, let’s look at the features a RUM tool must have for developers to improve their web and mobile performance.
Detailed page-by-page session tracking
Are users getting stuck, and was the problem a third party script or a software error? As RUM tracks individual users, you’ll also be able to see a user’s journey through the application and see where they got stuck. Your development team should be able to isolate the problem from here so no-one else runs into the same issues.
Performance data for every asset, web, and mobile view
Real User Monitoring offers performance timings for every page of your application, with a full waterfall view of assets. This is important data but made even more powerful as it is from the specific user sessions of customers interacting with your application.
Integration with crash and error data
Because each user gets their own user profile, RUM can record a full history of crashes and errors that user experienced. With Raygun’s Real user monitoring integrated with crash reporting, you can cross reference user experience with crash reporting data.
Customizable dashboards
What does UX success look like in your team? Performance monitoring may look very different across job roles. High-level charts don’t help developers, while code-snippets are useless for product managers. A RUM tool should present data in an easy-to-digest way but also provide the diagnostic details you need to fix an issue. Customizable dashboards are a great way to do this.
Filtering
If your development team knows there’s a problem with a certain browser caused by a deployment, you can save a tremendous amount of time with a filtering system. Raygun, for example, has filters for:
- Anonymous user
- Browser and browser version
- Country code
- Device
- Operating system
- Tags
- URL
- Version
- Data comparison
Performance success is different for every development team, so customizing data is also an important feature of a RUM tool. Analysing and comparing performance data like browser, country, device, operating system, and version helps developers understand how these dimensions affect performance.
Country, state, and city geodata
For example, is your target market large shipping companies in Asia, specifically China? If so, you’d need to make sure anyone accessing your website from large coastal cities in the Asia Pacific region is having an optimal experience. Real User Monitoring will surface performance data and correlate it to a city so you can prioritize your target market, and spend your resources where they matter.
What’s the future of Real User Monitoring tools?
All monitoring tools must provide details on your end users and give actionable data to help you improve customer experience.
Raygun’s Software Intelligence Platform, for example, uses RUM data, Crash Reporting and Application Performance Monitoring (APM) to make discovering and resolving issues easy. Raygun then presents this in data dashboards. You can see exactly who the problem affected, what caused the problem, how many users this problem affected, then all the details you need to fix it.