What is Application Performance Monitoring?
Posted Feb 2, 2018 | 8 min. (1686 words)If a whole server becomes unresponsive, you need to know what kind of web activity caused it, and quickly. Application Performance Monitoring, or APM, gives you this visibility, and more.
APM tools monitor and manage user experiences in software applications. Unlike crash reporting, which manages the detailed information on errors, APM tools surface problems on the server side of your app.
It’s harder than ever to get visibility into the everyday workings of an application, which is why APM tools are an essential part of a development workflow.
Discover and pinpoint the root cause of performance issues
What is Application Performance Monitoring (APM)?
There are many tools on the market designed to better understand the nuts and bolts of your application performance and usage.
Confusingly, APM is often used by vendors as an umbrella term for almost anything to do with user experiences, code performance, and application architecture. All this can make it difficult to know the differences.
There are usually two main ways APM tools collect and present data.
Code-level data
New Relic, AppDynamics, and CA Technologies are the typical APM tools for software developers. They use code profiling and transaction tracing to provide information on your application.
Metric-based
Some APM tools are metric-based, and most are designed as an early warning system for major outages. Although offering a deep level of detail on availability and performance, they seldom provide the why as they don’t offer code-level profiling or transaction tracing.
Application Performance Monitoring tools that present data at a code level is the most comprehensive, however. APM tools collect billions of data points, so a well-rounded tool will not only tell you when your application is experiencing problems, it will tell you why.
APM brings detailed performance metrics for every aspect of your technology stack, in real-time. In short, it’s everything that a development team needs to resolve issues quickly and deliver a flawless software user experience.
What questions does APM help you answer?
Ensuring your application is up and running isn’t enough anymore. Slowdowns occur 10 times more frequently than crashes, so, it’s important to understand why as quickly as possible.
If you can’t see anything in your test environments, something else must be going on in production.
APM tools help your development team identify common application problems quickly:
- Understand and drill down into the root-cause of any application issue immediately, including the exact line of code, function, database, or API call that are causing issues
- Understand and compare the impact of your deployments on critical metrics such as changes to the Apdex scores, new errors introduced, regressed errors, and impact on performance
- Track overall usage to help understand traffic spikes
Who is APM for?
Since APM is all about using data to understand why problems occur, and doing whatever it takes to deliver the best possible user experience, the whole team can benefit from APM. Using one centralized tool means the entire team has access to the same data and use it across the whole development lifecycle, from pre-deployment, production, and post-deployment.
Support teams give faster and better quality customer service.
Developers can manage the quality of their work with APM and deliver a better user experience.
Testers can conduct load testing and ensure consistency throughout the product.
Operations can monitor performance and ensure code quality before performance problems reach end users.
Product managers can use real-time data to get a tight feedback loop on how users are adopting new features.
Business leaders are able to trace key business transactions based on production application behavior. If there are any performance problems impacting business growth, they’ll know about it straight away. MTTR (Mean Time to Resolution) is reduced as performance issues are fixed faster.
Features and functions of APM tools
Application Performance Monitoring tools gather a significant amount of data, but teams need actionable insights, not just reports. Here are the top features and functionalities that most APM tools will have to surface actionable data.
1. Full stack data
Understanding what is happening across your whole technology stack, whether microservices or monolithic, is incredibly helpful. It brings the whole team visibility and makes detecting and solving errors much easier.
2. Server monitoring
Arguably most critical to APM tools is understanding the server story. Metrics like CPU and memory are important, but when monitoring the server side of your app, high-level charts on which pages are performing poorly are more vital to developers. It’s the mechanism to understand what to improve.
It is also important to gather information on services like MySQL queries, Redis, or Elasticsearch.
Before you install any APM solution, you’ll need to know what’s involved in getting it setup, for example, if there is an agent and how much CPU it requires.
3. Transaction tracing
Transaction tracing is the core part of APM and records a detailed view of a transaction. One of the biggest advantages of an APM tool is visibility into the causes of problems. APM tools use transaction tracing to understand and drill down into the root-case of any application issue immediately, including the exact line of code, function, database or API call that are causing issues. You should be able to see detailed information on the user, function calls, database calls, and external calls so you can troubleshoot performance problems faster.
Tracing must have a low overhead, and should never slow down your application.
4. Deployment tracking
How are your deployments affecting page load times? Everything is about the customer, so you want to make sure changes you make are not negatively impacting page performance. Almost [1/3 of software businesses](https://blogs.manageengine.com/corporate/general/2016/07/04/one-third-of-businesses-depend-on-end-users-to-report-application-performance- issues.html) count on their end users to report these errors, so deployment tracking features alone can save many hours of development time.

Raygun correlates software errors to deployments
A critical feature of Application Performance Monitoring is to be able to understand and compare the impact of your deployments on page load times. An APM tool should be able to help you understand and compare the impact of your deployments on key metrics such as changes to the Apdex scores, new errors introduced, regressed errors, and the impact on performance.
5. Data visualization
APM tools collect billions of data points every day, so an essential feature of APM is a way of presenting the data in an easy to use central dashboard. APM must display metrics like code level performance and errors so you can spot trends and correlate data points easily. Date and time filters are a must.
Custom dashboards are an even better feature for visualizing data so you can curate your own list of vital metrics. If you are responsible for the health of the system, you need to be able to produce a report that of the key areas you are interested in, not be clogged up with information about things that are outside your SLAs.
6. Intuitive and user-friendly UI
The rich data Application Performance Monitoring provides has its downfalls if it’s not presented in an easy-to-digest format. Flame charts, averages, and helpful icons will help your team interpret data and navigate through the app to locate problems quickly.
7. Correct language support
Some tools are stack-specific, where others support many major languages.
8. Intelligent alerting functionality
An APM tool must have intelligent alerting like email notifications for when something is wrong. You can usually set alerting parameters around triggers in your application, for example, when thresholds or baseline are exceeded.
9. Integration support
Integrations should distribute your APM throughout your technology stack. Most APM tools integrate with ChatOps, issue tracking software, and hosting service for a better error resolution workflow. Integrations with incident management tools like PagerDuty will add an extra layer of protection when your app is expected to have 100% uptime.
10. Real User Monitoring
While server monitoring and crash reporting are essential for functioning applications, APM tools traditionally don’t capture anything about the user. RUM specifically allows you to drill into individual sessions, giving detailed information on the user.
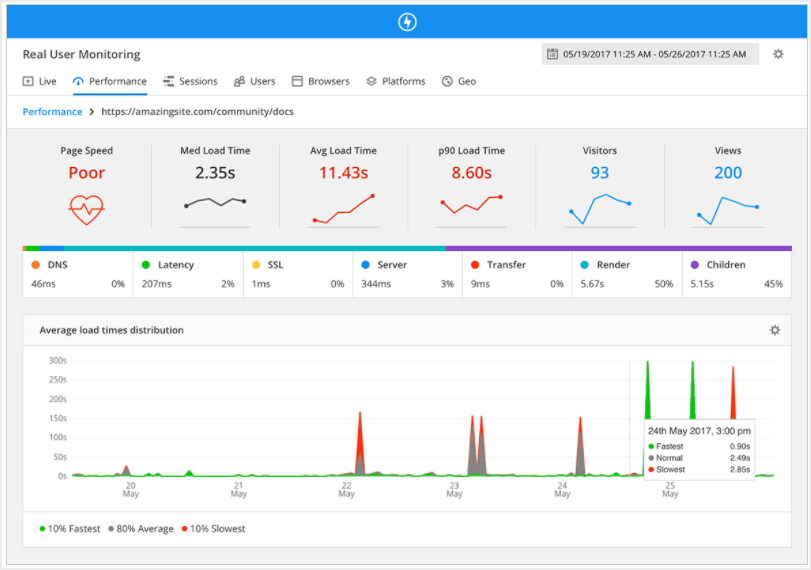
Screenshot of Raygun’s Real User Monitoring
Real User Monitoring will help answer questions like:
- Where exactly did a user encounter a slow loading page?
- What caused the problem to happen to this user?
- What was their journey path before encountering the problem?
- Was their whole session poor or just a single page/view?
- Was their device, connection speed or location a factor?
With crash reporting, real user monitoring and Application Performance Management tool working together, you can ensure that the data you are looking for is correct and that you are actually fixing the problem for the user quickly. Many software teams measure this as MTTR (Mean Time to Resolution) which can be reduced significantly with the right tooling in place.
11. Crash Reporting
Crash reporting and error tracking tools are a critical part of APM strategy. Otherwise, you have no context about an error. Some APM tools offer a graph that shows error detection over time, but not enough diagnostic information for developers to solve an issue.

Screenshot of the error summary page Raygun Crash Reporting
Dedicated crash reporting tools, on the other hand, offer the full context of an error with a detailed before and after user journey, full stack trace, and local variables. When APM and crash reporting work together, you can also see which actions caused the error-all helping to save valuable time when replicating and deploying a fix.
Raygun’s APM, Crash Reporting, and RUM work together
When you add Application Performance Monitoring to crash reporting and real software is acting for your customers.
Try Raygun’s APM tool for smarter application performance monitoring that lets you take action on software issues affecting customers. Try it for free for 14 days.
Raygun APM is available for .NET, .NET Core, and Ruby performance monitoring. We’re continuing to build our support for other languages, like Node.js, Java, Go, Python, and PHP.
Register your interest in other languages with this Google Form.