APM FAQ for the C-suite: Your questions answered
Posted Feb 14, 2019 | 9 min. (1828 words)An often hidden cost in software development is the effort it takes for a team to debug and fix issues. As an executive, you probably want to see your features hit the market fast and hard. So when your software managers start telling you that they need to stand down, or that they can’t deliver a feature because they’re hunting down bugs, it can make you wonder if your developers are doing their job. Before you jump to conclusions, consider this: your software teams might not have the right tools for the job.
Software systems are getting more complex by the month, and even the brightest humans will struggle to prevent all bugs. The increase in software complexity is like transitioning from overseas to underseas travel. Before we developed sonar, the best-trained Navy teams couldn’t dream of navigating a ship underwater. In the same way, the best software developers will have trouble dealing with complex software challenges without the right tools.
In this guide we’ll answer the following FAQ:
- What is APM exactly?
- Why does APM matter in my industry?
- How does APM monitor apps?
- Which business metrics does APM measure?
- Is APM easy to deploy and use?
- How much should APM cost?
- How do I get started?
What is APM?
Nontechnical answer
Think of Application Performance Monitoring (APM) as sonar for a development team’s application. It’s tooling to let your development teams understand how their software system performs. However, this term has been conflated to mean a myriad of tools having almost anything to do with user experience, code performance, and application architecture. Raygun’s APM suite zeroes in on the original idea, providing deep and immediate insight into an application’s performance and usage.
Technical answer
Let’s go a little deeper. What performance does a good APM tool monitor? The key metric is the total latency of your application’s requests in milliseconds. This includes not only average latency but also insight into the slowest requests in a system. Looking only at the average latency can skew developers away from potential problems creeping in. They can also ignore the frustration that smaller customers may be feeling at your application.
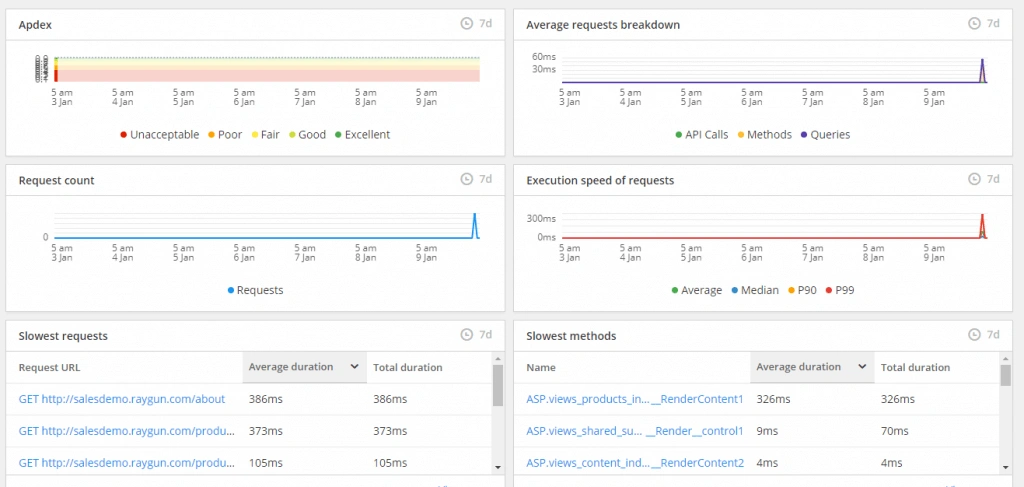
A good APM tool will specifically call out these slower requests. APM tools commonly let you see latency not only for an entire consumer request, but also for lower-level interactions. You may want to see how long it takes to reach external systems, or you may want to see how much a piece of core logic runs in the code versus the overall request time. Often, APM tools will also show you the error rates of requests. Here’s a sample of some of what Raygun shows:
Why does APM matter?
Nontechnical answer
APM tools are more important than ever in today’s landscape. Our traditional testing, even when automated, is failing to keep up with the increasing distribution and complexity of the distributed enterprise application. We need tools that let us cheaply detect problems when they inevitably arise. As these systems become more interconnected across the organization, operational costs skyrocket. APM tooling lets us keep these costs from inflating.
We often need APM and related tools to keep customer trust high. It’s embarrassing when our customers know about an issue before we do. When developers are looking at their APM dashboards, they can proactively detect potential risks before anyone else is the wiser. They can even spot abnormal behavior that the customer doesn’t yet find frustrating. This can engender their trust that we’re actively finding ways to make their experience better.
“Thanks to our CI/CD Pipeline and Raygun, we can find a bug, fix it, and push it to production in a matter of hours or even minutes. We no longer have to wait for a bug to be reported and then begin the process of tracking it down.”
Karl Gjertsen - CEO and Lead Developer of Competition Golf
Technical answer
From the development team’s perspective, having an APM tool lets the team get a feel for the baseline rhythm and latency of their application across multiple features. Once the team has an idea of this baseline, they can easily detect spikes and abnormalities after deployments and releases. If my “Product Search” endpoint is normally 190 ms, but it jumps to 700 ms after deployment, I can easily pinpoint that we botched our database queries for our new “tagged search” feature.
How does APM monitor apps?
Nontechnical answer
APM tools monitor most applications by plugging into the outlets made available by many application frameworks. Most applications are built on a bedrock of a framework. These frameworks are often made freely or cheaply available by popular vendors for the application’s language. Another way APM tools can monitor an application is by listening to the server itself. Whenever the application runs, the tool listens to the various events and information that are broadcast.
Technical answer
To give more detail, most application frameworks have a specific life cycle of events that happen for an application. The main business logic usually sits somewhere in the middle. For example, a web framework may go “request routed” -> “user authorization” -> “pre-request handle” -> “handle request” -> “post-request handled” – > “render web page.” A smart APM tool may wire into the “pre-request handle” and “post-request handled” events to measure the duration. It would then report out to the APM’s server all the information collected through the life cycle of the application request.
Is APM easy to deploy and use?
Nontechnical answer
Deployment and use of APM tools can be dirt simple. For many, you need to install a listener onto the server you want to monitor. Once that’s in place, it can detect whenever the application runs. Many development teams can automate this process. The tool’s usability varies widely. For most of them, using them is as simple as looking at a couple of graphs for potential risks.
Technical answer
For a developer, deploying an APM tool usually involves the following:
- Downloading the agent from its source
- Creating a script to install that agent after the application deploys
- Plugging in the appropriate properties, such as an application programming interface (API) key, into the installed agent
Using the APM tool then involves logging onto a website and looking at the graphed trends. Good APM tools will also give specific insights into important breakdowns and views of the application’s latency. The smartest APM tools will come with pre-built rules created from research and case studies. These will help guide developers to a healthy application within minutes of installation.
Which business metrics does APM measure?
Nontechnical answer
APM tools can expose some key business metrics:
-
Are your customers likely to be frustrated? Even just a few slow requests can kill a user’s desire to use a team’s application and can cause the user to move on to a competitor. For internal apps, you’ll likely receive a lot of complaints from middle management.
-
Are customers even using a new feature? You can easily see if anyone is attempting to use a new feature, depending on the size of the enhancement. If no one is using it, the team may have made a bad investment.
-
Which requests may be expensive for the team to keep running? Certain slowness trends may point to a feature that contains an obscure error that may take days to troubleshoot, waiting for a customer to encounter it.
Technical answer
Let’s examine these metrics in depth:
-
Are your customers likely to be frustrated? Humans are very sensitive to response times. Even an extra second of latency in a request can derail users and make them think, “This might not be worth it. I can probably get this done faster elsewhere.” Seeing requests over 500 ms, for example, can be a warning signal.
-
Are customers even using a new feature? If your request count is 0, no one is using your feature. Even small amounts of request counts may signal that people don’t really want it.
-
Which requests may be expensive for a team to keep running? Latency oscillating between fast and slow speeds can be a warning. The most vicious bugs are ones that aren’t consistently repeatable, or ones that are repeatable only under very specific conditions.
How much should APM cost?
Nontechnical answer
Pricing for APM tooling varies from company to company. Some are vague, giving you a price only once they have your team on the hook. Others like to do a price per machine that their tool runs on. If you find enough value to make a large investment, some have unlimited use of annual pricing. Some tools, like Raygun, will price based on usage. So, the investment you make is directly proportional to how much you report to the tool per set of requests.
Whatever the pricing model, it’s often best to get a feel for the investment you would make into the tool by piloting with a small team initially. You can also create a gradual rollout plan across your software teams to ensure you’re not caught off guard by unforeseen price spikes. Each team should ideally have a line of sight into what their cost is to use the tool for their applications. In turn, they should be giving a line of sight into what value they’re getting out of the tool.
Technical answer
Raygun’s pricing is relatively unique. It prices per trace—a capture of a flow of execution within a web request. So, for example, 10 unique web requests will produce 10 traces, assuming no sampling. Ten web requests to the same resource within 5 minutes would produce one trace with sampling settings of one per five minutes, whereas 10 web requests to the same resource within 10 minutes would produce two traces with sampling settings of one per five minutes. And 10 web requests to unique resources would produce 10 traces with sampling settings of one per five minutes.
This means that Raygun’s pricing will scale based not on how much traffic an application has, but on how much of that traffic you want to track. So, if a development team finds they greatly under anticipated traffic rates, and thus their cost to use Raygun, they can always roll back the sampling rate instead of turning it off altogether. This makes Raygun a financially safe tool to use.
How do I get started?
Using a performance monitoring tool like Raygun can significantly reduce operational costs to your team on multiple fronts. If you’re curious about getting a team ramped up and using it, here’s what to do:
-
Pick one of your strong development teams using .NET that gets a significant number of requests to hit their system in production.
-
Guide them to Raygun’s site to initiate a free trial.
-
Have them report back after the trial expires to see if it allowed them to operate more efficiently in the face of defects and other challenges.
You’ll likely find the team saying that Raygun is more than worth the investment.