Raygun Application Performance Monitoring is here
Posted Oct 5, 2018 | 5 min. (977 words)When you’re building software, there’s so much to think about — from bugs to how fast your application loads.
We’ve got something new to help your development team build better, faster experiences for your users, in less time.
Today, we’re releasing Raygun Application Performance Monitoring (APM) for .NET, a new way to visualize and understand your application’s performance on the server-side.
All you need to do is install the Raygun Agent, and we’ll help you measure where hidden bottlenecks are in your applications. This is a big deal for teams of all sizes, offering a single place to diagnose errors and performance problems without breaking the bank.
What is APM?
It’s not enough to know that your application is up or down anymore; slowdowns occur 10 times more frequently than crashes, so it’s important to understand why as quickly as possible.
APM tools help you:
-
Understand and drill down into the root cause of any application issue immediately, including the exact line of code, function, database or API calls that cause issues.
-
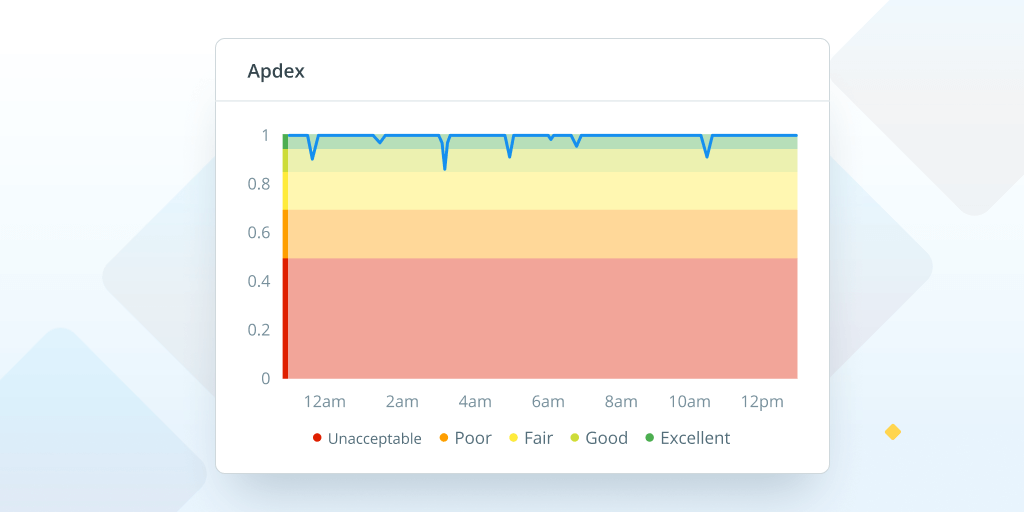
Discover key metrics such as changes to Apdex scores
-
Deliver exceptional user experiences as you catch problems before they affect your customers.
Over the years, we’ve received feedback from our customers that the current APM landscape needs to change.
Firstly, most APM tools lack the context to give meaningful data to developers, making debugging and troubleshooting difficult. Secondly, with current pricing models, APM tools are inaccessible to companies operating in a modern development environment, for example using microservices and containers.
We built Raygun APM to answer the need for an integrated monitoring solution that provides developers with complete visibility into crashes and performance issues from the server to the end-user, while also being cost-effective for all modern architectures.
“The addition of APM to the Raygun Platform delivers on our vision of a totally integrated monitoring solution. Crashes, Real User Performance and Server/Application Monitoring all in one place, not siloed.
We’ve been building towards the most integrated monitoring platform for years, re-thinking what could be achieved and support all modern solution architectures.”
John-Daniel Trask, CEO and Co-Founder of Raygun
We believe Raygun is a breath of fresh air for modern development teams needing an APM solution. Rather than overloading developers with data points, our goal is to provide a developer-friendly product that excels in delivering the necessary details needed to fix problems quickly.
Raygun delivers what other APM tools can’t: an intuitive and easy to use interface with unparalleled detail into application performance.

Developers who used APM during our Beta phase said that they received better insights with our tools than existing, mature platforms. Using the detail Raygun provided, they were able to gain greater visibility into what was actually going on in their codebase. Enabling them to solve problems they couldn’t previously understand with their existing solution.
Here are five ways we stack up with today’s APM landscape.
1. Competitive pricing
Innovative usage-based pricing means you can deliver cost-effective APM across your whole stack — be it a microservices architecture or single large monolith.
2. Short learning curve
With our free 14-day trial and easy installation process, you can get data flowing in as little as two minutes.
3. Developer-friendly UI
With Raygun APM, the information you need to debug and diagnose problems is never more than a few clicks away. The core of APM is our flame charts, which display a visual timeline of traces, helping make it simple to identify areas for improvement in the future and highlight issues in seconds.
4. Quality data
Raygun excels in capturing the rich details teams need to diagnose problems. Several of our customers have already been able to surface detailed information relating to a specific request because they have access to every detail available needed to do so.
5. Everything in one place
Correlate server-side timings with errors, crashes, and front-end performance with the Raygun Platform.

“Tracing, along with flame charts, make it very clear where the problems are located. This saves a lot of time for everyone.” Eric Fernandez, CEO and Co-Founder, Linbis Logistics Software
Features and integrations available today
Raygun APM works with your current development environment and already has all of the features you need to diagnose issues quickly, such as:
- Detailed transaction tracing
- Dashboards
- User experience reporting
- Real User Monitoring
Integrations are available on launch, too, including:
- GitHub
- Slack
- Jira Software
- PagerDuty
- VictorOps
(For more details head to our integration documentation.)
What the future holds for Raygun APM
In the coming months, we will be adding more integrations and features to the Raygun Platform.
While Raygun APM already has a mature Real User Monitoring product, our near-term goal is to continue to add more features that help surface business scenarios. Expect features like custom reporting, deployment tracking, focused dashboarding, high-level metrics and service discovery.
How to get set up
Raygun APM is so easy to set up that many teams have had data flowing in just two minutes. We suggest you try it for yourself! For those already using Raygun, we’re making small changes to our billing to add APM to our platform. Here’s how that affects you.
If you are on a Platform plan (with access to all Raygun products)
A number of Raygun APM traces will be automatically included as part of your current subscription — there is nothing you need to change. View more details on our pricing page.
If you are on a Crash Reporting only plan
With a Crash Reporting only plan, you may like to consider upgrading to a Raygun Platform plan, which gives you access to all Raygun products (including Raygun Crash Reporting, Real User Monitoring, and APM).
If you’d like to find out more about the setup process, visit our Getting Started documentation.
We’re excited to help development teams work better together, and we’d love to hear what you think, just get in touch.