Java performance optimization tips: How to avoid common pitfalls
Posted Apr 13, 2023 | 22 min. (4532 words)In this post, we’ll be delving into Java performance optimization, providing you with essential tips to write faster and more efficient code. If you’re reading this, you’re probably already aware of the importance of performance engineering and the need to optimize your code to ensure speed for all users, but even the most seasoned and performance-aware programmers can get tripped up.
Below, we’ll cover several of the most notorious causes of performance issues in Java programs, including object creation, String operations, looping, and regular expressions. We’ll equip you with the best tips and strategies to optimize around common issues, allowing you to write more efficient programs and avoid common pitfalls that hinder performance.
Plus, we’ll discuss the importance of rethinking your approach to problem-solving, and the benefits of using primitives and the stack to optimize your code. We also introduce some basic performance-boosting tools - a profiler to help identify bottlenecks in-depth, and monitoring tools to keep an eye on performance in production and catch any regressions. Whether you’re a seasoned Java developer or just starting to write code, we’ll provide you with the knowledge to optimize your Java code for peak performance.
So, without further ado, let’s dive into the world of Java performance optimization and learn how to achieve faster and more efficient code.
Table of Contents
- What are the common Java pitfalls that lead to performance issues?
- Our best Java performance optimization tips
- Rethinking your approach to the problem
- Use a profiler!
- Streams API vs the trusty for loop
- Date transport and manipulation
- String operations
- Avoid regular expressions
- Use primitives and the stack
- Conclusion
- Frequently-Asked Questions (FAQ): Java Performance
What are the common Java pitfalls that lead to performance issues?
Java is a powerful programming language that allows developers to write robust and scalable applications. However, even experienced developers can fall into making programming choices that lead to performance issues. Here are some of the most common pitfalls that can affect Java application performance.
- Object creation: Creating too many objects can cause a significant performance hit, as object creation and garbage collection can be a resource-intensive process on your Java platform.
- String operations: Strings are immutable in Java, which means that each time you modify a string, a new string object is created. This can quickly become a performance bottleneck, especially when dealing with large amounts of data. Concatenating strings with the “+” operator repeatedly is a common example of inefficiently using string operations.
- Looping: Loops are an essential part of Java programming, but poorly optimized loops can significantly impact performance. One common mistake is iterating over collections using the “for-each” loop, which creates an iterator object behind the scenes, causing unnecessary object creation.
- Regular expressions: Let’s say you’re building a search function that uses a regular expression to match patterns in a large dataset. Complex regular expressions can be resource-intensive and impact performance, especially if the dataset is large.
By being aware of these pitfalls and using best practices, you can avoid poor Java performance and dodge common performance issues.
Our best Java performance optimization tips
Programmers have been optimizing Java performance for decades, so there’s no shortage of good advice available. Here are our favorite tips and techniques you can use to improve Java performance:
Rethinking your approach to the problem
Before attempting to micro-optimize a specific code path, it’s worth thinking about the current code choices.
Sometimes the fundamental approach might be flawed, meaning even if you apply a lot of effort and manage to make it run 25% faster with all the optimizations possible, changing the approach (using a better algorithm) could result in an order of magnitude improvement or greater performance increase.
This often happens when the scale of data being operated on changes – it’s straightforward enough to write a solution that works well enough now, but when you get real data volumes, it starts falling over.
For example, suppose you have a program that needs to find the maximum value in a large array. One approach might be to iterate over the entire array and compare each element to the current maximum. That might look like this:
public int findMax(int[] arr) {
    int max = 0;
    for (int i = 0; i < arr.length; i++) {
        if (arr[i] > max) {
            max = arr[i];
        }
    }
    return max;
}
While this simple approach works fine for small arrays, it can be very slow for very large arrays, especially if the maximum value is near the end of the array.
A better approach might be to divide the array into smaller sub-arrays and find the maximum value in each sub-array in parallel, then combine the results to find the maximum value overall. Here’s how that might look:
public int findMax(int[] arr) {
    int numThreads = Runtime.getRuntime().availableProcessors();
    int chunkSize = arr.length / numThreads;
    int[] maxValues = new int[numThreads];
    Thread[] threads = new Thread[numThreads];

    for (int i = 0; i < numThreads; i++) {
        int start = i * chunkSize;
        int end = (i == numThreads - 1) ? arr.length : (i + 1) * chunkSize;
        threads[i] = new Thread(() -> {
            int max = 0;
            for (int j = start; j < end; j++) {
                if (arr[j] > max) {
                    max = arr[j];
                }
            }
            maxValues[i] = max;
        });
        threads[i].start();
    }

    for (int i = 0; i < numThreads; i++) {
        try {
            threads[i].join();
        } catch (InterruptedException e) {
            // handle exception
        }
    }

    int max = 0;
    for (int i = 0; i < numThreads; i++) {
        if (maxValues[i] > max) {
            max = maxValues[i];
        }
    }
    return max;
}
This code divides the array into smaller sub-arrays based on the number of available processors, then creates a separate thread to find the maximum value in each sub-array. The maximum values for each sub-array are stored in an array, then combined to find the maximum value overall.
This approach can be much faster for large arrays because it uses parallel processing to find the maximum value more quickly. This simple example shows that just by rethinking your approach to the problem, you can often find more efficient solutions that don’t require as much code optimization.
Use a profiler!
Another common pitfall is relying on guesswork when addressing performance problems. Many developers will make changes to code based on assumptions or hunches about what might be causing performance issues. This can lead to wasted effort and even make performance worse rather than better.
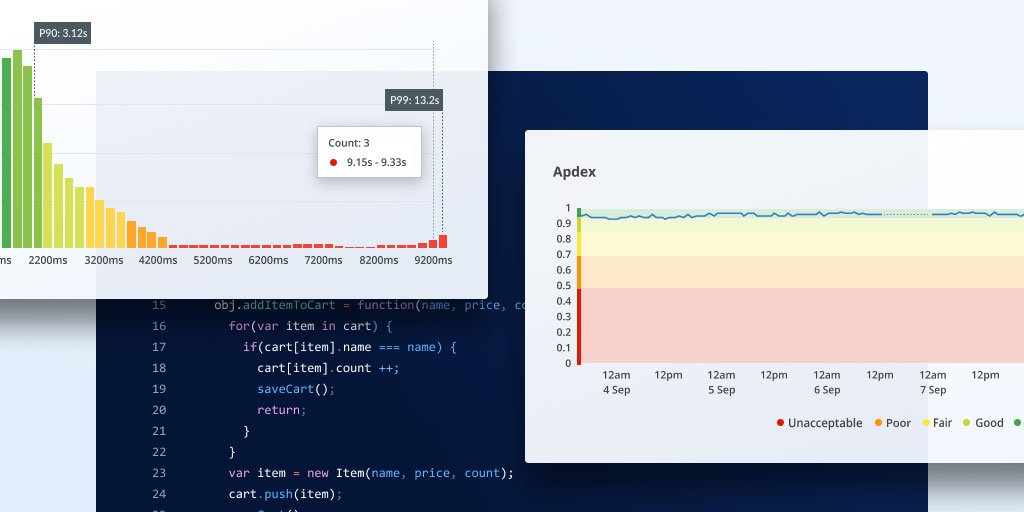
Instead, use a profiler to identify where performance bottlenecks are occurring. A profiler is an application performance management tool that can analyze your code and provide detailed information about how long each method takes to execute, how much memory is being used and other performance metrics.
The profilers that I can recommend are VisualVM and JProfiler (paid – and worth it). Here are my top 3 profilers and their key features at a glance:
| Profiler | Key features |
|---|---|
| JProfiler | Low overhead, real-time profiling, CPU and memory profiling, thread analysis |
| VisualVM | Heap dump analysis, CPU and memory profiling, integration with other JDK tools |
| YourKit | Low overhead, real-time profiling, memory leak detection, integration with popular IDEs |
In addition to using profilers, monitoring tools will help you detect errors and performance issues in production and diagnose and address these much faster. Use a crash reporting tool to quickly identify and resolve errors and crashes, with detailed diagnostics on what went wrong and where. With this information, you can quickly identify and fix the root cause of the issue, improving the overall performance and stability of your application.
Streams API vs the trusty for loop
Streams are a great addition to the Java language, letting you easily lift error-prone patterns from for loops into generic, more reusable blocks of code with consistency guarantees. But this convenience doesn’t come for free; there is a performance cost associated with using streams.
Thankfully this cost isn’t usually too high - at best, a few % faster, and at worst 10-30% slower for common operations - but it is something to be aware of.
99% of the time, the loss of performance from using Streams is more than made up by the increased clarity of the code. But for that 1% of times where you’re using a stream inside of a hot loop, beware of the performance trade-off.
This is especially true for any very high throughput applications. The increased memory consumption and allocations from the streams API (according to this StackOverflow post each filter adds 88 bytes of used memory) can cause enough increased memory pressure to require more frequent GC runs, causing a heavy hit on application performance itself.
Parallel streams are another matter. Despite their ease of use, they should only be used in specific scenarios, and only after you’ve profiled both the parallel and serial operations to confirm the parallel one is faster. On smaller data sets (the cost of the stream computation determines what constitutes a smaller data set) the cost of splitting up the work, scheduling it on other threads, and stitching it back together once the stream has been processed will dwarf the speedup from running the computations in parallel.
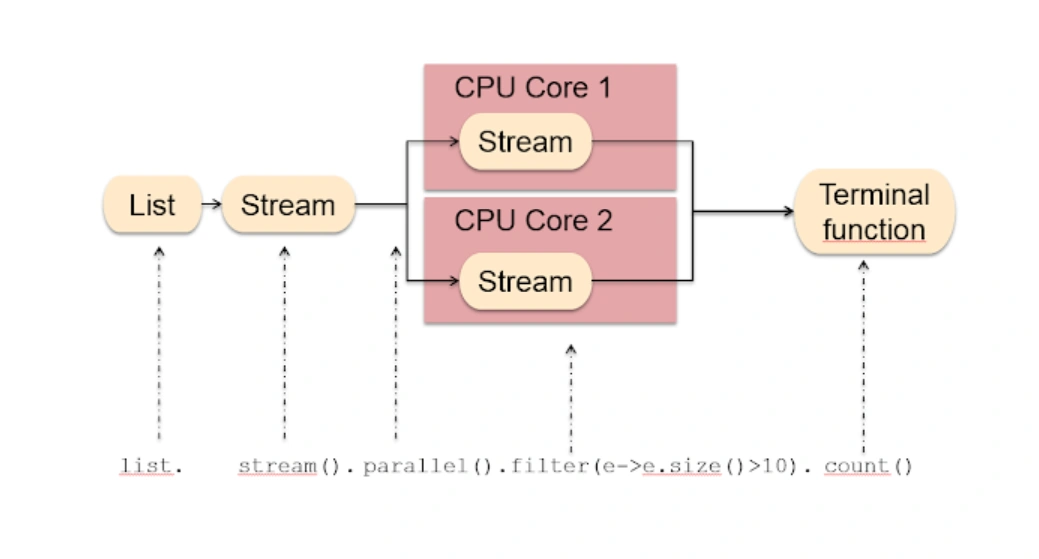
(Example of Parallel stream. Source: JavaRevisited)
You must also consider the execution environment your code is running in. If it’s running an already heavily parallelized environment (like a website), then it’s unlikely you will even get the speedup of running the stream in parallel. In fact, under load, this might be worse than non-parallel execution. Because of the parallel nature of the workload, the application startup is most likely already making as much use of the remaining CPU cores as it can, meaning you’re paying the cost of splitting the data up without the benefit of increasing the amount of available computation power.
A sample of the benchmarks I performed. The testList is a 100,000 element array of the numbers 1 to 100,000 converted to a String, shuffled.
// ~1,500 op/s
public void testStream(ArrayState state) {
    List<String> collect = state.testList
            .stream()
            .filter(s -> s.length() > 5)
            .map(s -> "Value: " + s)
            .sorted(String::compareTo)
            .collect(Collectors.toList());
}

// ~1,500 op/s
public void testFor(ArrayState state) {
    ArrayList<String> results = new ArrayList<>();

    for (int i = 0;i < state.testList.size();i++) {
        String s = state.testList.get(i);

        if (s.length() > 5) {
            results.add("Value: " + s);
        }
    }

    results.sort(String::compareTo);
}

// ~8,000 op/s
// Note, with an array size of 10,000 and more variable load on my CPU this was 1/3rd as fast as testStream
public void testStreamParrallel(ArrayState state) {
    List<String> collect = state.testList
            .stream()
            .parallel()
            .filter(s -> s.length() > 5)
            .map(s -> "Value: " + s)
            .sorted(String::compareTo)
            .collect(Collectors.toList());
}
In summary, streams are a great win for code maintenance and readability with a negligible performance impact for the vast majority of cases, but it pays to be aware of the overhead for the rare instance where you need to wring the extra performance out of a tight loop.
It’s good to be aware of the advantages and disadvantages of each. Here is a quick summary of when you should be using each:
| Streams API | For Loop | |
|---|---|---|
| Advantages | - Increased code clarity and reusability - Ability to perform operations on multiple elements at once | - Better performance with small data sets and hot loops - Reduced memory overhead |
| Disadvantages | - Performance overhead for larger data sets and hot loops - Increased memory allocations, leading to more frequent garbage collection - Parallel streams have additional overhead and should only be used in rare scenarios | - Code can be more error-prone - Less readable code |
Date transport and manipulation
Don’t underestimate the cost of parsing a date string into a date object and formatting a date object to a date string. Imagine a scenario where you had a list of a million objects (either strings directly or objects representing some item with a date field on them backed by a string), and you had to perform an adjustment to the date on them.
In the context where this date is represented as a string, you first have to parse it from that string into a Date object, update the Date object and then format it back into a string. If the date was already represented as a Unix timestamp, (or a Date object, because it’s effectively just a wrapper around a Unix timestamp) all you have to do is perform a simple addition or subtraction operation.
Per my test results, it is up to 500x faster to just manipulate the date object compared to having to parse and format it from/to a string. Even just cutting out the parsing step results in a speedup of ~100x.
This may seem like a contrived example, but I’m sure you’ve seen cases where dates were being stored as strings in the database or returned as strings in API responses.
// ~800,000 op/s
public void dateParsingWithFormat(DateState state) throws ParseException {
    Date date = state.formatter.parse("20-09-2017 00:00:00");
    date = new Date(date.getTime() + 24 * state.oneHour);

    state.formatter.format(date);
}

// ~3,200,000 op/s
public void dateLongWithFormat(DateState state) {
    long newTime = state.time + 24 * state.oneHour;

    state.formatter.format(new Date(newTime));
}

// ~400,000,000 op/s
public long dateLong(DateState state) {
    long newTime = state.time + 24 * state.oneHour;

    return newTime;
}
Basically, always be conscious of the cost of parsing and formatting date objects and unless you need the string right then, it’s much better to represent it as a Unix timestamp.
String operations
String manipulation is probably one of the most common operations in any program. However, it can be an expensive operation if done incorrectly, which is why we’ve focused on string manipulation in these Java performance optimization tips. We list some of the common pitfalls below. However, bear in mind that these problems only present themselves in very fast code paths or with a considerable number of strings - none of the following will matter in 99% of cases. But when they do, they can be a performance killer.
Using String.format when a simple concatenation would work
A very simple String.format call is on the order of 100x slower than manually concatenating the values into a string. This is fine most of the time because we’re still talking about 1 million operations/second on my virtual machine here, but inside of a tight loop operating on millions of elements, the loss of performance could be substantial.
One instance where you should use string formatting instead of string concatenation in high-performance environments, however, is debug logging. Take the following two debug logging calls:
logger.debug("the value is: " + x);

logger.debug("the value is: %d", x);
The second instance, which may seem counter-intuitive at first, can be faster in a production environment. Since it’s unlikely you’ll have debug logging enabled on your production servers, the first causes a new string to be allocated and then never used (as the log is never outputted). The second requires loading a constant string and then the formatting step will be skipped.
// ~1,300,000 op/s
public String stringFormat() {
    String foo = "foo";
    String formattedString = String.format("%s = %d", foo, 2);

    return formattedString;
}

// ~115,000,000 op/s
public String stringConcat() {
    String foo = "foo";
    String concattedString = foo + " = " + 2;

    return concattedString;
}
Not using a string builder inside of a loop
If you’re not using a string builder inside of a loop, you’re throwing away a lot of potential performance. The naive implementation of appending to a string inside of a loop would be to use += to append the new portion of the string to the old string.
The problem with this approach is that it will cause an allocation of a new string every iteration of the loop and require copying the old string into the new string. This is an expensive operation in and of itself, without even taking into account the extra garbage collection pressure from creating and discarding so many strings.
Using a StringBuilder will limit the number of memory allocations, resulting in a large performance speedup. My testing using a StringBuilder resulted in a speedup of greater than 500x. If you can at least have a good guess at the size of the resulting string when constructing the StringBuilder, setting the correct size (which means the internal buffer won’t need to be resized, causing an allocation and copy each time) can result in a further 10% speedup.
As a further note, (almost) always use StringBuilder instead of StringBuffer. StringBuffer is designed for being used in multi-threaded environments, and as such has internal synchronization. The cost of performing the synchronization must be paid even if it’s only being used in a single-threaded environment.
If you do need to append to a string from multiple threads (say in a logging implementation), that’s one of the few situations where StringBuffer should be used instead of a StringBuilder.
// ~11 operations p/s
public String stringAppendLoop() {
    String s = "";

    for (int i = 0;i < 10_000;i++) {
        if (s.length() > 0) s += ", ";
        s += "bar";
    }

    return s;
}

// ~7,000 operations p/s
public String stringAppendBuilderLoop() {
    StringBuilder sb = new StringBuilder();

    for (int i = 0;i < 10_000;i++) {
        if (sb.length() > 0) sb.append(", ");
        sb.append("bar");
    }

    return sb.toString();
}
Using a StringBuilder outside of a loop
This is something you’ll see recommended online and seems like it would make sense. But testing showed it was in fact 3x slower than using += is using a StringBuilder – even when not in a loop. Even though using += in this context is translated into StringBuilder calls by javac it seems to be much faster than using a StringBuilder directly. If anyone has any idea why this is, we’d love to hear about it!
// ~20,000,000 operations p/s
public String stringAppend() {
    String s = "foo";
    s += ", bar";
    s += ", baz";
    s += ", qux";
    s += ", bar";
    s += ", bar";
    s += ", bar";
    s += ", bar";
    s += ", bar";
    s += ", bar";
    s += ", baz";
    s += ", qux";
    s += ", baz";
    s += ", qux";
    s += ", baz";
    s += ", qux";
    s += ", baz";
    s += ", qux";
    s += ", baz";
    s += ", qux";
    s += ", baz";
    s += ", qux";

    return s;
}

// ~7,000,000 operations p/s
public String stringAppendBuilder() {
    StringBuilder sb = new StringBuilder();
    sb.append("foo");
    sb.append(", bar");
    sb.append(", bar");
    sb.append(", baz");
    sb.append(", qux");
    sb.append(", baz");
    sb.append(", qux");
    sb.append(", baz");
    sb.append(", qux");
    sb.append(", baz");
    sb.append(", qux");
    sb.append(", baz");
    sb.append(", qux");
    sb.append(", baz");
    sb.append(", qux");
    sb.append(", baz");
    sb.append(", qux");
    sb.append(", baz");
    sb.append(", qux");
    sb.append(", baz");
    sb.append(", qux");
    sb.append(", baz");
    sb.append(", qux");

    return sb.toString();
}
So string creation has a definite overhead, and should be avoided in loops where possible. This is easily achieved by using a StringBuilder inside of the loop instead. With just the simple append example, the performance results are vastly different:
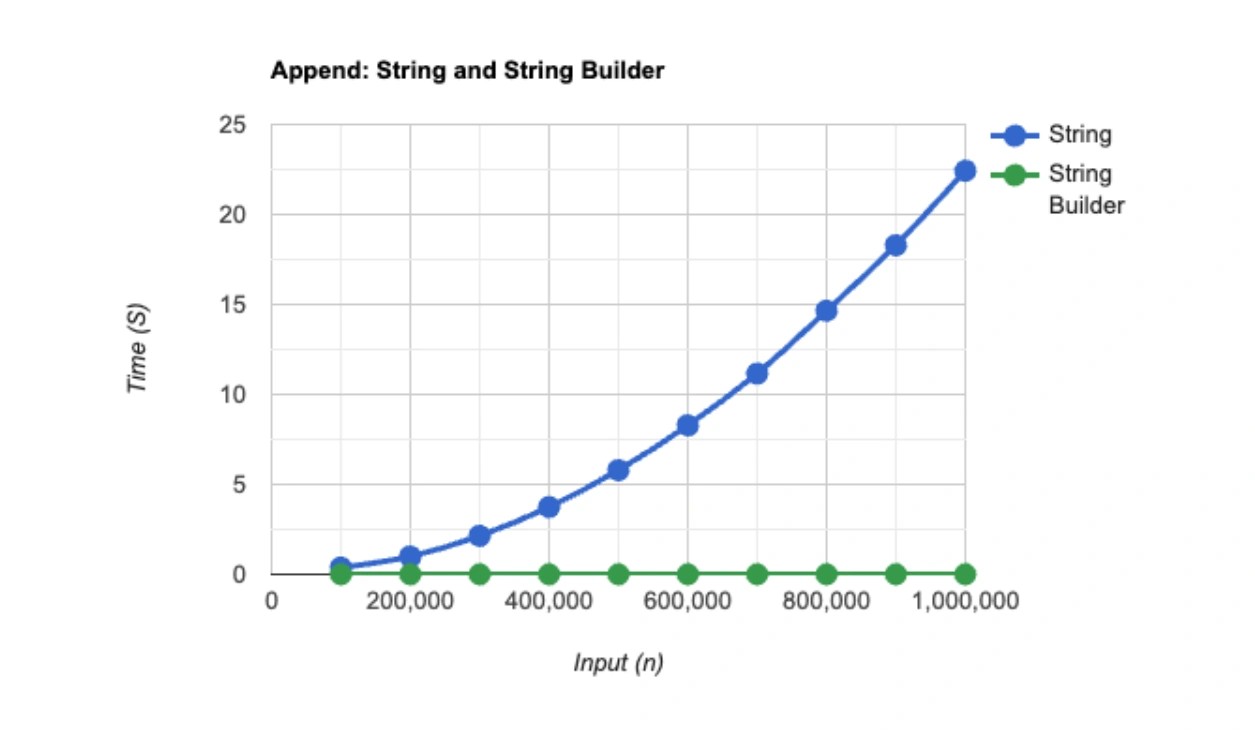
(Source: Dev.to)
Avoid regular expressions
Regular expressions are a powerful tool for parsing and manipulating strings, but they can also create a significant performance bottleneck if used incorrectly. This is because regular expressions involve a lot of backtracking and can be quite expensive to execute, especially on large inputs.
Here are a few tips to help you avoid common pitfalls when using regular expressions:
- Use compiled regular expressions: One way to improve the performance of regular expressions is to compile them once and reuse them instead of recompiling them every time they are used. Java provides a Pattern class for this purpose.
- Avoid excessive backtracking: Regular expressions can backtrack extensively when they fail to match a string. You can avoid this by using atomic groups, possessive quantifiers, and look-ahead assertions. These constructs can help reduce the amount of backtracking needed to match a string.
- Be careful with greedy quantifiers: Greedy quantifiers (such as “+ or “*”) can cause regular expressions to match more than you intended. If you only need to match a specific pattern, consider using a reluctant quantifier by appending “?” to your quantifier (such as +? or *?) instead.
- Use the right tool for the job: Regular expressions are not always the best tool for the job. If you need to perform simple string manipulation, such as substring searches or replacements, consider using the String class’s built-in methods instead.
One common mistake is to use regular expressions when simpler string manipulation would suffice. For example, suppose you have a string that you need to split into words. One approach might be to use a regular expression to match on whitespace:
String[] words = inputString.split("\\s+");While this code works fine for small inputs, it can be very slow for large inputs because the regular expression engine has to scan the entire input string looking for matches. A better approach might be to use the StringTokenizer class:
StringTokenizer tokenizer = new StringTokenizer(inputString);
String[] words = new String[tokenizer.countTokens()];
for (int i = 0; i < words.length; i++) {
    words[i] = tokenizer.nextToken();
}
This code uses the StringTokenizer class to split the input string into words, which is much faster than using regular expressions.
Another common mistake is to use regular expressions in a loop. For example, suppose you have a program that needs to match a pattern against a large number of strings. One approach might be to use a regular expression in a loop:
Pattern pattern = Pattern.compile("some pattern");
for (String inputString : inputStrings) {
    Matcher matcher = pattern.matcher(inputString);
    if (matcher.find()) {
        // do something
    }
}
While this code works fine for small input sets, it can be very slow for large input sets because the regular expression engine has to recompile the pattern for each string. A better approach might be to precompile the pattern outside the loop:
Pattern pattern = Pattern.compile("some pattern");
for (String inputString : inputStrings) {
    Matcher matcher = pattern.matcher(inputString);
    if (matcher.find()) {
        // do something
    }
}
This code precompiles the regular expression pattern before the loop, which is much faster than recompiling it for each string.
In general, it’s important to be mindful of the performance cost of regular expressions and to use them selectively. Whenever possible, try to use simpler string manipulation techniques instead. If you must use regular expressions, precompile the pattern outside of any loops to avoid the performance overhead of recompiling it for each string.
Use primitives and the stack
As mentioned before, a common pitfall programmers face is unnecessary object creation. So one of the most basic performance optimization tips for Java programming is to use primitives instead of their corresponding wrapper classes wherever possible.
This is because primitive data types like int, char, and boolean are much faster and more efficient than their object counterparts Integer, Character, and Boolean. When using primitives, the JVM can directly manipulate the data on the stack without creating an object on the heap, which can lead to significant performance improvements.
The difference, side by side, is extremely visible. So you can see how this would add up in some Java programs:
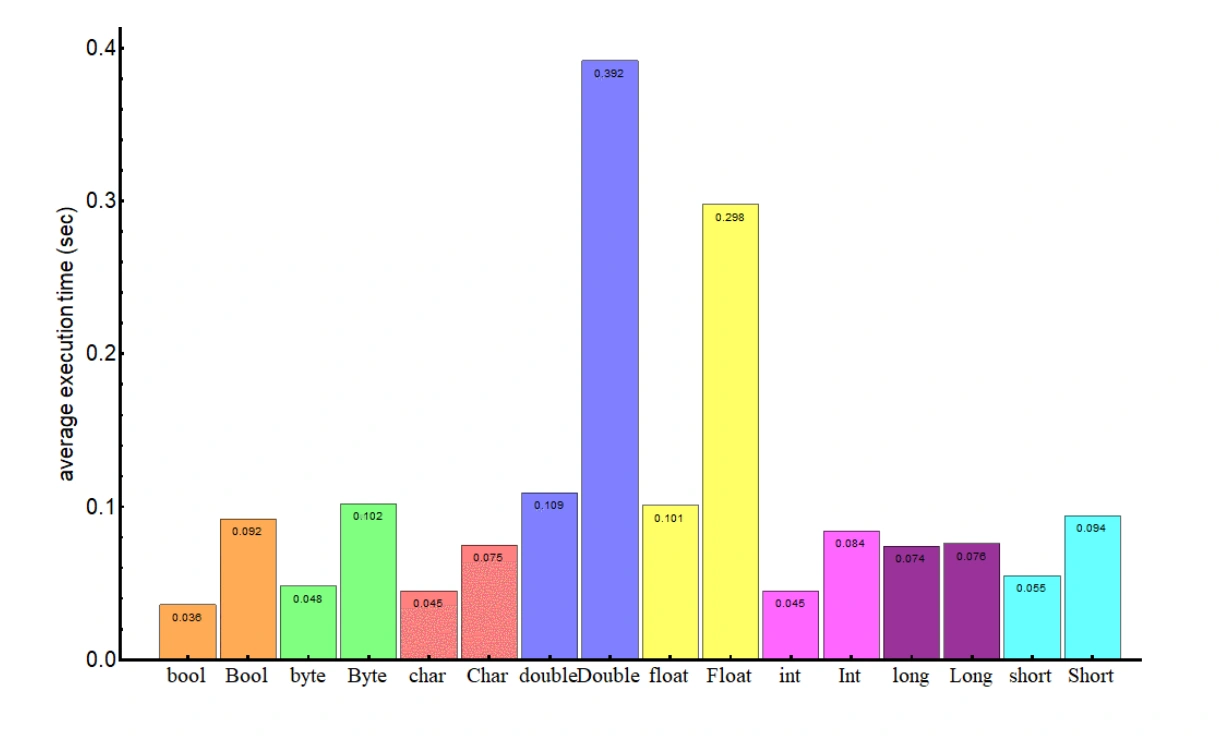
(Source: Baeldung)
In addition to using primitives, it’s also a good idea to make use of the stack whenever possible. The stack is a small, fast region of memory where primitive data types and references are stored during method calls. By keeping frequently accessed data on the stack, rather than on the heap, you can improve the performance of your code.
One way to take advantage of the stack is to use local variables instead of fields in classes. Local variables are created on the stack and are therefore faster to access than instance variables stored on the heap. Additionally, by limiting the scope of local variables to the smallest possible area, you can further optimize your code’s performance.
Another way to use the stack is to avoid excessive object creation. Every time an object is created, it must be allocated to the heap, which can be a time-consuming process. By reusing objects or creating objects in advance and storing them on the stack, you can reduce the number of object allocations and improve your code’s performance.
Using primitives and the stack are fundamental performance optimization techniques in Java programming. By making use of these techniques, you can write more efficient and faster code. However, it’s important to keep in mind that premature optimization can lead to code that is harder to read and maintain. As with all optimization techniques, it’s important to measure and profile your code to ensure that the optimization is making a difference.
Wrapping up
Java is a powerful programming language that’s widely used in the development of software applications.
While Java provides a rich set of features and APIs, developers must be mindful of performance when designing and implementing their code. By following the tips and best practices outlined in this article, developers can optimize their Java code and avoid common pitfalls that can negatively impact performance.
From utilizing the stack and primitives to avoiding excessive object instantiation and making use of concurrency, these tips can help you write more efficient and high-performing Java applications. By keeping performance in mind and following these guidelines, developers can ensure that their Java applications are both functional and performant.
If you’d like more clues as to where performance problems may be lurking in your Java applications, try Raygun Crash Reporting and Real User Monitoring free for 14 days. Read more here.
FAQs: Java Performance
What is Java performance optimization? How can performance be improved for better results in Java applications?
Java performance optimization is the process of enhancing the speed and efficiency of Java applications. It involves identifying and rectifying performance bottlenecks, optimizing algorithms and data structures, minimizing garbage collection, and reducing object instantiation to make the application run faster.
To improve Java application performance software performance, you can start with using a profiler and implement the many tips we cover in the above article.
What are some Java pitfalls that programmers should be wary of when developing Java applications?
Java pitfalls that programmers should avoid include:
- using inefficient data structures
- creating too many object instances
- relying too much on garbage collection
- using expensive operations such as I/O or database queries in performance-critical code.
What are the recommended actions when encountering a Java runtime error or a Java error?
When encountering a Java runtime error, identify the root cause by examining the error message and stack trace. Once you’ve identified the cause, take appropriate action such as updating libraries or modifying code. In the case of a Java error, the specific error message and error code should be identified, and corrective measures like updating Java, reinstalling Java, or modifying code should be taken.
How can monitoring tools help optimize Java performance?
Real User Monitoring helps quickly identify and fix performance issues as experienced by real users, tracking website and application performance trends in real-time. Instance-level diagnostics help you to find the root cause of poor performance, faster, identifying spikes in key metrics like load time and isolating problematic areas of your website or app.
You can also monitor for crashes and errors to detect and resolve issues faster. This results in an improvement in overall application stability and reliability, improves performance, and aids in optimizing Java performance.
Take a free 14-day trial of Raygun Real User Monitoring or Crash Reporting.