Debug JavaScript in Mobile Safari (iOS) in 8 easy steps
Posted Apr 12, 2023 | 13 min. (2761 words)Debugging JavaScript is an inevitable part of web development, and not the nicest one. Debugging tasks always seem to pop up when you’re already buried under piles of work, and a teammate pings you about an issue that was overlooked in testing and has been causing frustration since your last release.
That’s why it helps to be equipped with the developer tools to help you debug faster.
If you’ve made a mobile-friendly website and something is playing up — let’s say, the submit button of your contact form isn’t working on mobile devices — you don’t have the luxury of just pressing Option + ⌘ + C and looking for the error in the browser console. You need to learn how to debug mobile on desktop!
This article will focus on debugging JavaScript code being run in Safari on iOS 6+ devices using the desktop Safari Web Inspector.
(For more about using developer tools to debug on different devices and operating systems, we have a whole suite of articles to cover Microsoft Edge, Chrome, Firefox, Opera, Safari and Visual Studio).
What you’ll learn from this article
Knowing how to debug JavaScript code being run on an iOS device through Safari’s desktop developer tools is a huge advantage and can reduce debugging time dramatically. Gone are the days of using alert calls to debug.
We’ll be using Raygun to find the stack trace and the line of code the error occurred on. You can sign up for a free 14-day Raygun trial here.
The steps we are going to follow are:
- Sample project introduction
- Analyze a Raygun error report
- Set up and connect your device
- Explore the anatomy of Dev Tools
- Add breakpoints to your code
- Step through your code
- Determine the state of your application
- Fix the bug!
So, let’s dive in!
Step 1: Sample project introduction
To demonstrate how to debug an application with Safari’s Web Inspector, we’re going to use a simple Add Person form. This form allows you to enter a first, middle, and last name. On clicking the ‘Save’ button, the form will do a bit of processing, and the data will be sent off to your (imaginary) server.
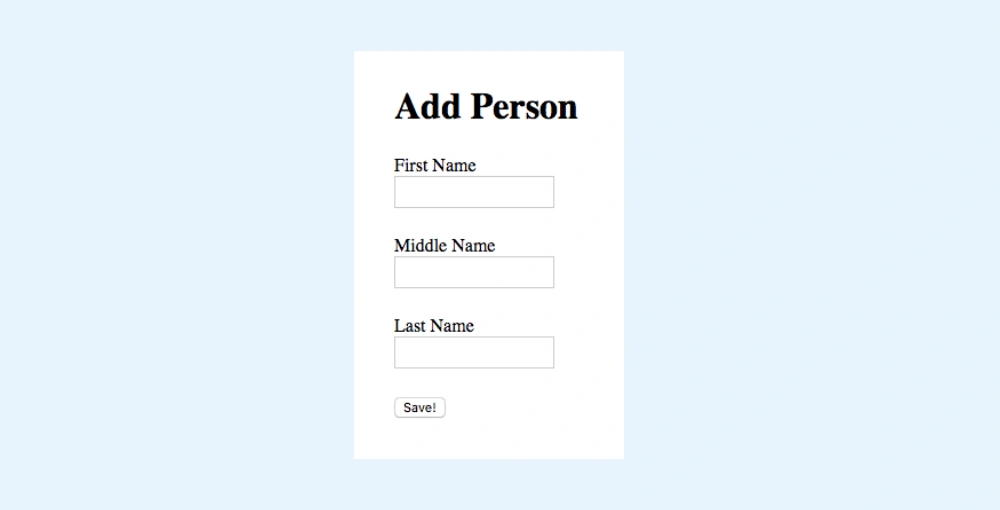
The code for this form has three functions:
- A click handler
- A capitalize string function
- A save function
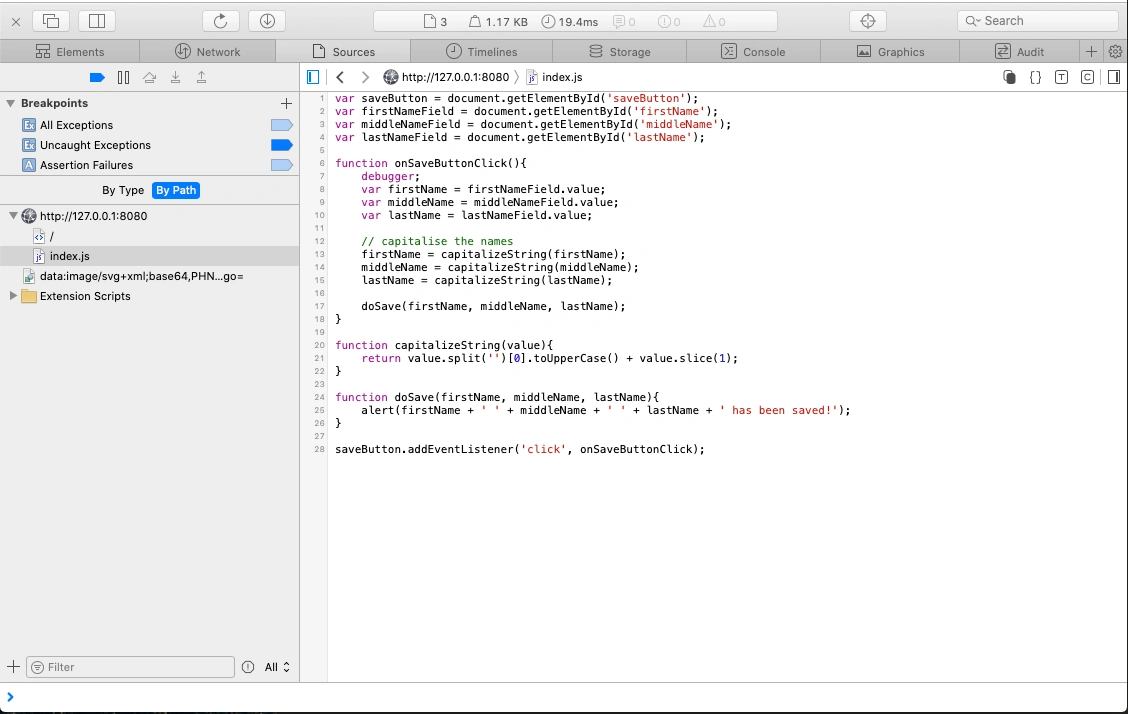
var saveButton = document.getElementById('saveButton');
var firstNameField = document.getElementById('firstName');
var middleNameField = document.getElementById('middleName');
var lastNameField = document.getElementById('lastName');

function onSaveButtonClick(){
    var firstName = firstNameField.value;
    var middleName = middleNameField.value;
    var lastName = lastNameField.value;

    // capitalise the names
    firstName = capitalizeString(firstName);
    middleName = capitalizeString(middleName);
    lastName = capitalizeString(lastName);

    doSave(firstName, middleName, lastName);
}

function capitalizeString(value){
    return value.split('')[0].toUpperCase() + value.slice(1);
}

function doSave(firstName, middleName, lastName){
    alert(firstName + ' ' + middleName + ' ' + lastName + ' has been saved!');
}

saveButton.addEventListener('click', onSaveButtonClick);
Unfortunately, after shipping this to production late on a Friday evening, you start to see error reports coming into your dashboard. There’s a bug, and you need to fix it. Fast.
Step 2. Analyze the Raygun error report
Error reports that come into Raygun have plenty of info you can use to find and fix the error, so let’s have a look at what we’re dealing with.
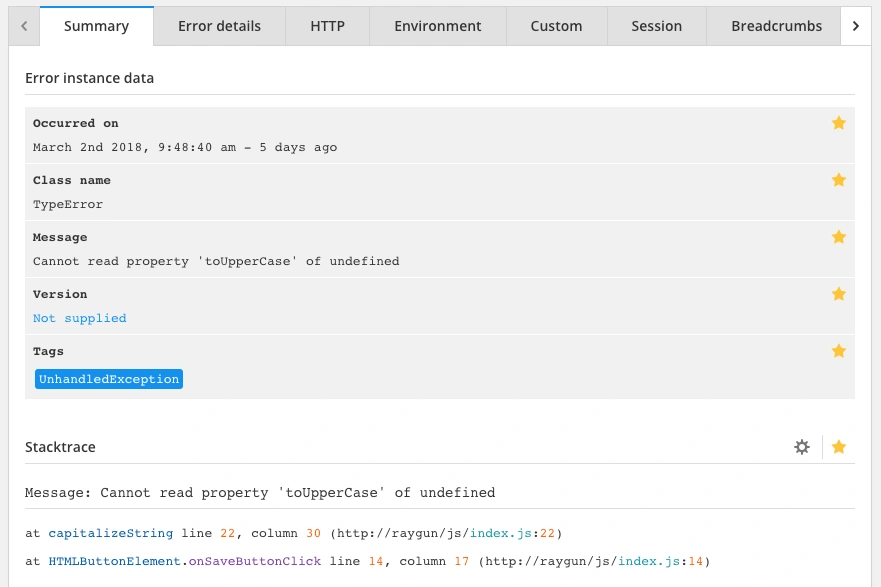
The information you will need to debug the error is located in the Stacktrace module.
The Message part of the Stacktrace is a short overview of what is wrong. In this case, the toUpperCase method is being called on an undefined value.
The Stacktrace tells you where the error occurred and the sequence of function calls that led there. As you can see in the screenshot above, the error happened in the capitalizeString function on line 20 of the index.js file.
Knowing which line triggered the error means you can jump straight to the place where the error occurred and start digging into what has caused the problem.
Even if you obfuscate your JavaScript files on deployment using webpack or other bundling tools, Raygun can also understand the minified version using sourcemaps and help you find the culprit in no time.
Step 3: Setting up and connecting your device
Before we can get started with using the Web Inspector to debug our app, we need to enable both the iOS and OSX browsers for development.
Enable Web Inspector on iOS
On your iOS device navigate to the Settings app and scroll down and select the Safari entry.
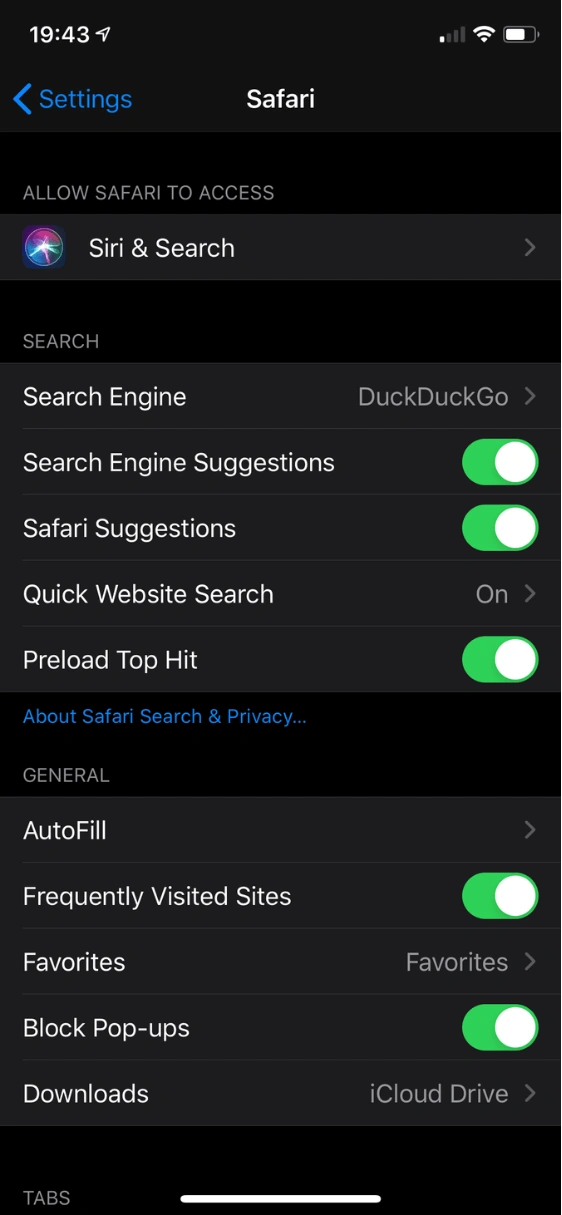
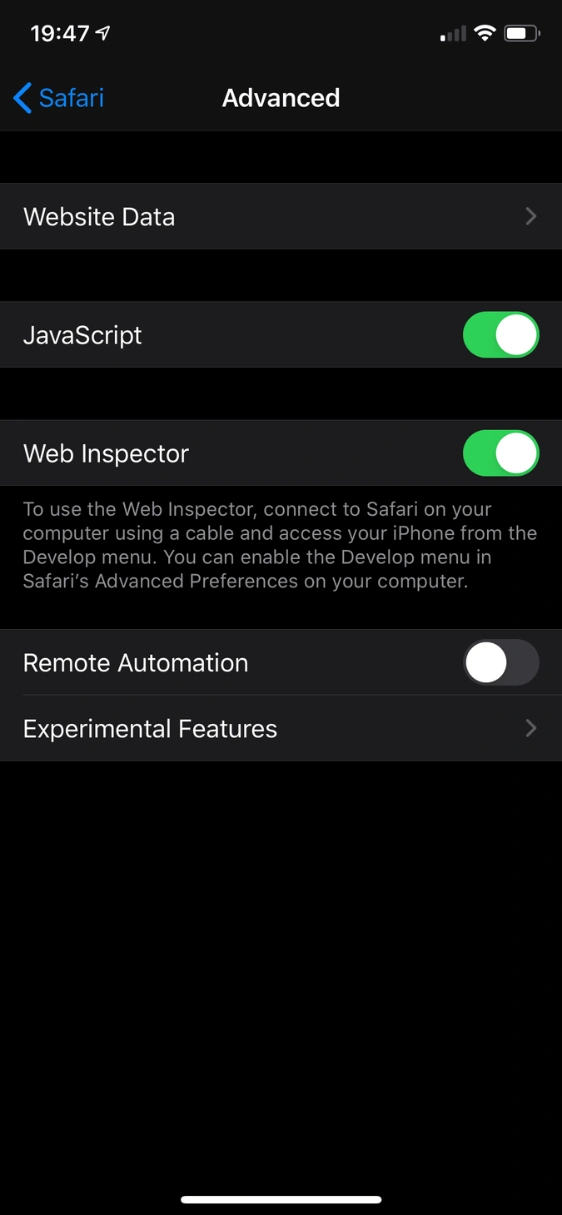
Inside the Safari settings screen scroll to the very bottom and select the “Advanced” option. Then, within the Advanced section, toggle on the “Web Inspector” option.
Enable Develop Menu on macOS
With your device setup we need to launch Safari on macOS and enable the Develop menu. Open Safari’s Preferences dialog by clicking the “Safari” menu item and selecting “Preferences”.
Inside the Preferences dialog, go to the Advanced tab and then check the “Show Develop menu in menu bar” option at the bottom.
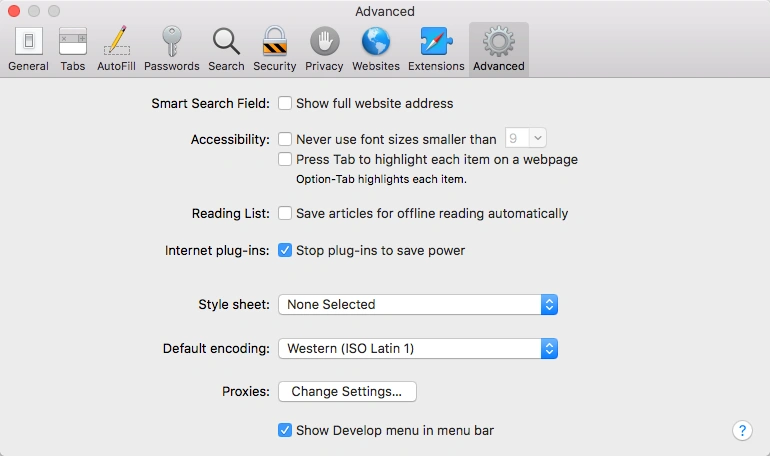
You can now close the Preferences dialog.
Connecting your device
To allow macOS Safari to communicate with your iOS device we need to connect it to your computer via the standard USB cable.
Open up the example App
Finally, let’s open the example web app on your iOS device in a new Safari tab. With that done, we’re ready to go!
Step 4: Exploring the anatomy of Web Inspector
Now the Safari browsers are ready and our device is connected so we can open the Web Inspector.
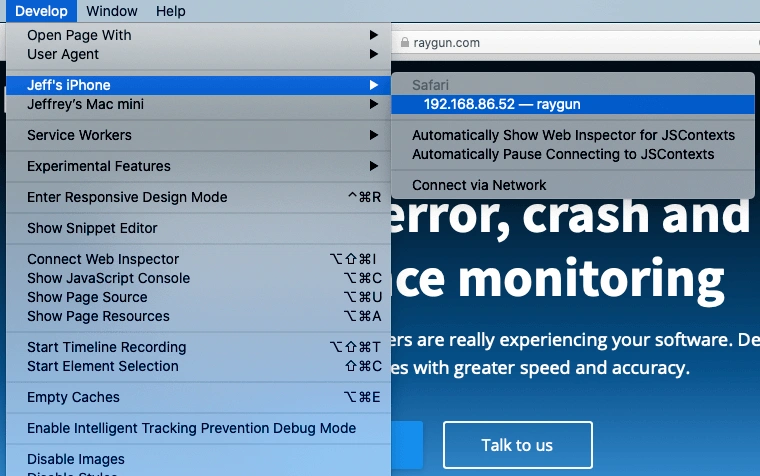
Open the “Develop” menu and you should see an entry near the top showing the name of your device (for example, “Jeff’s iPhone”). Hover on this item so the menu slides open. The new menu will display all the tabs open in Mobile Safari and that the Web Inspector can be connected to. Click the item relating to the example app.
The Web Inspector will now open and we’re ready for debugging. The Web Inspector you see now is identical to the one you would see if you had opened it for debugging from a page in Desktop Safari, it is just a stand-alone instance that is pointing to a tab open on your iOS device.
In the Web Inspector window the Console tab will be active (if it isn’t, select it). This tab allows you to execute arbitrary JavaScript code at any time or to view any outputs from console.log calls.
Try inputting alert('Hello!') and hitting Enter — you should see the alert appear straight away.
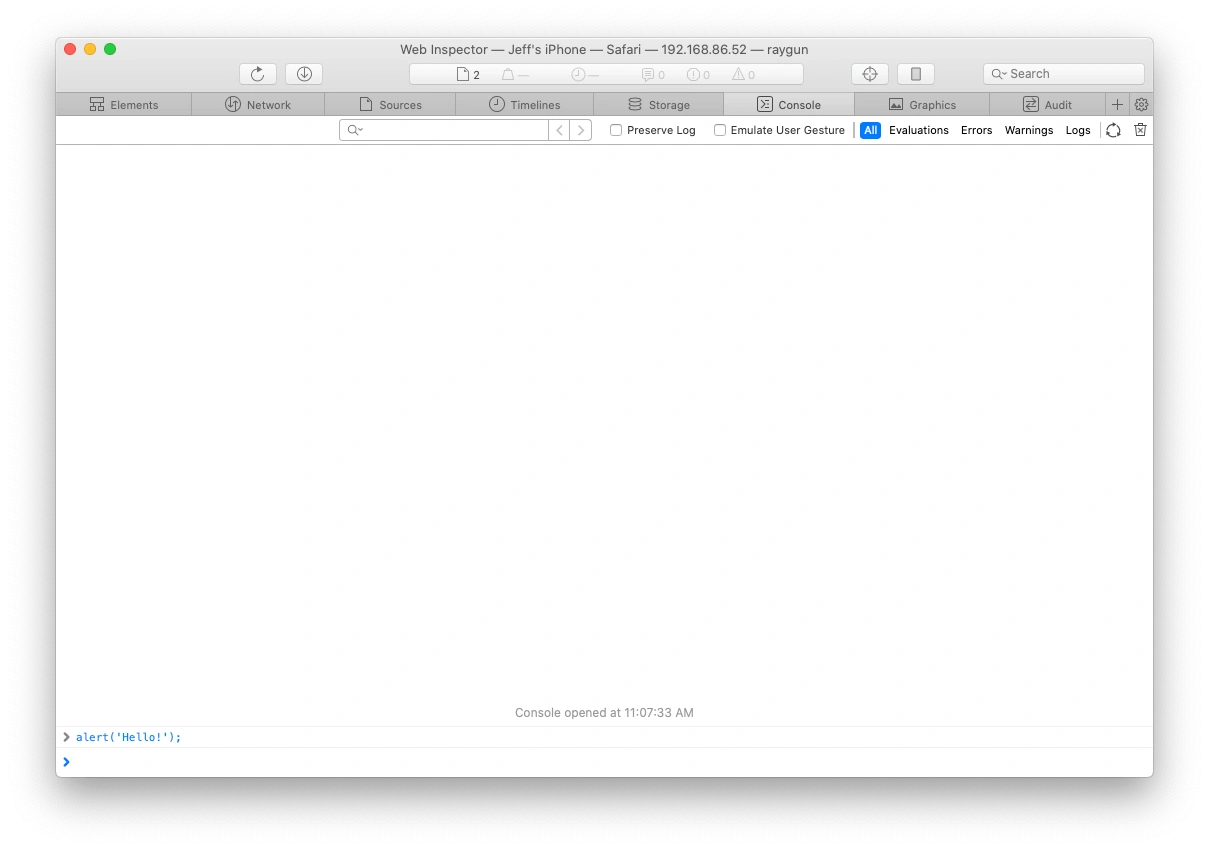
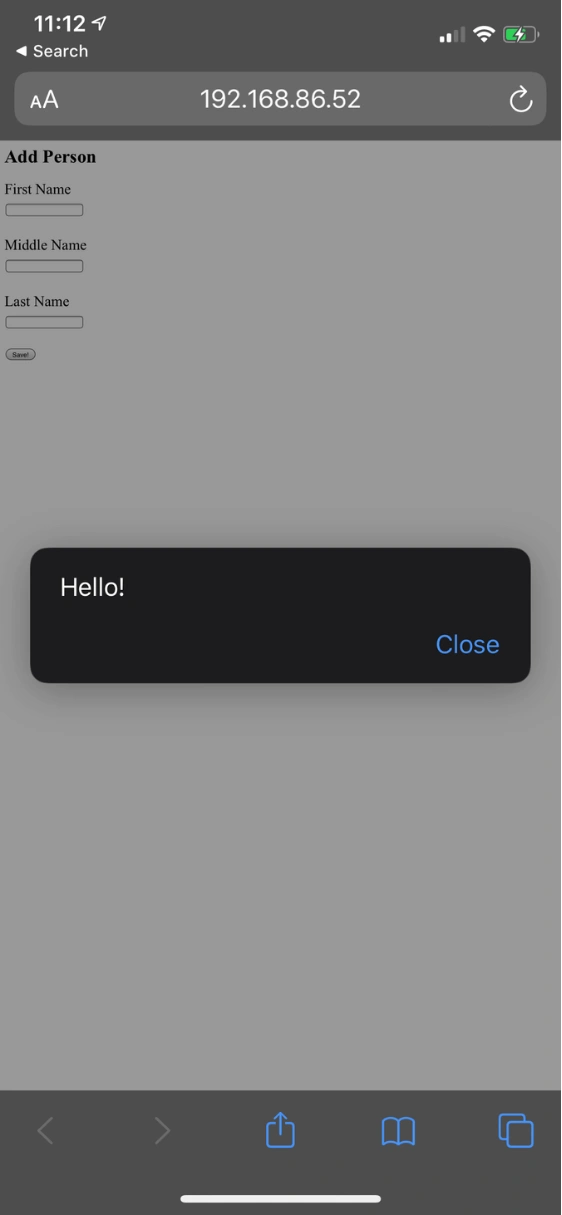
The Console tab is a valuable debugging tool as you can use it as a scratchpad for trying out code and evaluating variables as you diagnose your problem.
To debug the code, you first need to be able to navigate through your source code in the Web Inspector. You do this in the Sources tab.
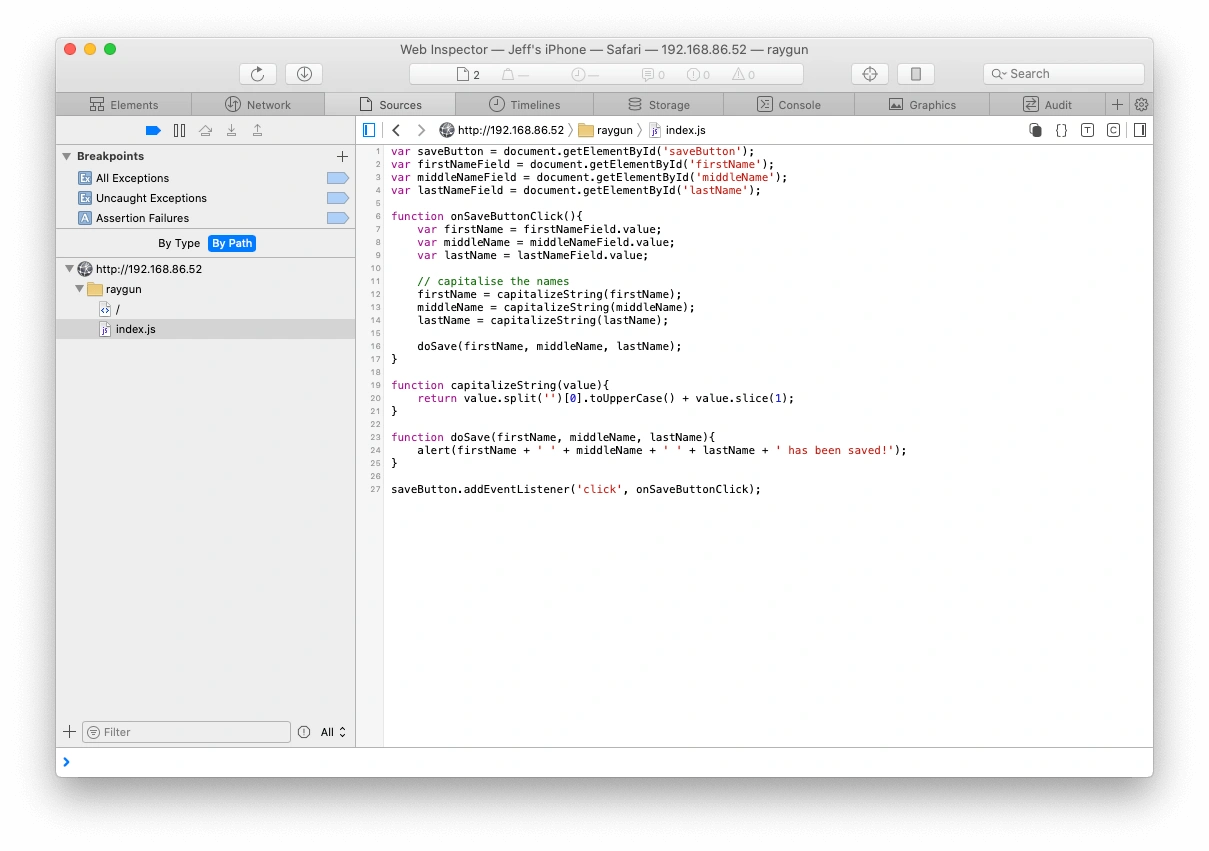
The lower half of the left pane inside this tab has a list of all the source files loaded into the page. You can click any of these file names, and the contents are displayed in the central pane. You can expand an additional pane containing debugging tools by clicking the button at the top right of the tab.
If you have a lot of files, you can search them by using CMD-P on macOS and then start typing the name of the file.
In the app, you know the problem lies in the index.js file, so select it from the list on the left to view its contents.
Step 5: Add breakpoints to your code
Now you can view your code, we want to be able to step through it a line at a time to see where things go wrong. To do this, we use breakpoints. Breakpoints are markers at specific points in the code that stop execution so you can inspect the state of the code at that point in time, and continue execution line-by-line.
There are a few different ways to add breakpoints:
Line breakpoints
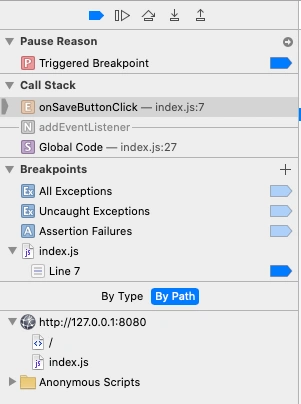
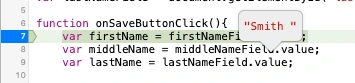
The most common way to add a breakpoint is to find the specific line you want to stop on and add it there. Navigate to the file and line you’re interested in and click the line number. A blue marker will be added on that line and execution will stop every time it hits this line of code. In the screenshot below it will stop on Line 7 of index.js.
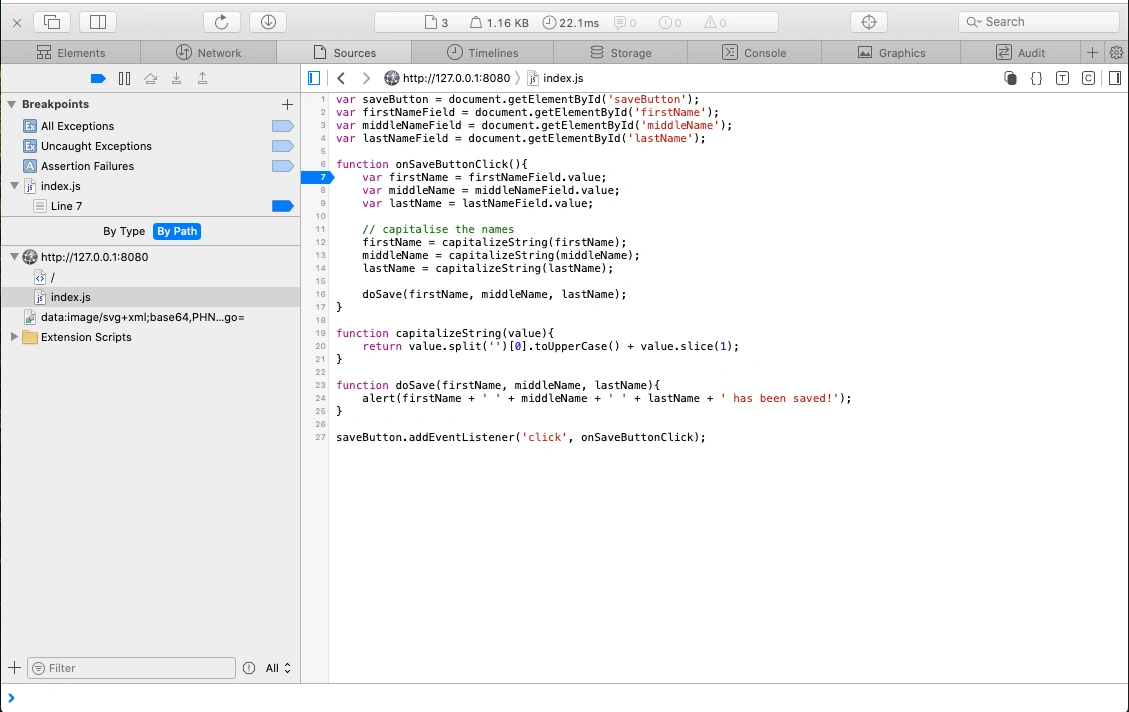
You will also notice that a list of the breakpoints you added is maintained at the top left of the tab. This list is useful for navigating to the breakpoints quickly in a large file, or temporarily disabling them by clicking the marker beside the entry in the left panel.
To remove a breakpoint, right-click the line marker and select “Delete Breakpoint”.
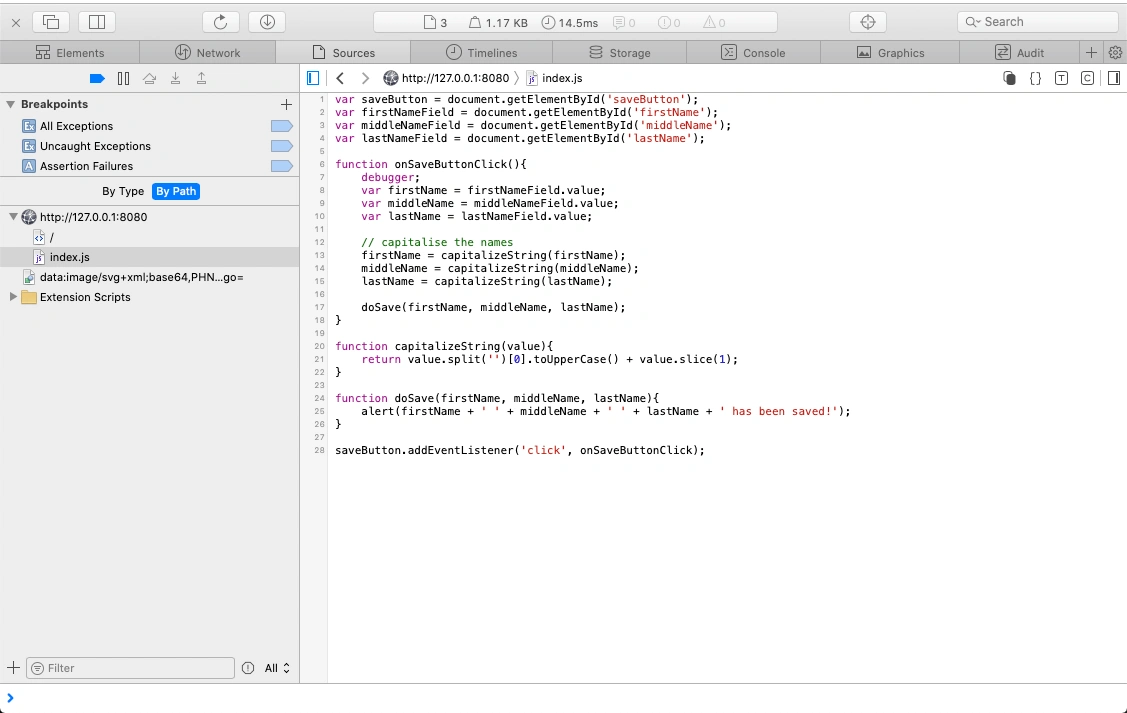
Programmatic breakpoint
You can also add breakpoints programmatically which can be useful if you don’t want to search through your code in Web Inspector when you already have it handy in your IDE. You can also use this approach to conditionally introduce breakpoints, for example at certain iterations of loops, or if the code runs on page load and there’s no time to add the breakpoint manually.
To do this, you add the debugger; statement at the position you want to break the execution. The code below will have the same effect as the Line Breakpoint above.
Error Breakpoint
Web Inspector has a handy feature which will stop execution when it hits an exception in your code, allowing you to examine what’s going on at the time of the error. You can even choose to stop on exceptions that are already handled by a try/catch statement.
To stop when any exception happens, click the arrow icon beside the label “All Exceptions”. You will see it darken when activated. To only stop when an uncaught exception occurs, click the arrow icon beside the “Uncaught Exceptions” label.
Step 6: Step through your code
Now that we know how to put breakpoints into our code we now want to step through each line so we can figure out what’s going wrong. First, put a breakpoint on Line 7 - just inside the Add button’s click handler so we can start at the beginning.
In the previous section, we inferred from the Raygun error report that the error came from the capitalizeString method. This method is called three times, so, which instance is the culprit? You can look a little closer at the Stacktrace and see that it was the call that came from Line 13 which caused the error. You know that line 13 relates to the Middle Name value. Therefore, you should focus your effort on reproducing the error by crafting your input correctly.
With this extra knowledge, you can fill in the First and Last Name fields but leave the Middle Name blank to see if this triggers the error. Hit the Save button. From here, the Sources tab will open where you can see that the breakpoint has activated. You can now start to step through the code. To do this, you use the buttons in the top left of the Sources pane.

- The first icon, the breakpoint arrow, can be used to disable or enable all breakpoints
- The second pauses/resumes execution of your code and continues until the next breakpoint
- The third icon, an arrow moving over a line, “steps over” the current line, moving us on to the next line
- The arrow pointing to the line “steps into” the next function call that is on that line
- The last icon, the arrow pointing away from the line, steps out of the current function call, back up the call stack one level
You’re going to use these to step all the way to your capitalizeString function. So from Line 7, use the “Step over” button until we get to Line 13. The active line is shown with a green background. You can now use the “Step into” button to move into the call to the capitalizeString function, jumping from line 13 to line 20.
To learn more about the differences between “step over” and “step into” when debugging JavaScript, check out this article.
Navigating the call stack
When you’re moving through the code like this, you might want to jump back to a parent function to check what was happening at that point. To do this, use the Call Stack section, which lists all the functions that have been passed through to get to this point in your code — exactly the same as the Callstack shown in the Raygun error report.
You can simply click on an item in this list and you will be moved back to that function. Bear in mind that the current position in the execution doesn’t change, so using the Step Over buttons will continue from the top of the call-stack.
Step 7: Determine the state of your application
Now that you’ve navigated to where your error happened, we need to examine the state of the application and figure out what’s causing the error.
There are a bunch of options for figuring out what values variables contain and evaluating expressions before the code moves on. We’ll look at each in turn.
Mouse hover
The simplest way to determine the value of a variable is to just hover the mouse over it and a tooltip will pop-up with the value. You can even select a group of expressions and hover over the selection to get the output of the expression.
Watch expressions
You can add expressions to the Watch Expressions panel which displays the current value of the expression as you move through the code. The Watch Expressions panel is handy to keep track of how more complex expressions change over time.
You add these by clicking the “+” button at the top of the panel, entering the expression to watch and hitting enter.
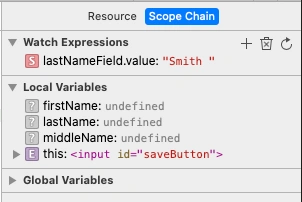
Local Variables
The Local Variables section seen under the Watch Expressions section displays a list of variables currently within scope and their associated values. The Local Variables panel is similar to the Watch Expressions panel but is generated by the Web Inspector automatically. This section is good for identifying local variables and saves you explicitly adding them to the Watch Expressions list.
Console
Finally, the Console tab is a great tool for checking expression values and experimenting with code. Just switch back to the Console tab, type some code and hit enter. Web Inspector will execute the code within the context and scope of the current breakpoint.
Step 8: Fix the bug
Switch over to the Console tab and let’s start to break down the line that caused the error so you can fix it.
First, check the output of the value.split('') call (which is intended to grab the first character and then call the toUpperCase function on it).
Executing the expression in the Console shows it returns an empty array—this is where the error comes from! Since it returns an empty array and we try to call toUpperCase on the first item in the array (which is undefined, since there are no items in the array at all) an error results.
You can verify this by entering the full expression into the Console. To fix this problem, you need to check to see if the string is empty or undefined prior to parsing it. If it is, you need to return an empty string back without doing any processing.
function capitalizeString(value){
    if(!value || value.length === 0){
        return '';
    }

    return value.split('')[0].toUpperCase() + value.slice(1);
}
Summary
That wraps up this quick guide to debugging JavaScript in Mobile Safari with Web Inspector. It is really simple to enable this remote debugging and get the full use of the Safari Web Inspector for pages open on an iOS device. Fortunately, developer tools for debugging on mobile have come a long way and this has made tracking down mobile-specific bugs so much easier.
You should be able to put it to use when trying to track down your next Mobile Safari bug. It is really worthwhile taking the time to master these tools to level up your debugging skills! There are a number of other great features in the Web Inspector, so we advise you to spend some time exploring.
If you’d like to learn more, we wrote a whole guide on JavaScript debugging in major browsers. Debug JavaScript using the same process as above in:
As we’ve just shown, Raygun is an awesome tool that can make tricky tasks a whole lot easier. If you’d like to see for yourself, you can sign up for a free 14 day trial anytime - right now if you want.