JavaScript debugging made easy with source maps
Posted May 27, 2015 | 4 min. (744 words)JavaScript debugging with source maps sounds complicated – but it definitely doesn’t need to be. Source maps are a useful tool for debugging JavaScript and fixing minified JavaScript code without the hassle of determining where in the original code an error occurred. They provide a way to translate between minified code, designed to decrease webpage load times to the source code the developer writes.
This post gives an overview of setting up and using source mapping in your browser as well as within Raygun.
If you’re unfamiliar with source maps it’s probably best to see how they work within the browser. You can read about how to generate source maps here.
Source maps are natively supported by both Google Chrome and Firefox as well as IE11, this means that any minified JavaScript files with a source map comment at the bottom will automatically link to its sources so long as the mapping and source files are in the correct locations.
This allows errors to be mapped onto the original source code instead of reporting errors on only the minified script.
For instance if a minified file example.min.js has the following comment at the end of the file:
//# sourceMappingURL=example.js.mapThe browser will load the mapping file example.js.map in the same directory as the minified file. Any source files specified by mapping file will then be loaded into the Sources window in the browser console.
In addition to showing the source files in the sources window, any errors which happen within the minified file will automatically be mapped into the source files allowing for easy debugging.
Now that you have an idea about how source maps can be used to review code and debug locally, here is an overview of how JavaScript debugging with source maps is easier with Raygun Crash Reporting.** **Debugging script errors reported from client’s browsers becomes a bit faster.
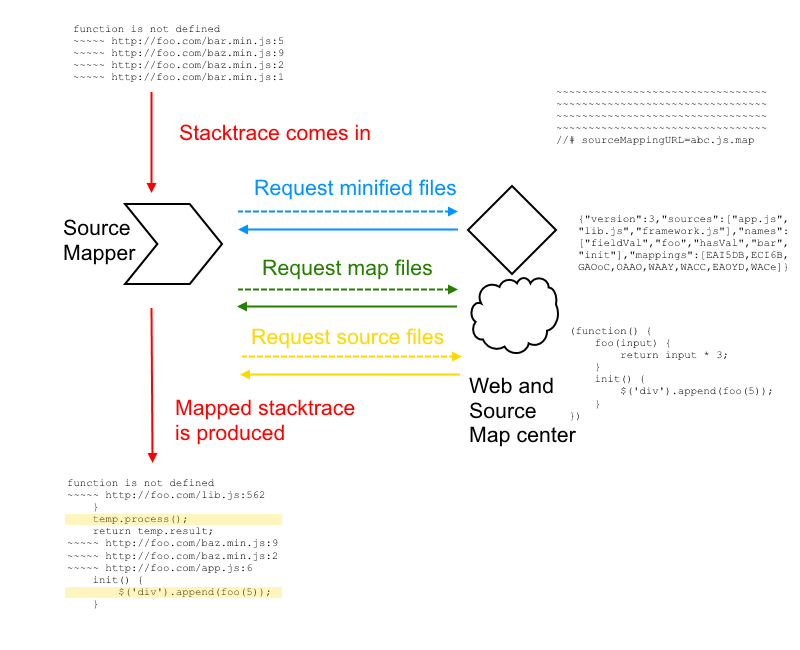
When an error occurs in the JavaScript of a website using Raygun an error report including stacktrace is sent to Raygun.
Contained within the stacktrace are the URLs of the scripts in which the error occurred.
Given these URLs Raygun can download each script file and check for a source map comment. If the comment exists it tries to map the line of the stacktrace onto source code. This is done by downloading the map file specified.
If a map file is available Raygun can then perform the mapping which converts the lines numbers of the stacktrace on the minified code into line numbers on the source files, it also resolves the source files and symbol names.
Given the source file URL we can additional requests for the source files. If we can retrieve these we insert a snippet of the source code into the stacktrace to give more context to the error:
All of this can be done across the public internet if the files are hosted at the correct URLs and are publicly available.
For many businesses hosting JavaScript files publicly is not in their best interests. For this reason Raygun provides a source map center, this is a private store of JavaScript files to be used in the source mapping process. It allows source mapping to work without hosting anything publicly. JavaScript debugging with source maps makes the whole process much easier, especially when you use a crash and error reporting software like Raygun.
If a file is uploaded into the source map center it will be used instead of requesting a file from the internet. All that is required is that the file be labeled with the URL it would be accessed from if it were to be publicly hosted. In most cases this is easy to figure out. For minified files it’s simply the address your minified files are served from. Determining the address of the map and source files may be a bit harder but can be determined by looking at the relative URLs in the generated sourceMappingURL comment in the minified files as well as the sources section of the map files and figuring out the absolute URL based on the address of the hosted minified files.
Hopefully this quick guide to JavaScript debugging with source maps has given an overview of how Raygun can be used to produce powerful error reporting for minified JavaScript code in production environments.
Related articles
Getting started with JavaScript source maps and Raygun
