C# Debugging tools and techniques
Posted Apr 4, 2023 | 8 min. (1577 words)Working in C#, as with any language, you’ll soon find that that you need to do some debugging. With C#, thankfully, due to a plethora of debugging tools and techniques, troubleshooting is usually straightforward.
Common debugging techniques
Debugging is highly context-sensitive, and the languages and tooling vary widely. In this post, I’ll be covering specific C# debugging tools and techniques in the next section. However, there are a few things you’ll need to know in any debugging situation.
Know your environment
Software does not execute in a vacuum—it is intricately tied to the environment. Software running in an Integrated Development Environment (IDE) in Debug mode can run differently to the same software running in the IDE on the same system in “Run” (non-debug) mode.
Run that same software again directly from the command line, and again the context is changed, so the execution results can vary. These variances can all occur within a single system, so you can imagine that it’s also possible to get varying results when software is distributed to hundreds or thousands of servers.
Programs will use and respond to environmental factors such as environment variables, system configuration, dependencies, and language versions. If you know which of these factors affect the behavior of your program, you’ll have an advantage when troubleshooting behavior that varies from one environment to the next.
Environmental consistency is a common problem in software development. Docker and container technology is a powerful solution.
Know your debugging tools
Most modern IDEs have very advanced debugging tools built in. These powerful tools can decrease the time required to investigate and resolve a bug. The better you know the tools, the faster and more effective you’ll be in tracking down the source of a bug.
Know your code (or learn it)
When we write code, we know what it’s supposed to do. We know the original intent, so it’s logical to think that this should make it easier to debug. This is true to a point—however, as software gets more complex, that familiarity loses its power to help us debug. It can be challenging to remember the purpose and structure of code written just a few weeks ago, even if you wrote it yourself.
To complicate matters further, we don’t always get to debug our own code. Other developer’s code is often an opaque fog of unfamiliar conventions and undocumented intent. How does one debug that?
In each case, studying the code as it executes is the most powerful technique. Step through the code, and pay special attention to branches, where execution takes different paths depending on the value of a variable, or the result of a method call. Develop a deep understanding of the code, its purpose, and its flow, to understand why it is not working as expected.
Instrumentation
Debugging code in a local development environment is convenient and fast. There’s no concern for customer impact- we can iterate over program executions repeatedly. This is not true for operational environments. Step debugging, even in non-production environments like DEV and QA, is impractical. Doing so in Production environments is out of the question.
Code instrumentation is the best way to make a program’s execution visible in an operational environment. Logging execution data to a centralized store makes it available to your entire team, and company. Your code should be written to log data to a central store. Instrument your code to log information and errors to a centralized reporting database. Proactively gather data that may indicate an operational problem, so you can detect those problems before they affect your customers.
Exception handling
The C# language and runtime have features that support exception handling. Exceptions occur when application execution encounters an unexpected or unsupported state. They can be mathematical, such as a “divide by zero” instruction, or runtime errors such as a null reference to an object. Careful exception handling, using try/catch blocks and other C# language features, prevents a program from terminating completely when an exception occurs. Tools such as Raygun Crash Reporting make it easy to log runtime exceptions in operational environments.
An ounce of prevention
The only thing better than a “dead” bug is one that was never created. “Defensive” coding through unit tests and Test-Driven Development can prevent new bugs from ever being introduced. They also serve as documentation—for debugging purposes, a test suite with clearly-named tests can be more valuable than pages’ worth of technical documentation. Use unit tests and TDD to prevent bugs.
When a bug is found, write unit tests specifically for that bug, to make sure it doesn’t creep back in.
C# Debugging tools and techniques
1. Step debugging
Step debugging is a powerful tool for deep inspection of a running program.
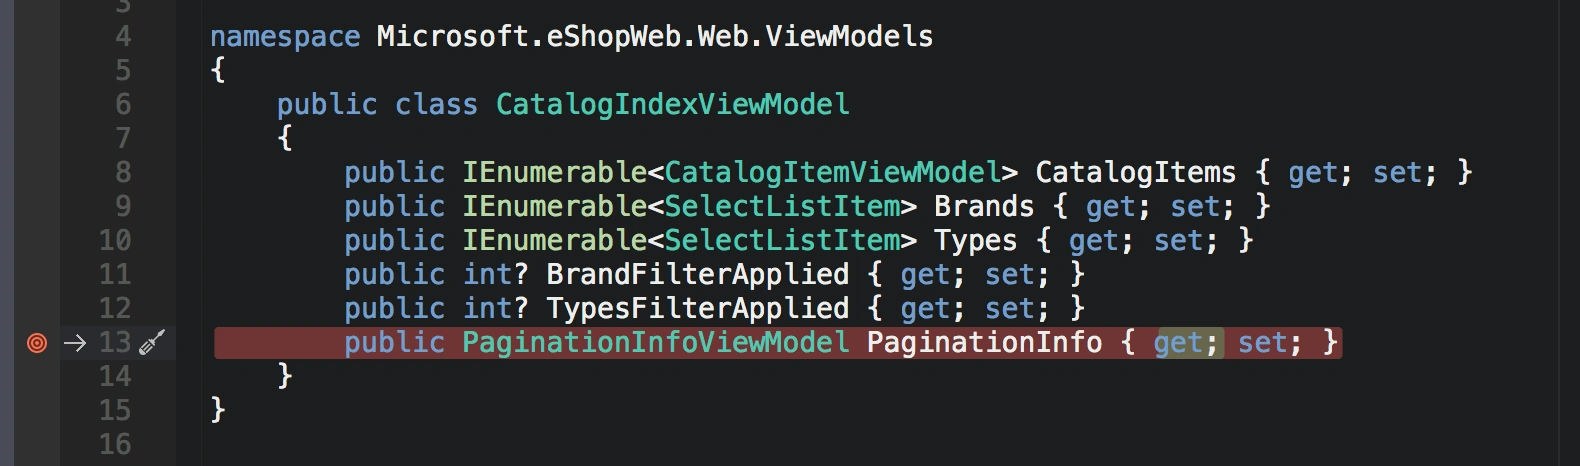
While C# can be written in a text editor, it would be difficult to compile and essentially impossible to debug. Step debugging requires an IDE that can set breakpoints. A breakpoint is typically represented as a little red dot in the left “gutter” margin of an IDE editor. When run in debug mode, execution will halt at the breakpoint. You can then inspect the state of the application, while it is in “suspended animation,” so to speak.
All versions of Visual Studio, including VS Code, VS Community, and paid versions (Professional and Enterprise) support C# breakpoints.
I like VS Code a lot, and it does support C# debugging, but the experience just isn’t as good as the Community and paid versions. Visual Studio Community is free, so if you’re writing C# apps, I recommend it over VS Code.
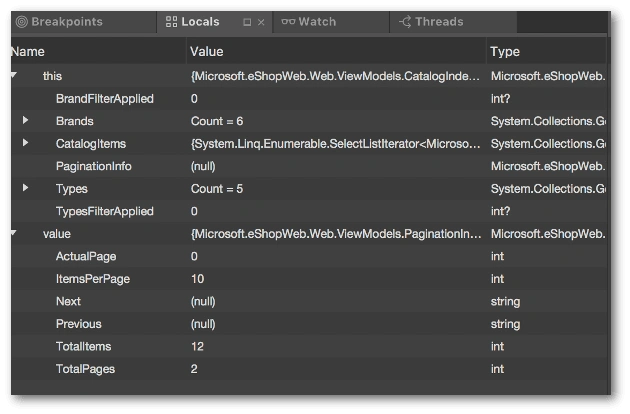
When execution is stopped, you can inspect the state of the local variables. Locals are the variables in-scope at the breakpoint, which is usually the instance and local variables of the object method currently executing.
The state of variables is a crucial factor in bug investigations. You should be able to predict, given an input, what the state should be as the program executes. If variables take on unexpected or incorrect values, that’s typically an indication of a bug.
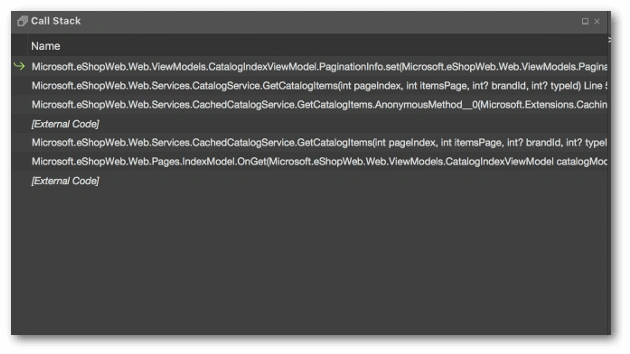
The call stack is the chain of instructions currently executing. The full execution of a program interaction—for example, a button press in a webpage—usually results in one method calling another, then another, until the request is fully processed. Each call goes on a stack, stored in the processor. The execution of the program progresses “down” the stack until the final call is completed. Control passes back “up” the stack as the method executions complete.
When a breakpoint is hit, the call stack indicates the flow of the program. This is useful in understanding how branches affect the flow of a program. An if statement may lead down one flow, or another, depending on the original input and the state of the variables. The call stack window in Visual Studio allows you to navigate “up” the stack by clicking on the items listed. You can then see the values of the local variables in the methods as you traverse the stack.
Tracing through the call stack will show you exactly how a program is executing, and the state of the variables tell you why. You can track down the root cause of almost any bug by inspecting the variables and the call stack.
2. Profiling
.NET profilers are available in paid versions of Visual Studio, and stand-alone tools. Some stand-alone tools are free, others are commercial. They all do mostly the same thing—hook into the .NET runtime and “watch” the execution of a .NET program.
As the program executes, the profiler records the method calls to a log, then displays the control flow in a variety of visual formats. Profiling can help you debug by showing you the control flow of an application while it is executing in a non-debug mode, without having to run it in an IDE.
The profiler will run the application for you, or you can attach to a running process (this is great for IIS applications.) They are also great for troubleshooting performance problems. The report of a profiler will show you how long each method took to execute, so long-running methods stand out clearly.
3. Logs and traces
“Debugging in production” is something of an oxymoron—strictly speaking, there’s no such thing. There are tools, including profilers, that can give you more detail, but they come with compromises. Attaching inspection tools to an application runtime always degrades the performance of the application. This may be an option in DEV or QA, but it’s not something you can use in a production environment.
This is why it’s so important to write well-instrumented code. Logging and tracing frameworks can send execution data, asynchronously, to centralized stores, and real-time monitors. When problems occur in operational environments, these tools provide essential visibility into the behavior of an application. They offer one of the first lines of investigation when dealing with an incident in any environment.
Conclusion
Debugging code is an integral part of software development. Each bug is a little mystery to be solved. Why is the program crashing? Perhaps even worse—why isn’t it crashing and producing the wrong results? It’s important to understand the tools available to help you investigate these mysteries and solve them quickly. It’s equally important to know how to develop a theory of their causes and track them to their source.
You can try Raygun Crash Reporting for free for 14 days, no credit card required. It’s one of the most powerful debugging tools available, and it’s coded by .NET devs.