The 9 best Real User Monitoring tools: A comparison report
Posted Dec 8, 2021 | 11 min. (2176 words)What is Real User Monitoring?
Real User Monitoring (RUM) provides visibility into the performance experience of live users interacting with your web, mobile, or single-page apps.
RUM tools emerged to bridge the gap between application performance metrics and the impact on real people. These days, user experience is increasingly factored into the development process, but that still doesn’t stop slowdowns. JavaScript on the front-end can be unpredictable, and complex user environments can create all sorts of performance problems and significantly impact your bottom line. After all, poor software quality costs US businesses $2.08 trillion annually, and the stakes are only getting higher.
RUM tools increase visibility and help teams pinpoint issues that might have otherwise flown under the radar. Ultimately, this means the business can deliver faster digital experiences and achieve objectives. After all, performant software is profitable software.
This guide will lay out the basics of RUM, while helping you zero in on the best tool for your specific situation.
Why Real User Monitoring?
To deliver the best UX, developers need performance insights at the code level. They also need to know which users are affected by issues to replicate the problem and solve it faster. Google is also pushing these tools withthe addition of Core Web Vitals (CWV) to their well-established Web Vitals initiative. Each of these new metrics represents a critical aspect of the user experience: content loading speed, interactivity, and visual stability. Google has now added Core Web Vitals to their search algorithm as a ranking factor, and is actively encouraging developers to enlist a real user monitoring tool to measure and optimize Core Web Vitals scores. (To learn more about Core Web Vitals and the role of RUM, see our whitepaper).
Benefits of a Real User Monitoring tool
- Easily identify poor front-end performance impacting end-users
- Analyze trends in application performance
- Measure the impact of performance optimizations you’ve made
- Understand user behavior in your application
- Understand the impact that poor performance has on the user experience
How does RUM work?
RUM tools collect data directly from a user’s browser and send it to a centralized dashboard.
Usually, RUM tools use a lightweight SDK to capture performance and usage information when your application is running on an end-user’s browser or device. They send this data to a centralized display, providing it in helpful graphs and charts, so you can dig into performance insights about your application and devise strategies to resolve issues.
Selecting the right RUM solution
If you’re in the market for a RUM solution, here are some questions to keep in mind as you begin narrowing down your options:
- What are your objectives with a performance monitoring solution?
- Who are the different stakeholders using the tool? How do their needs/wants differ?
- How well integrated is the solution with other core tools your team is using?
- How easy is it to use?
- What is the installation process like?
- How do the solutions differ at each price point?
- Does the solution support both your current situation, along with potential future requirements? To help you start your search, let’s compare nine leading RUM tools.
1. Raygun Real User Monitoring
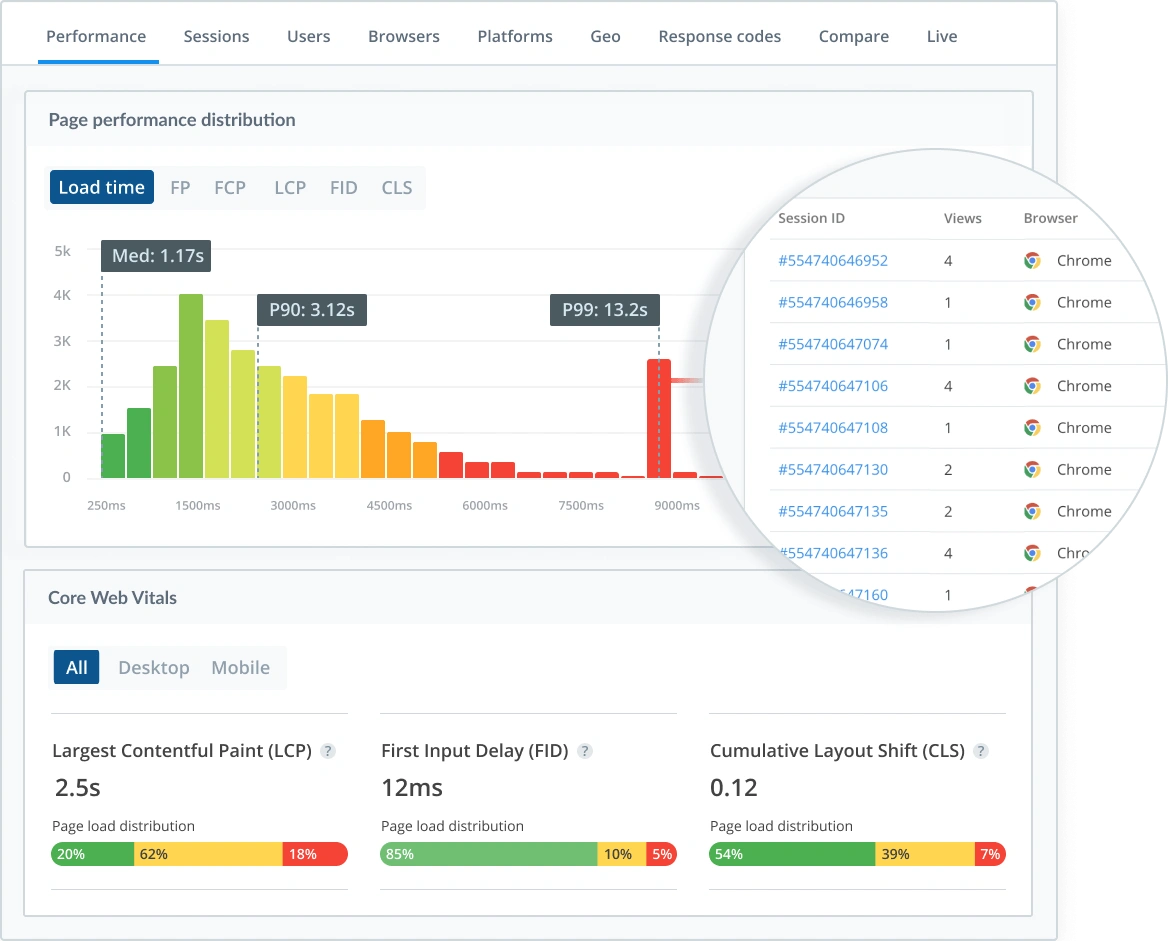
Raygun helps software teams deliver the highest quality experiences every time.
Real User Monitoring captures the performance metrics of every user session and highlights the biggest improvements you can make to your web, mobile, or SPA. To help isolate and diagnose issues, page performance breakdowns are viewable for every user session so you can see which specific assets caused the page to load slowly.
Features
- Performance tracking
- Crash reporting support for all major languages
- Customer Experience Monitoring
Price
Charged per session, and users can choose to be billed monthly or annually.
Pros
- Easy to set up
- Works with web, mobile, and SPAs
- User-centric performance metrics
- Measures every user session (no sampling)
- View the performance story of individual users
- Has error, crash, and performance tracking in one platform
When to choose Raygun
Raygun is designed to help developers create the best possible digital experiences, offering complete visibility into the cause of performance problems so you can prioritize what matters most — your customers.
Raygun RUM is trusted by thousands of companies including Avis, Samsung, and Domino’s Pizza, and is a category leader on review site G2 Crowd. You can try it out with a free 14-day trial.
How to install
Regardless of which platforms you’re using, you’ll be up and running with Raygun in minutes. You just need to add a new library to your application with only a few lines of code.
- For web applications, include the Raygun4JS provider in your web pages.
- For Android, add the raygun4android jar to your dependencies and update your AndroidManifest.xml. Then, add a few lines of code to initialize the RaygunClient, and you’re ready to go.
- For tvOS, macOS, and iOS, include the raygun4apple framework and add a few Swift or Objective-C code lines to initialize the client.
- For React Native, install the raygun4reactivenative module and initialize the RaygunClient in your code.
Integrations
Raygun integrates with a long list of third-party services:
- Connect error groups or APM traces to Github issues.
- Two-way syncing with Jira; close issues in Raygun via Jira ticket status and assign them to Jira team members from Raygun.
- Send error and performance alerts to Slack channels and assign them from the Slack application.
- Route crash report notifications to an Amazon SQS queue.
2. Akamai mPulse
Akamai’s mPulse captures real-time user monitoring data and provides the tools to optimize your website’s performance. It also features an emphasis on return on investment (ROI) in your web enhancements.
Features
- Correlate user interactions to business outcomes
- Create custom dashboards for tying web changes to revenue goals
- Single-page application support
When to use it
When traditional testing isn’t enough, mPulse helps you plan and create accurate test plan results.
Price
mPulse offers three pricing plans: a free tier called Lite, an on-demand tier, and enterprise pricing.
Pros
- Flexible testing and monitoring plans
- Support for single-page applications
Cons
- Limited Reporting options
- No link to error reports
3. Pingdom
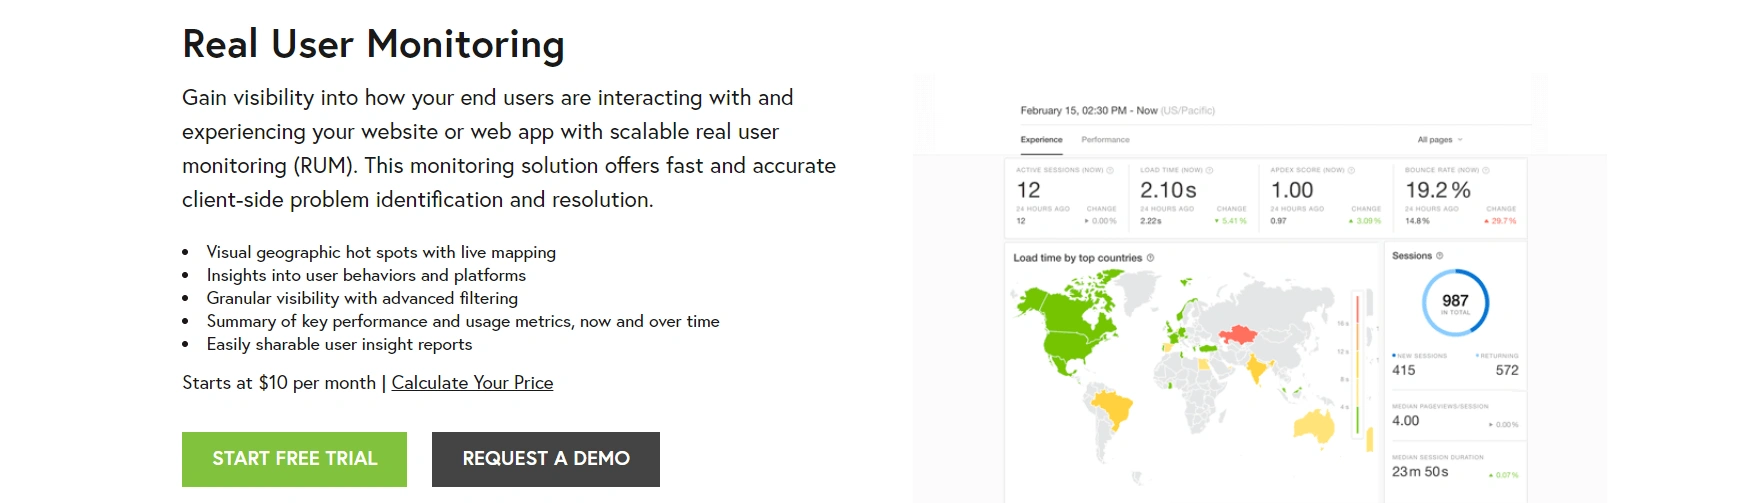
Pingdom specializes in performance monitoring, including transaction and uptime monitoring.
With Pingdom, you can filter data from specific users to gain greater insight into the regional performance of your website. By setting your performance levels for the standard you want to deliver, you can ensure you’re delivering the intended site experience to your most valuable customers.
Features
- Website and server monitoring
- Detailed reports
- Live map
- User experience monitoring
- The capability to share data with others
- Mobile accessibility
- Page load performance
- User behavior metrics
Price
- Starts at $10/month, depending on page views
Pros
- Cloud-based solution
- Monthly reporting emails
- Comprehensive and broad monitoring solution
Cons
- The upper limit on pricing reaches thousands of dollars a month
- No error monitoring available
- Seems to struggle at scale, and might not be cost efficient if you’re monitoring many applications
4. New Relic Browser

With the release of New Relic One, real user monitoring is now available out of the box alongside APM, Infrastructure and serverless monitoring, and log management. Its primary value proposition is improving browser-side performance. But because it’s part of their platform offering, it requires installing an agent.
When to use it
New Relic One’s RUM is only one of more than 15 different capabilities. It’s best suited for organizations looking for a broad set of capabilities and not specialty real user monitoring.
Features
- Page loading statistics
- Error detection and isolation tools
- Part of New Relic One’s full-stack tools
Price
Starts at free for one user, $99/month for each additional user. You’re asked to contact New Relic directly for pro and enterprise tiers.
Pros
- Single page application support
- Plenty of tutorials to help get started
- Many tools in the performance suite
- A good choice for enterprise
Cons
- Requires an agent
- Can get expensive, as it’s priced per user
- Many features are only available via a premium account
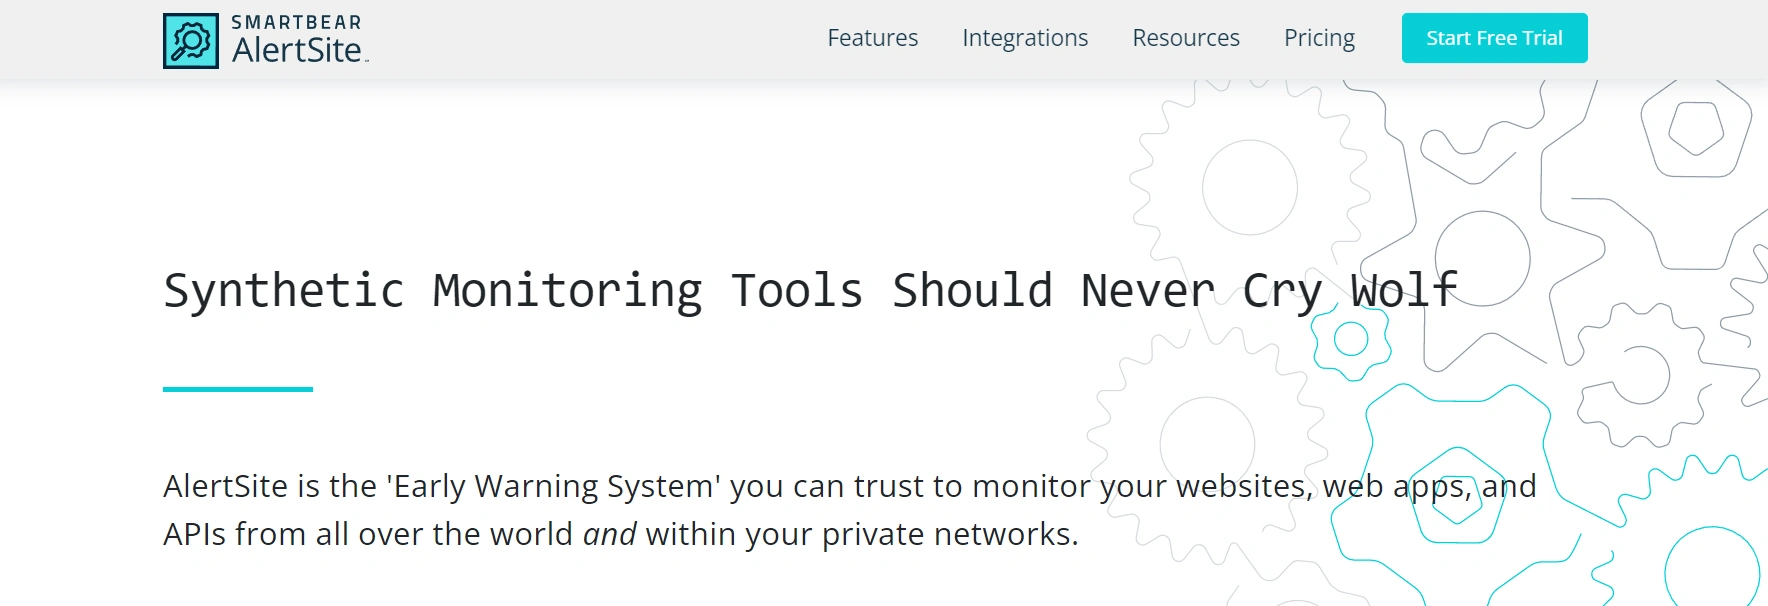
5. SmartBear
SmartBear Software offers 16 commercial products in API readiness, software testing, monitoring, code collaboration, and code optimization. Two of their offerings, SoapUI and Swagger, are open source.
SmartBear’s RUM solution is called AlertSite, which enables you to monitor for availability, performance, and functionality.
When to use it
If you need a robust monitoring application that enables you to monitor websites, apps, mobile sites, mobile apps, and API workflows, SmartBear is a viable choice.
Features
- Web monitoring
- API monitoring
- Application performance monitoring
- Real-time alerts
- Hybrid deployment
Price
There are three pricing plans (available by quote): internal monitoring, external monitoring, and hybrid deployment.
Pros
- Free training and support
- Minimal alerts
- End-to-end infrastructure monitoring
Cons
- Limited error handling capability
- Some RUM limitations
- Long load times for web interface
6. Atatus
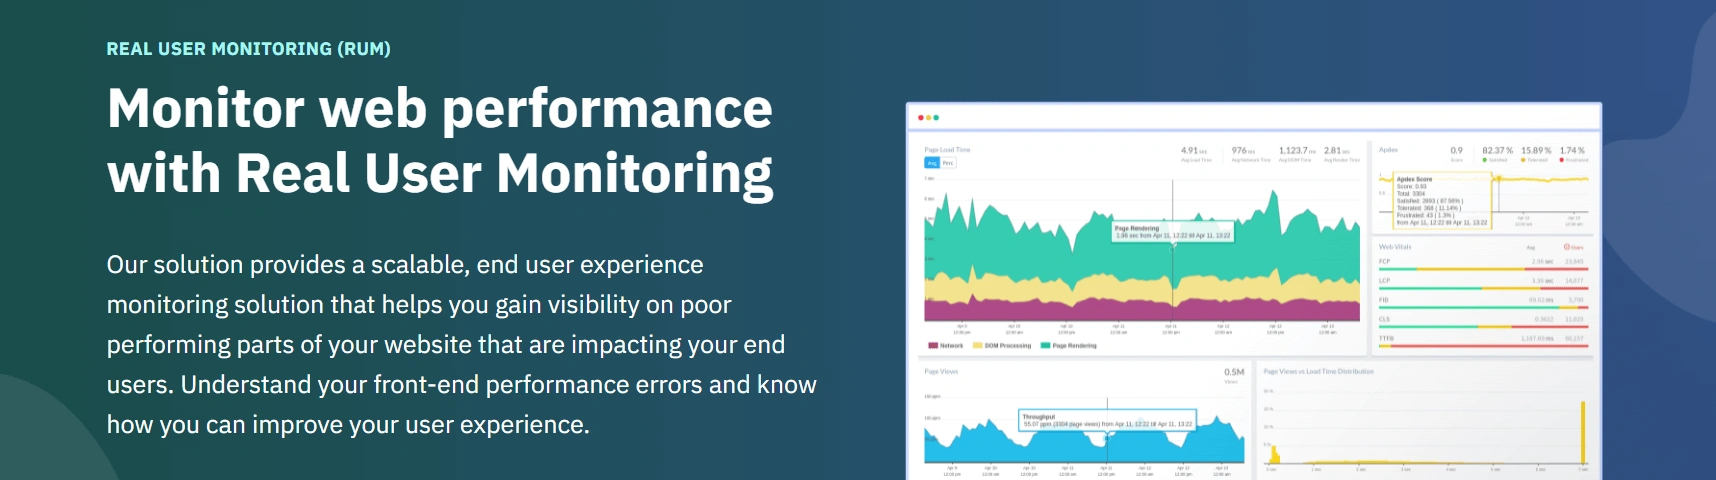
Atatus makes a cloud-based application performance management and error tracking platform that provides RUM capabilities.
When to use it
You need insight into how your users are interacting with your apps and what kind of issues they’re experiencing.
Features
- Detailed stack trace
- Real-time alerts
- AJAX request monitoring
- Customized reporting
- Daily email summaries
Price
Atatus is priced by usage. Depending on the service, it’s based on hosts per hour/month, page views, or log size. RUM is priced at $1.96 for 10K views/month.
Pros
- Integration support
- Easy setup
Cons
- The pricing model can be confusing and hard to budget for
- No native support for mobile applications
- Lacks some advanced features found in comparable solutions
7. TeamViewer Website Performance Monitoring (formerly Monitis)
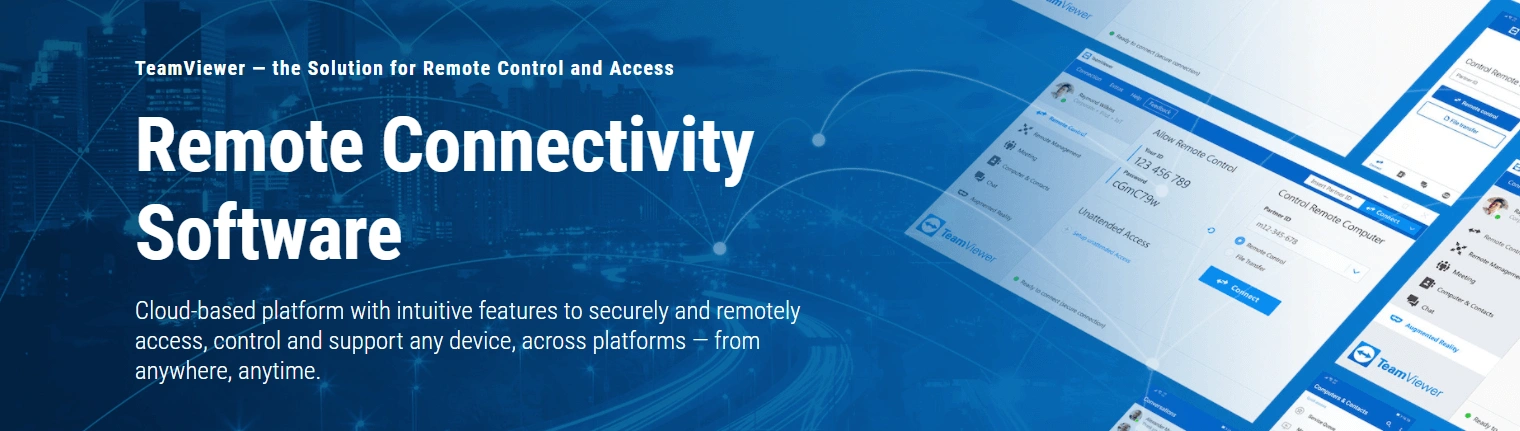
TeamViewer’s web monitoring tracks website, network, server, and application performance. In 2021, TeamViewer rolled Monitis into their larger infrastructure, but the focus on monitoring and performance remains the same as when it was a separate offering.
When to use it
TeamViewer’s Website Monitoring is a solid choice when you’re focused on tracking uptime, performance, and your applications’ health. While it lacks a proper real user monitoring tool, you can simulate user sessions with their transaction monitoring tools.
Features
- Event-based notifications
- Multiple tools with an array of features
- Mobile alerts
- Network monitoring
Price
Pricing starts at $10.90 a month and is based on the number of monitors, locations, and frequency. Customized pricing is also available.
Pros
- Free 15-day trial
- Cloud-based
Cons
- Clunky interface
- Not a true real user monitoring solution
- Can be time-consuming to set up and an overwhelming range of functions if you’re looking for a specific RUM solution
8. Dynatrace
Dynatrace has tools to improve the user experience over multiple channels, including mobile, web, and APIs. Their Digital Experience product offers real user and synthetic monitoring and can also act to resolve issues automatically.
When to use it
Dynatrace is useful for large systems that connect to users across various platforms like mobile, web, and API services. Its automation capabilities make it a good fit for organizations that want to take a hands-off approach to monitoring and resolving issues.
Features
- Automated tools for attempting to address user experience issues
- Business analytics
- “Single source of truth” for multiple departments
- Artificial intelligence capabilities
Price
Digital Experience Monitoring starts at $11 a month, but pricing is based on the number of interactions.
Pros
- Advanced automation can save time and money
- Robust tools for cross-team collaboration
- Free trial is available
Cons
- Pricing is difficult to estimate and can get very expensive
- Limited web monitoring capabilities
9. AppDynamics
AppDynamics is Cisco’s solution for observability. It’s an enterprise monitoring platform that includes user experience monitoring, combining key system metrics with user session tracking to help you improve how your clients use your online systems.
When to use it
If you need user experience to be part of an overall enterprise monitoring strategy, AppDynamics is a suitable solution.
Features
- Exposes vital metrics across all devices
- Experience Journey Mapping (ExJM) tracks the most trafficked paths for performance bottlenecks.
- Web and mobile real user monitoring
Price
- $6/month per CPU core for Basic infrastructure monitoring
- $60/month per CPU core for Premium
- $90 for Enterprise
- $.06/month for 1000 users for Real User Monitoring
Pros
- Comprehensive enterprise monitoring
- True real user monitoring
Cons
One of the most expensive RUM tools
Deploy a user experience monitoring tool today for better digital experiences
If you’re going to invest significant time and resources in building applications, you also need to take steps to ensure they work as designed, that your users have consistently good experiences and that your Core Web Vitals (CWV) are up to standard. Otherwise, you’ll end up creating a product that merely frustrates users and impedes your business objectives.
The good news is that there’s an easy way to know if your applications are working. With real user monitoring tools, you can see your apps through the eyes of your end user. You have peace of mind, knowing that your app is working exactly as intended - and if not, that you can take immediate steps to rectify the situation.
Real user monitoring gives developers visibility into the performance of applications at the code level. Although the above tools offer slightly different features, they’re all designed to do just that.
Now, we might be biased, but we believe Raygun offers one of the most data-rich, powerful and valuable RUM solutions on the market. Find out for yourself with a free 14-day trial.