Master IE11 Developer Tools
Posted Feb 5, 2019 | 8 min. (1575 words)Internet Explorer 11 is an updated version of the IE web browser developed by Microsoft. And if previous versions saw you move to other browsers, then this article will help you reconsider.
The previous versions of Internet Explorer didn’t have a developer-friendly browser, but vast improvement can be seen in its latest version. The built-in developer tools in IE11 now make developing and debugging code in the browser a simple task. Internet Explorer Developer Tools now include features similar to other developer-focused browsers such as Firefox and Chrome.
This article will help you master IE11 Developer Tools.
Fed up of searching through logs for software errors?
Getting started with IE Developer Tools
Apart from having coding expertise to write great web pages, you also require the right tools to help you find errors quickly. To access IE Developer Tools, you launch Internet Explorer and press F12 on your keyboard or select “F12 Developer Tools” on the “Tools” menu. This opens the developer tools inside the browser tab.
What are F12 Developer Tools?
F12 Developer Tools are tools built into Microsoft Internet Explorer that help in the design and debugging of web pages. Previously known as the Internet Explorer Developer Toolbar, the tools were introduced as a toolbar for Internet Explorer 6 and 7. Later versions, such as Internet Explorer 8, have the developer tools built in. With IE Developer Tools, you’re able to edit your site within the browser, and the changes are seen immediately. This is a welcome improvement from the previous versions that required a page refresh every time you made changes.
Using F12 Developer Tools, you can validate CSS and HTML as well as preview page layout at different resolutions.
If you try to access F12 Developer Tools and it’s not working, then the following section will help you with that.
Finding developer tools in IE11
In some cases, clicking F12 or right-clicking a section and selecting “Inspect Element” may not give you what you’re looking for. This is because the function has been disabled. So how do you enable it?
Here are the steps to enable developer tools using the Local Group Policy Editor. At this point, it’s important to note that the Local Group Policy Editor will be applied to all users. Other layers of local GPO (Group Policy Object) are “specific users or groups” or “all users except administrators.” You need to be an administrator to make these changes. Some editions of Windows may not have the local GPO.
-
Press the Windows + R keys on the keyboard to get the Run dialog and type “gpedit.msc,” then press Enter. You can also access this file on the following path: C:\Windows\System32\gpedit.msc.
-
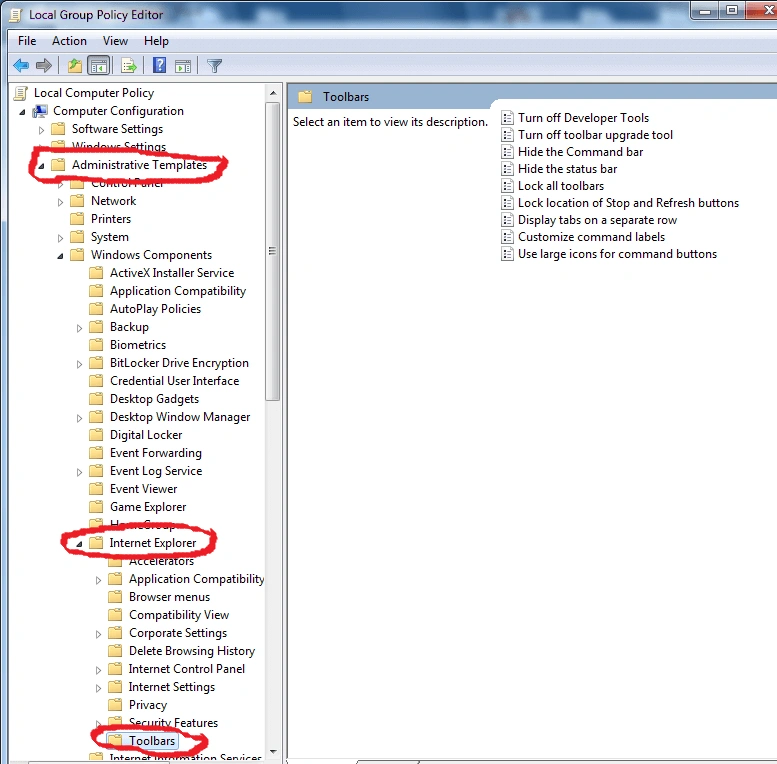
In the left pane of the local GPO under User Configuration, expand Administrative Templates > Windows Components > Internet Explorer > Toolbars. (See the following screenshot.)
-
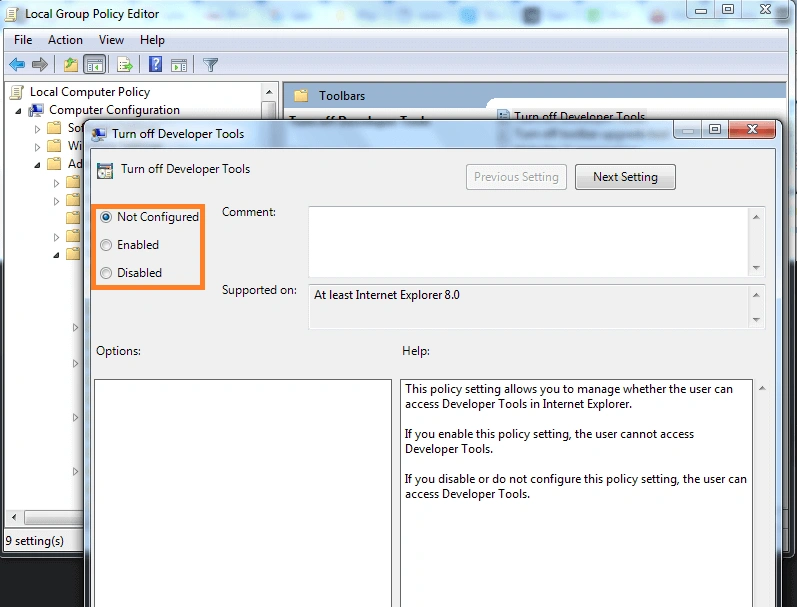
In the right pane, double-click or tap on the first option (i.e., “Turn off Developer Tools”).
-
On the Turn off Developer Tools window, choose the “Not Configured” or “Disabled” option. Note that Not Configured is the default setting. Then apply the changes.
-
Once you’ve closed the open windows, also close the Internet Explorer browser and reopen it for the change to be activated.
Enabling Inspect Element in IE11
The Inspect Element tool helps to implement various tasks on the URL of a website. Such tasks include website monitoring, making alterations, and allowing experimental browser tools to work among other tasks. This means that you’ll be able to view and edit the HTML and CSS of a web page. Since Inspect Element is an advanced feature, it should be used with caution.
There are several ways to enable Inspect Element depending on the browser version you have.
In this article, we’re looking at IE11 and one way to access Inspect Element is to press F12 on your keyboard. The Document Object Model (DOM) Explorer is active by default, and you can click on the “Select Element” icon on the top left corner. This will take you back to the open page where you can select the item to inspect.
Alternatively, you can right-click on an element, and from the pop-up menu, select “Inspect Element.”
Editing IE11 Developer Tools
To make edits, click on the DOM Explorer tab of the developer tools. Once you have selected the element you wish to edit, you can choose one of two options:
-
Double-click on what you want to change.
-
Right-click on what you wish to change and select the option you want, such as “Edit as HTML.”
The changes appear immediately on the web page you’re working on.
Viewing cookies in IE Developer Tools
If you want to view cookies for inspection or modification, then the following steps will guide you to access cookies in IE Developer Tools.
-
On the developer tools window, choose the “Network” tab.
-
Click on the green triangular button found on the top toolbar to enable network traffic capturing.
-
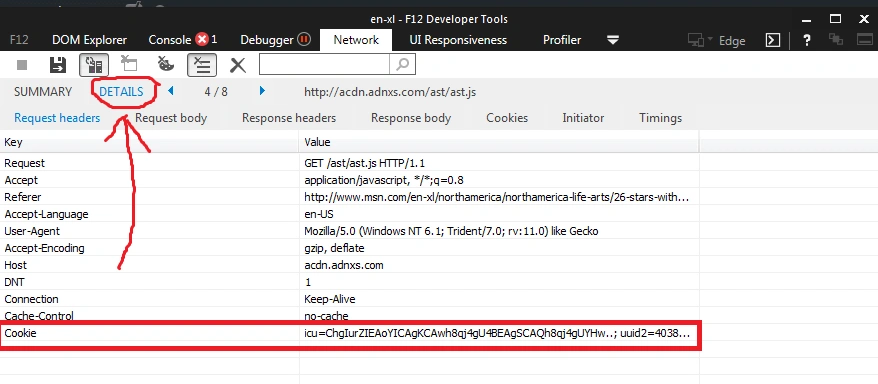
After getting the list of captured URLs, click on “Details” to get the full details of a captured URL. You can step through each captured traffic segment to view other cookies.
-
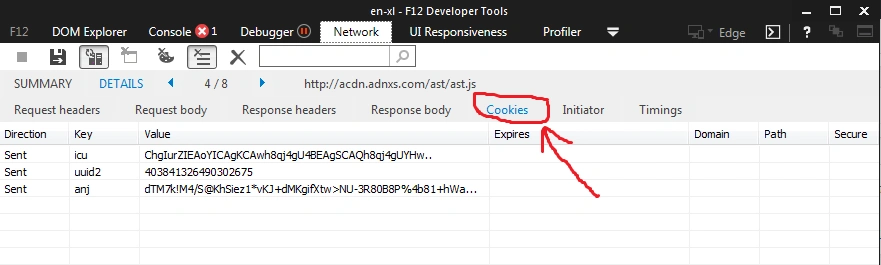
Click on “Cookies” to get a list of cookies for the link you selected.

Using DOM Explorer in IE11
The Document Object Model (DOM) Explorer is a feature that enables you to dynamically update the content, structure, and style of an HTML page. Since the DOM is displayed in a tree format, it becomes easy to find an element you’re looking for. For instance, if you’re working with a complex page, it becomes difficult to locate a specific element, but if you click on the Select Element icon in DOM Explorer, it takes you to the web page where you can select the element you want to work with.
It’s that easy—no scrolling through hundreds of lines looking for a single element. When you click on an element, on the right side there’s a pane that shows your currently applied styles organized by style sheet (styles) and styles organized by CSS attributes (computed). It also includes the current element layout, event handlers for the active element, and CSS changes that you may have made during the session.
You get to see any changes you make immediately. Although these changes are not permanent, it gives a feel for how the element will behave.
Enabling JavaScript in IE11
Unlike other browsers, Internet Explorer enables or disables JavaScript by security zone and not as a whole. So to enable JavaScript for IE11, follow the steps below.
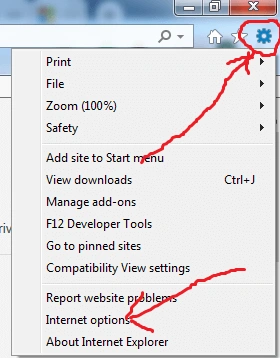
- On the Internet Explorer browser, click on the gear icon in the top right corner of the window, and then choose “Internet options.” Alternatively, press
Alt + Xand then pressOon the keyboard.
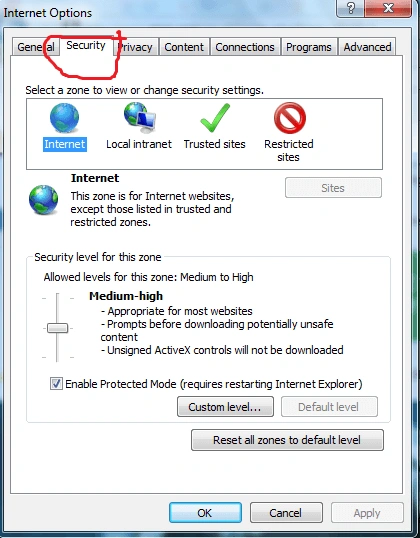
- In the resulting dialog box, select the “Security” tab.
-
Select the zone you want to modify. In most cases, it’s “Internet.”
-
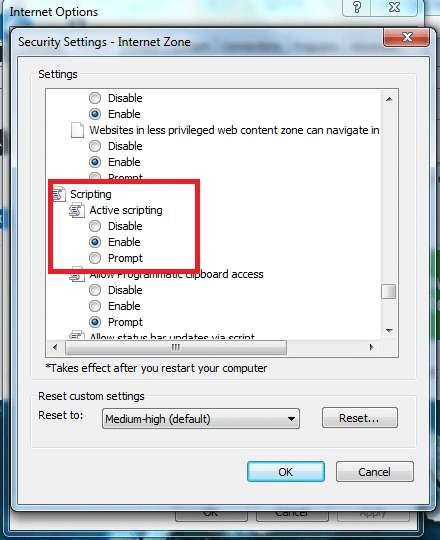
Under “Security level for this zone,” click on “Custom Level.”
-
On the Security Settings dialog box, scroll down to find “Scripting” and select the “Enable” radio button. You may also choose the “Prompt” option so that IE11 will prompt you to allow scripts to run.
- Finally, press OK on the open dialog boxes.
Note that if the Custom Level button is grayed out, you don’t have permission to modify the IE settings. To make changes, you need to run the browser as an administrator or log in as an admin to the system.
Debugging in IE11
Debugging sites and web apps has been made easy by modern browsers that include developer tools. IE11 helps in debugging front-end code quickly as well as in improving a site’s performance. This is made even easier when you use Raygun Crash Reporting. When Raygun runs the error report, it presents you with information that will help you to find and fix the error quickly.
As explained in this article on how to debug JavaScript in Internet Explorer 11, the stack trace module on the report gives you an overview of what’s wrong. Since stack trace indicates where the error occurred and the function call that led to the error, you can jump directly to the error location to work on solving it. This is very useful for a developer, as it saves a lot of time during the development process.
Note: You may find that a website no longer works when you use IE11. In such a case, you can try different document modes to see which version the site works with. You’ll find the different modes on the “Emulation” tab of the F12 Developer Tools.
Conclusion
Dealing with errors during production can be chaotic and slow down the debugging process. It’s for this reason that you should get the right tools to make it easier. An excellent example of such a tool is the Raygun4Net Provider which helps you maintain desktop software when you’re developing ASP.NET web applications as well as with Windows 8 development.
As we’ve seen, Internet Explorer has made a significant improvement in its 11th, developer-friendly version. It now includes tools that aid in enhancing performance, just like browsers such as Chrome and Firefox. The F12 Developer Tools also help you in delivering fast and fluid web experiences, as it will let you diagnose and fix performance issues in a site or app.