Benchmarking web performance: An actionable guide using Real User Monitoring
Posted Feb 20, 2020 | 9 min. (1848 words)Customer experience is becoming a key differentiator between competitors. Actually, it already is! If your website is performing poorly, it’s hurting your business. The first step towards improving this performance is using a real user monitoring tool to identify problems and monitor your progress towards improvement.
If you’re new to RUM, this article will offer some real user monitoring best practices on how to benchmark, measure, and improve your web and mobile performance no matter what your goals are.
Try Raygun Real User Monitoring to help benchmark, measure, and improve web and mobile performance.
Why do apps need great performance?
Research by Google showed that as the page load time goes from 1s to 3s, the probability of bounce increases by 32%. Other research points in the same direction. Google estimates 45% of users are less likely to visit the site again if they have a poor experience.
Google focuses a lot of this research on mobile, but even back in 2009, a study commissioned by Akamai found that 40% of e-commerce visitors will leave the site when it doesn’t load under three seconds. So real data from real studies show us how performance is a key part of user experience. Many potential customers expect your site to load fast and often won’t come back if it doesn’t.
Unfortunately, many websites don’t perform well. How fast is your website? Maybe it feels fast to you, but does it load fast for your potential customers? This is where real user monitoring steps in.
What is real user monitoring, and how can it help?
Let’s turn towards Wikipedia for a definition first. It defines real user monitoring as “a passive monitoring technology that records all user interaction with a website or client interacting with a server or cloud-based application.” The word “passive” is important there. Passive monitoring is a way of monitoring real usage of an application without interfering.
By contrast, with active monitoring, you will run a certain script, often in an automated browser, and analyze the results of that single session.
Active monitoring can be useful because you can simulate situations before they happen to real customers. Passive monitoring is important because it allows you to see what is really happening, regardless of your test scenarios.
Some things might react differently than in your tests, you may not have thought about all possible situations, or you may not be able to test every possible scenario (like browsers, regions, users, network speeds, or outages).
So how can we use real user monitoring to measure, benchmark and improve your web and mobile performance?
Step 1: Benchmark your overall performance
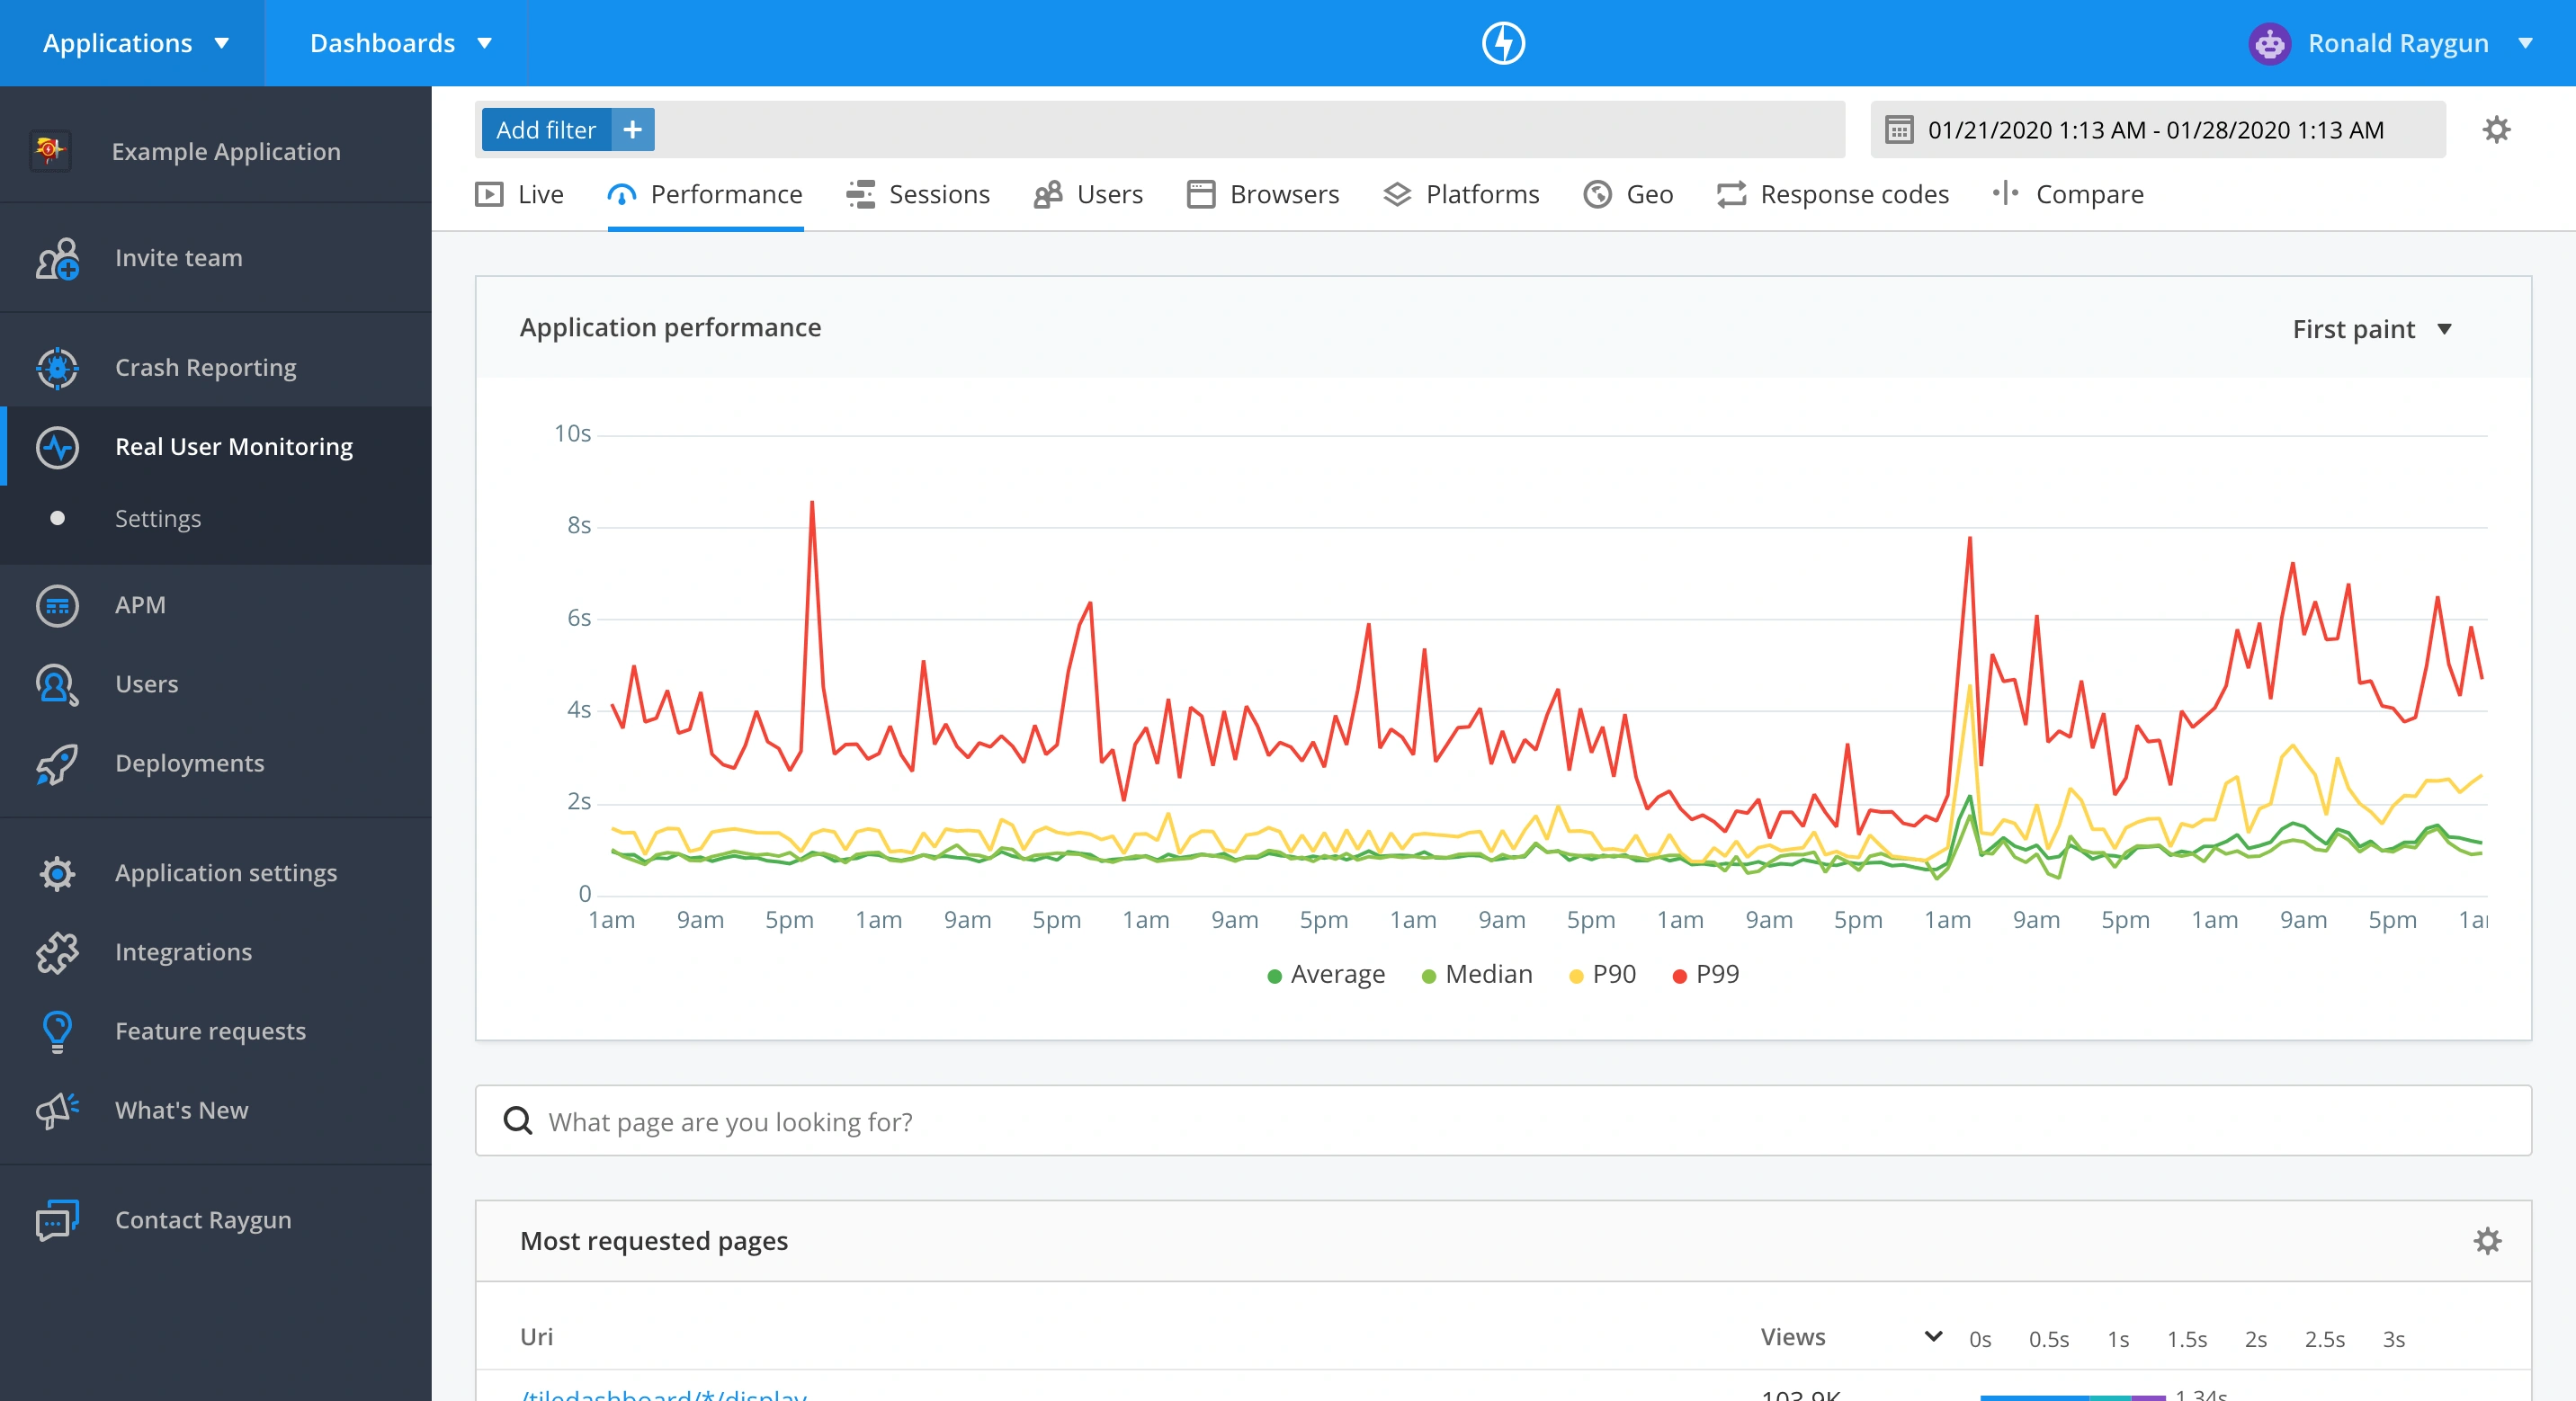
Before losing yourself in the details, you should have a high-level overview of your application’s performance. At Raygun, the following items are measured on the Performance page:
- Median load time
- Average load time
- P90 load time
- P99 load time
Take a look at this screenshot from Raygun:
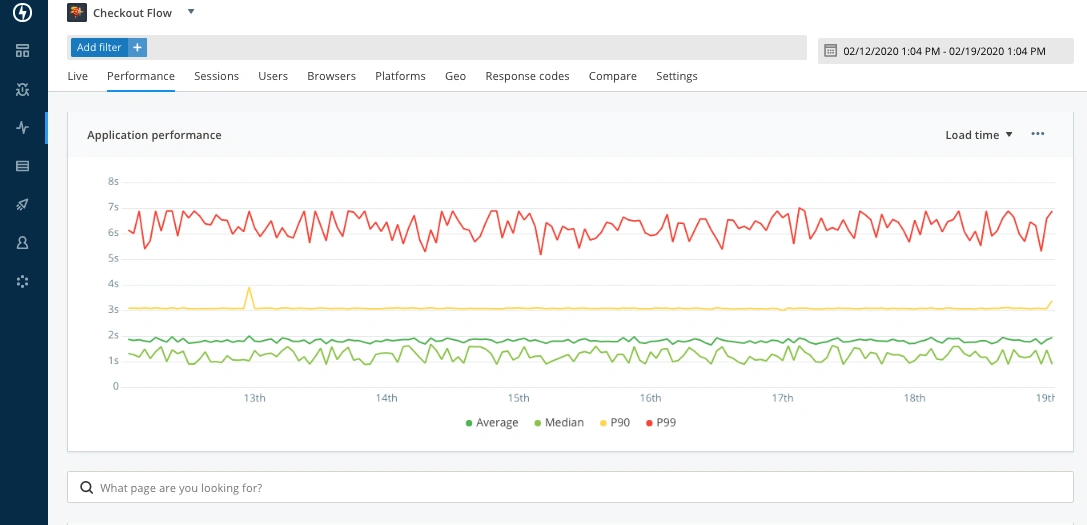
Let me explain what these terms mean very briefly.
The average load time is calculated by dividing the sum of all measurements by the number of measurements. The average is another way of seeing the central tendency, but is prone to be skewed by outliers.
The median load time is the value you get when you order all the load times you’ve measured from low to high, and take the value in the middle. It’s a good indication of how long most users are having to wait. It points to a central tendency in the data.
Finally, the P90 and P99 load time are basically the maximum time that 90% or 99% of the users have had to wait for your application. So if the P90 is three seconds, then 90% of the requests were handled in three seconds or less.
These measurements give you a good overview of how your application is performing. At the very least, you should be monitoring these metrics. But we can do better than that. As mentioned previously, Raygun’s team also monitor:
- Users affected by bugs
- Resolved bugs >= New bugs
With the first one, it is important to provide some perspective. I’ll just quote the linked article: “If you have 10,000 errors that affect one customer, it’s not as bad as 500 errors affecting 250 customers.” So this metric is a great way of deciding the priority of a given bug. Raygun is helpful to show this because it can group errors and show you how many users were affected.
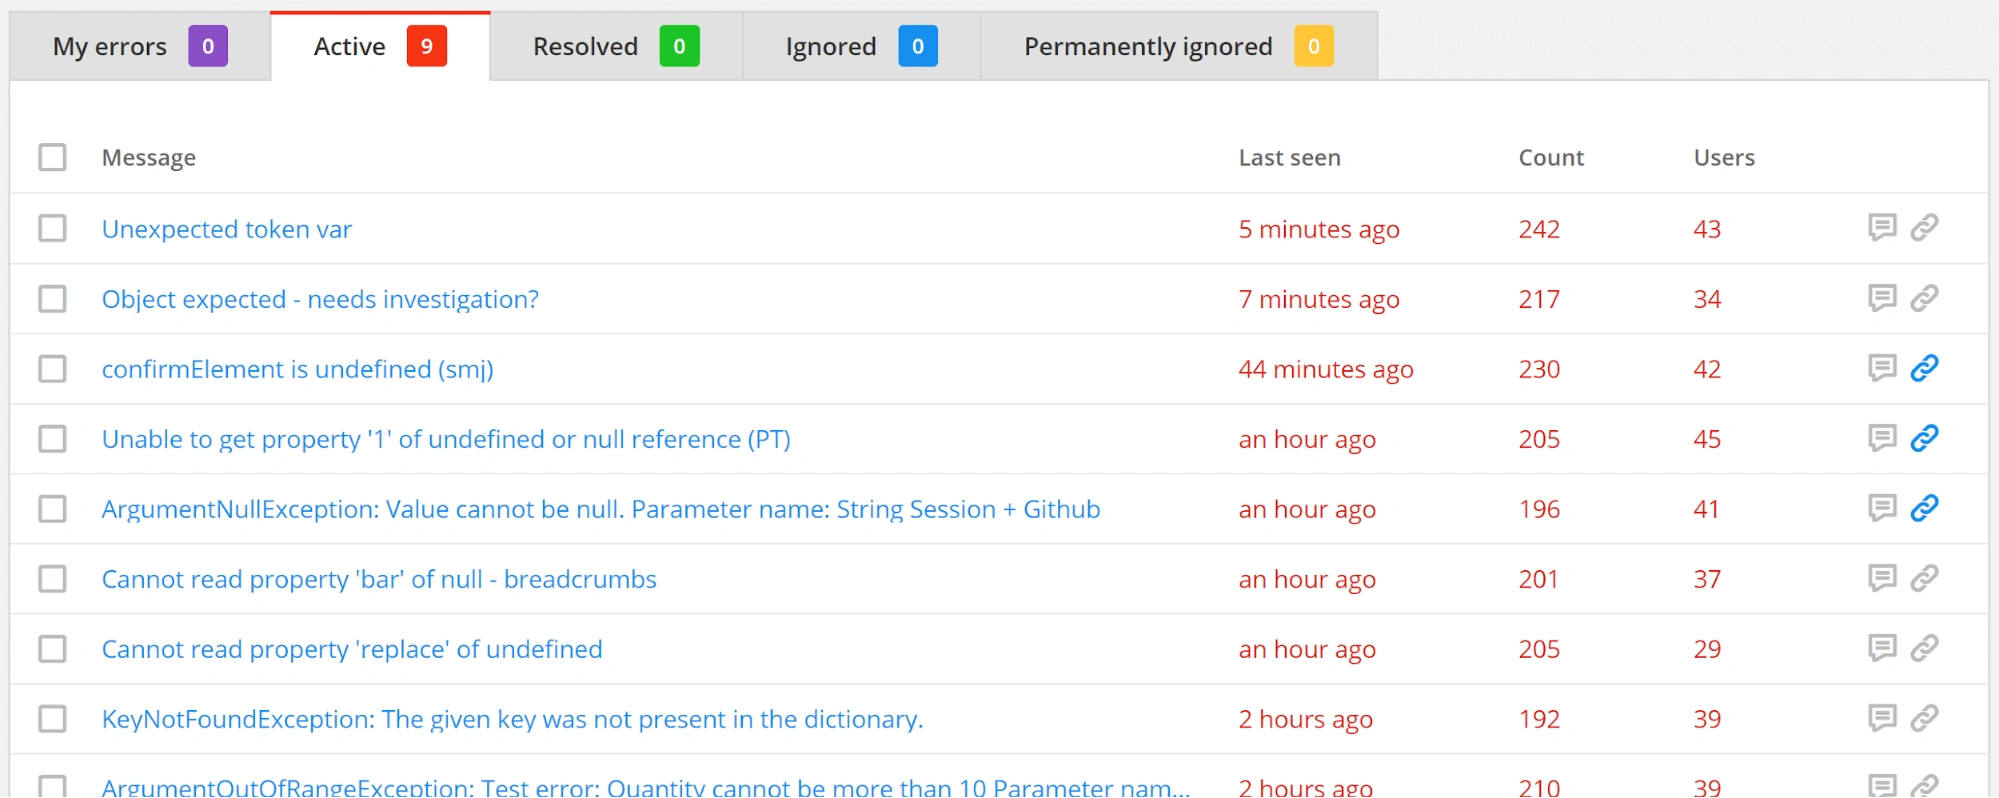
Measuring the amount of new and resolved bugs allows you to see whether or not you’re increasing or decreasing the number of bugs you have. This is not the same as measuring how many times a bug occurred, which is what we can measure with the previous metric.
All the metrics I’ve mentioned until now provide a great high-level overview of the state of your application. Having these metrics at your disposal is a first foundation to build on.
Without them, you’ll have a hard time improving the user experience of your application.
Step 2: Where do you want to be?
So now that you have a set of numbers that you’re monitoring, what do you do with them? What are good values? At what point should you be alerted that things are starting to go bad?
I mentioned several studies that point to users leaving a website if it doesn’t load under three seconds. This seems to be a tipping point. So you should aim for your application or website to respond in fewer than three seconds.
Should all your request load this fast? No, that would be unrealistic. Real-life circumstances will lead to some requests going slow no matter what you do.
That’s why it’s recommended to get your P90 load time to below three seconds and maybe your P99 to below five seconds.
This leaves some room for a small group of requests that can be outliers.
If you’re working on larger, more popular websites, you’ll want to maintain these load times during periods of high traffic (say if you work with e-commerce and you need to ensure site stability over Black Friday sales weekend.)
Consumers and users aren’t very forgiving for slow websites, even if it’s due to an exceptionally large amount of concurrent users.
Step 3: Connect your performance work to real outcomes
Ok, so you know your high-level metrics and you know where you want them to be. The next step is to really start tracking and reporting your performance. You don’t want to be manually analyzing your server’s logs to determine those numbers.
A best practice is to have a tool that can you have at your disposal at all times. This tool should be able to tell you your current numbers and how you are evolving. Is your P90 two seconds? Good! But was it one second a few months ago?
Hmm, you might want to investigate what’s going on, because you don’t want to evolve towards three or five or 10 seconds next year!
After you’ve seen your overall performance, you can also go several levels deeper and analyze what certain users are experiencing. Maybe a specific region is experiencing slow load times? Or certain browsers?
Performance has a real business impact. As I’ve mentioned, users will leave your website if it is too slow. Customer experience is likely to be the key differentiator in the near future.
Gartner and Walker have reported on this in the past. And it only takes a quick look on your favorite social media to see that customers are very vocal when their experience is below average.
Performance is an important aspect of customer experience.
That is why you should take specific actions based on the insights you’ve gained from your monitoring. New features aren’t the only thing to put on your backlog. Jeff Atwood already stated it in 2011: performance is a feature too. But simply asking developers to increase the performance of the website won’t work. You want to know which specific pieces should be improved first because they will have the largest impact on the business.
How Raygun helps improve website performance
By now, I think we can agree that performance is an important part of the customer experience, and customer experience has and will continue to have a real business impact. This means you need to take performance seriously, monitor it, improve it, and take swift action when it deteriorates.
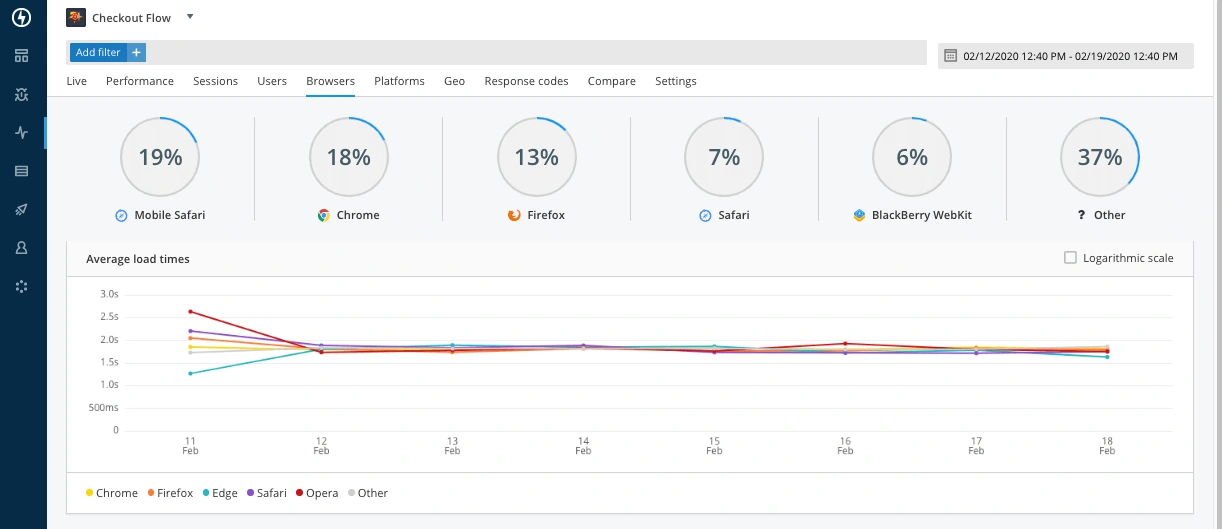
A platform like Raygun means you don’t have to do this all yourself. Raygun’s Real User Monitoring gives you insight into the experience of real users. You can then group those experiences by browser, geographic location, and platform/OS:
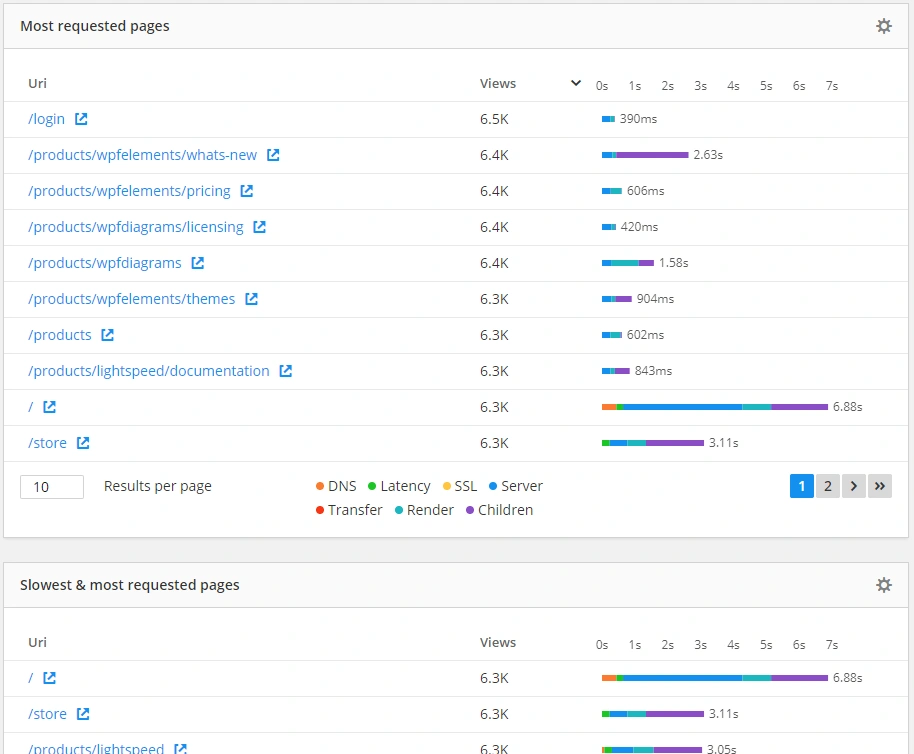
You can get statistics on your site (like average page speed) or for individual pages (like most requested or slowest pages):
And if you want, you can see how individual users experienced your site. It’s even possible to see the different sessions they had on your site:
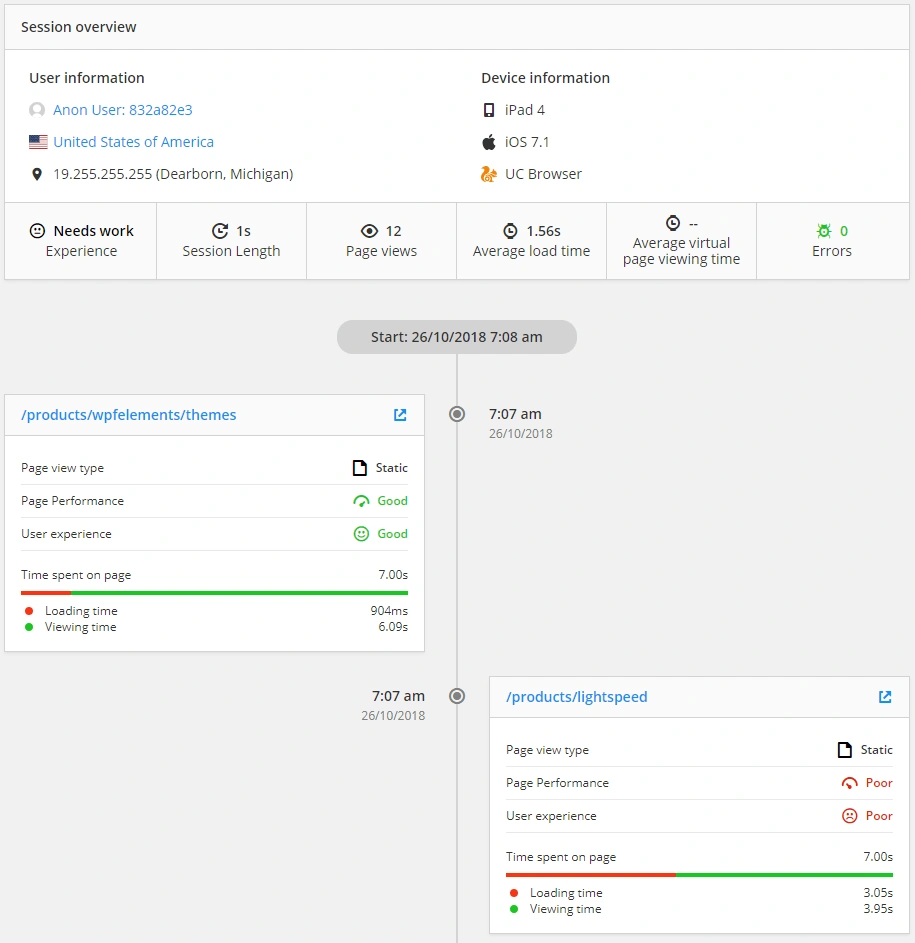
When things go bad for a user, you can see the different pages the user visited and the actions they made. This can prove to be valuable information to pinpoint a problem.
User-centric performance metrics
While traditional performance metrics like load time are still important, they don’t tell the full story in terms of how your users are really experiencing your app.
Real User Monitoring measures the user-centric performance metrics first paint and first contentful paint, which helps developers understand how a user perceives the performance of the page. They help to answer questions like, “how long before the user sees the page is loading?” and “when did the user first see something on the page?”
With Raygun you can find out what your priorities should be. Maybe your website is performing especially bad on a specific browser that your developers aren’t testing for. It could be that a sizable portion of your visitors are from a region that is too far away from your data centers. Or it might just be a few specific pages that are giving your users a bad experience.
Then, Crash Reporting and Application Performance Monitoring (APM) can help you determine the exact cause of performance issues; whether it was server-side or a software bug.
Make a measurable impact on performance
Real User Monitoring gives you insights into the experience of your visitors and potential customers. If they have a bad experience, they will leave and might never come back. Users expect a load time of three seconds or less, so performance is an important part of the user experience.
You should aim for this three seconds or less goal by monitoring your current load times and how they are evolving. Next to these global metrics, a good tool will allow you to drill into details like browsers or region. This gives developers the necessary information to prioritize and pinpoint issues.
Real user monitoring and the steps you take as a result of it can have a significant impact on your business. You can take a free 14-day trial here to start benchmarking and improving your web and mobile performance.