Announcing: First Paint Metrics and Advanced Visualizations
Posted Feb 17, 2020 | 5 min. (927 words)Since Real User Monitoring (RUM) first launched in 2015, Raygun has helped thousands of teams identify and resolve front-end performance bottlenecks impacting their customers.
Today, we’re excited to announce support for first paint and first contentful paint, along with rich new visualizations designed to help you better identify and diagnose performance problems in your software.
These new metrics provide a more granular understanding of how users experience your application, making it easier for modern development teams to identify poor app performance. Our new histogram and line graph help paint the full picture in a rich and actionable way, making it easier to identify poor performance and track the impact of changes you’ve made.
All this helps you make better decisions about where to prioritize performance optimizations and measure trends in front-end performance.
New standards in measuring front-end performance
While traditional performance metrics like load time are still important, they don’t tell the full story in terms of how your users are really experiencing your app.
User-centric performance metrics, such as first paint and first contentful paint, help developers understand how a user perceives the performance of the page. They help to answer questions like, “how long before the user sees the page is loading?” and “when did the user first see something on the page?”
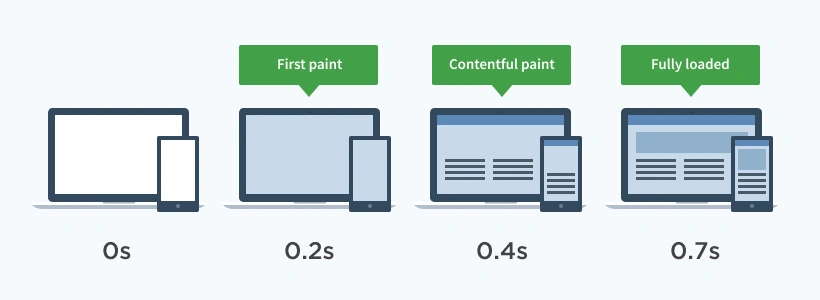
First paint (FP) measures the time between navigation and when the browser renders the first pixels to the screen, rendering anything that is visually different from what was on the screen before navigation.
First contentful paint (FCP) measures when the browser renders the first bit of content from the DOM, providing the first feedback to the user that the page is actually loading. This is usually text, images, non-white images, or SVGs.
Advanced visualizations that drive action
With this latest release, rich new visualizations display the actionable front-end performance data you need to discover, diagnose, and solve performance issues.
The new line graph visualizes FP, FCP, and load time to provide different perspectives on how application performance is trending over time. When you see something you’d like to investigate further, drill into a specific URL to see the full distribution of user experiences with our new histogram.
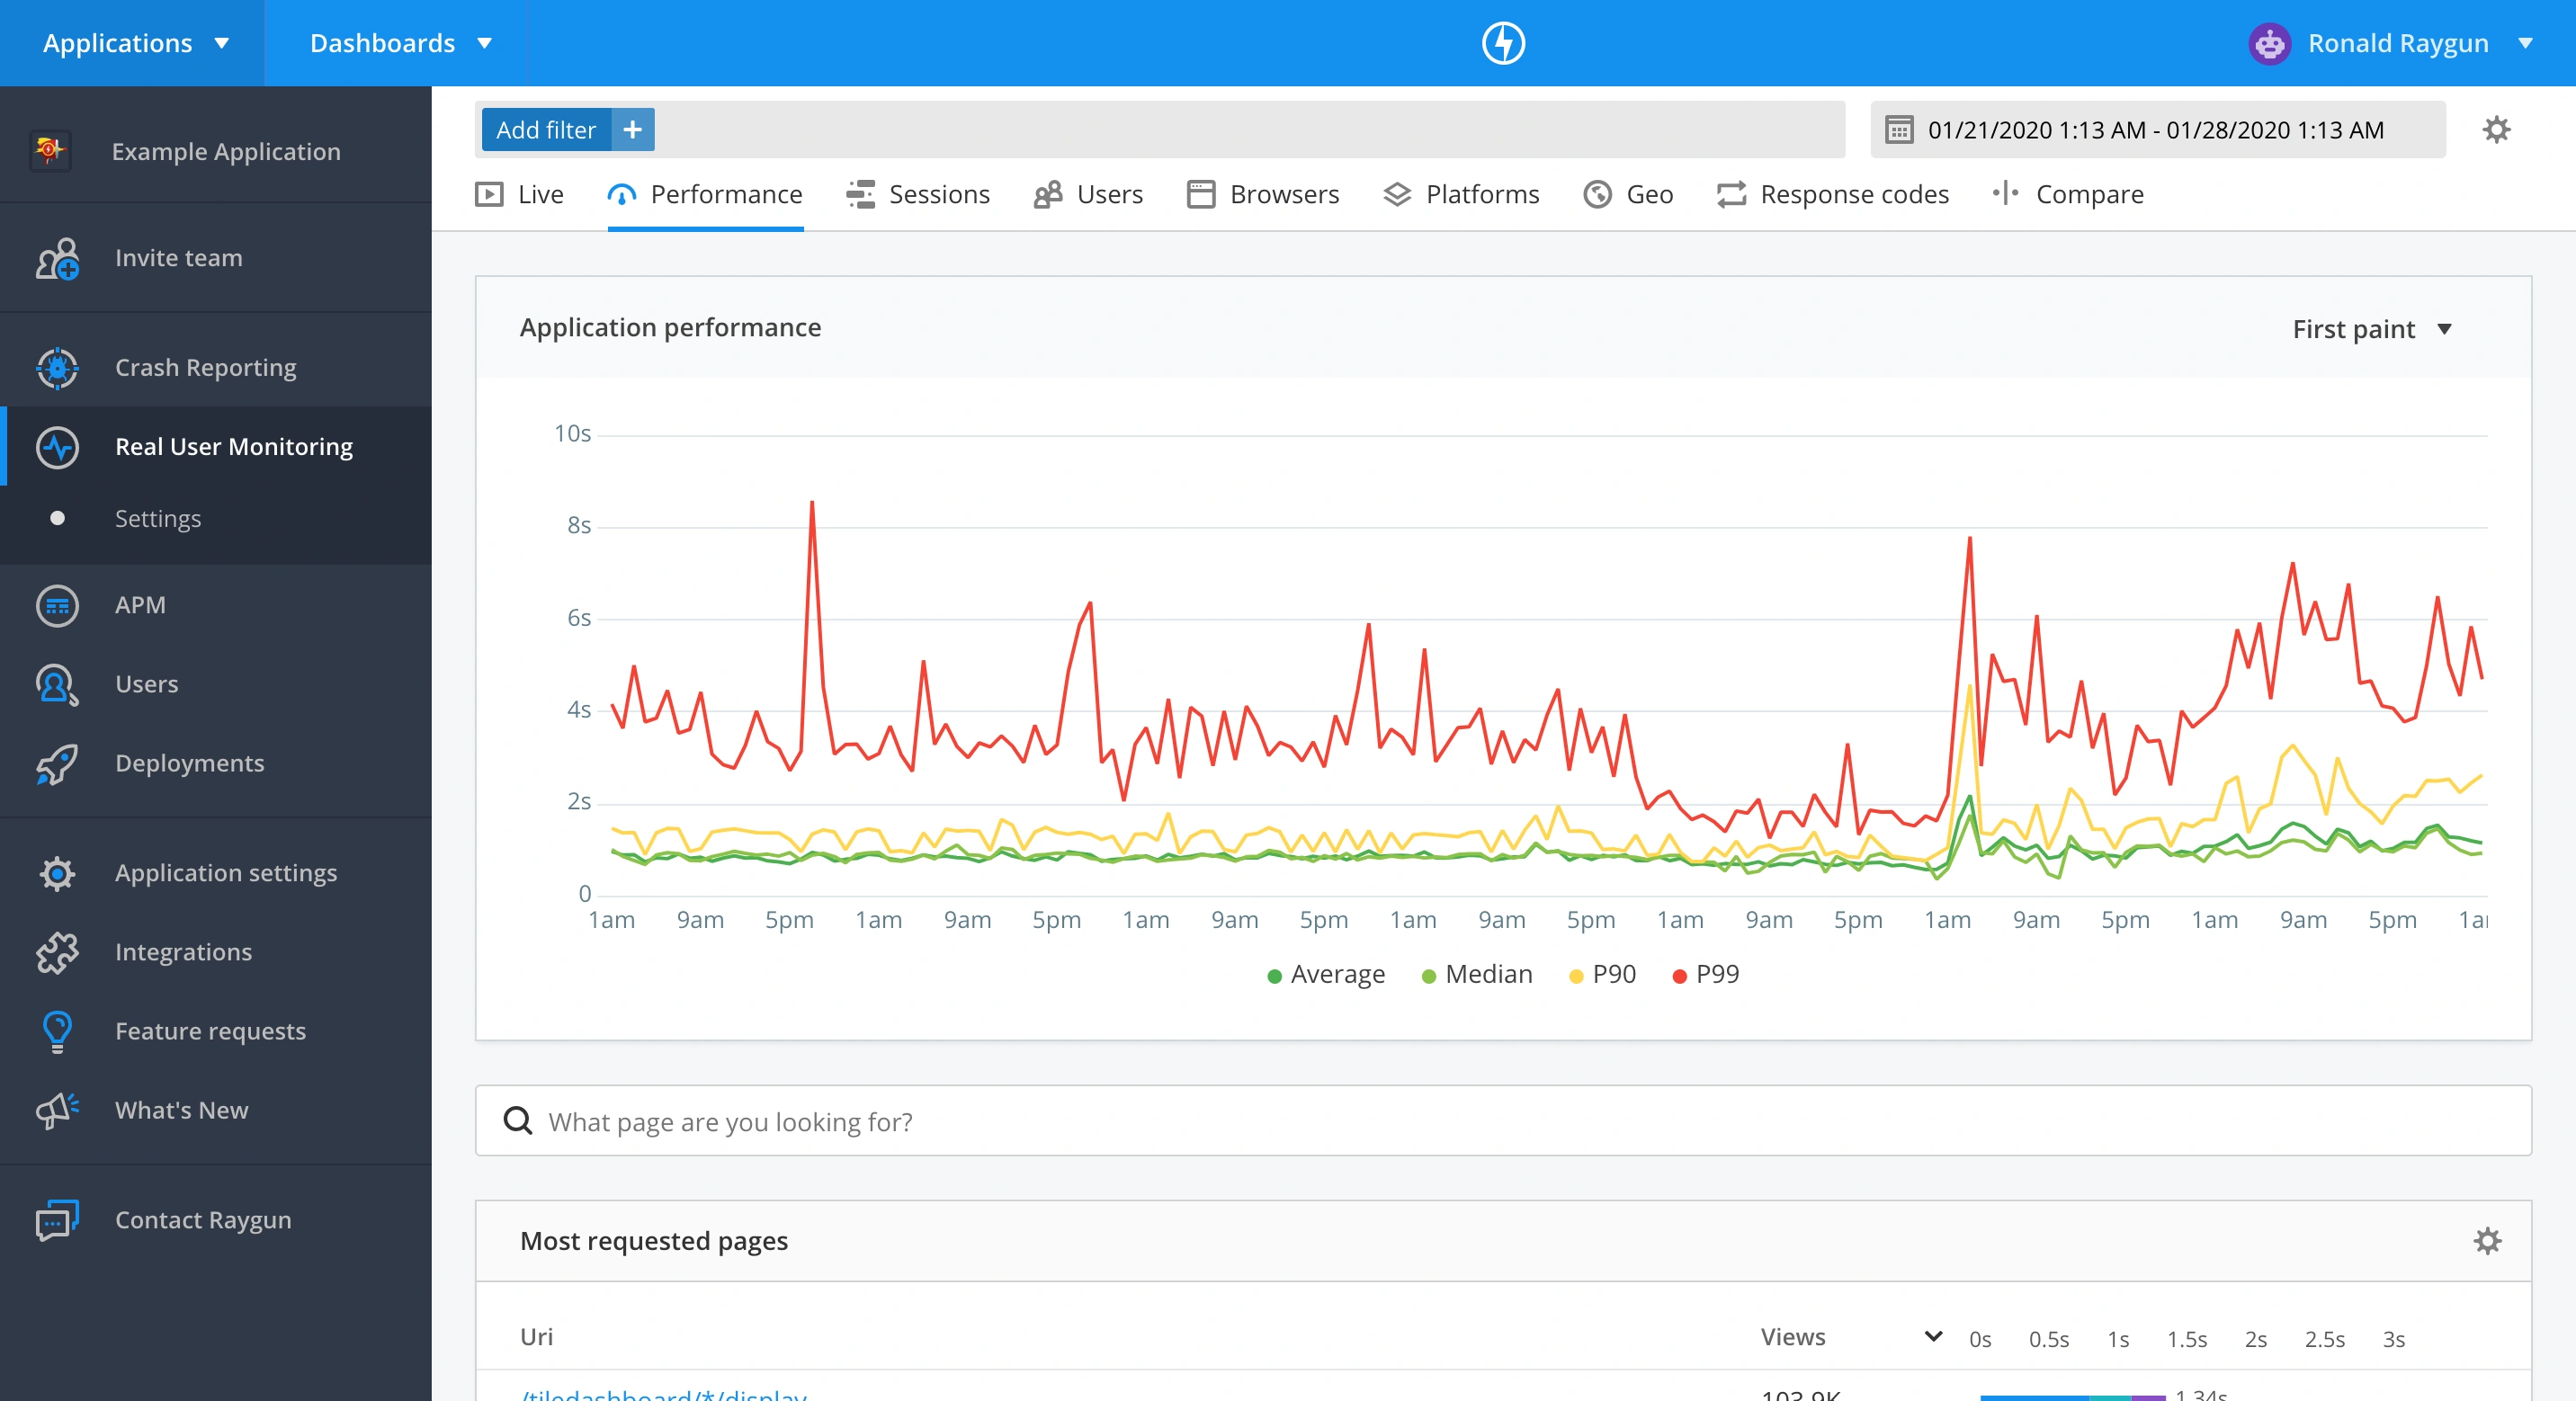
Spot high-level trends with the new line graph
If you’re a RUM customer, you’ll notice we have upgraded the sparklines graph on the main RUM performance page. The new line graph surfaces the overall trends in your software performance, so your team has insight into the performance of your web, single-page (SPA), or mobile application over time.
Understand the distribution of performance with the new histogram
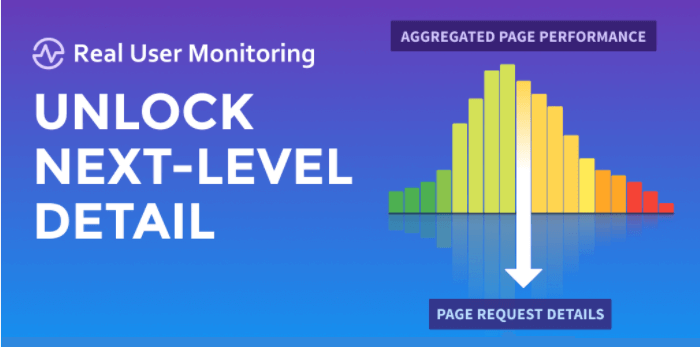
Once you’ve identified a slow loading page, drill down into the specific URL where the new histogram charts visualize the full distribution of page performance. This enables you to easily see how many users are experiencing an acceptable load time, first paint, or first contentful paint on that page.
In the example below, you can see that the majority of users are experiencing good average load times, but there are a few outliers experiencing load times of over 20 seconds.
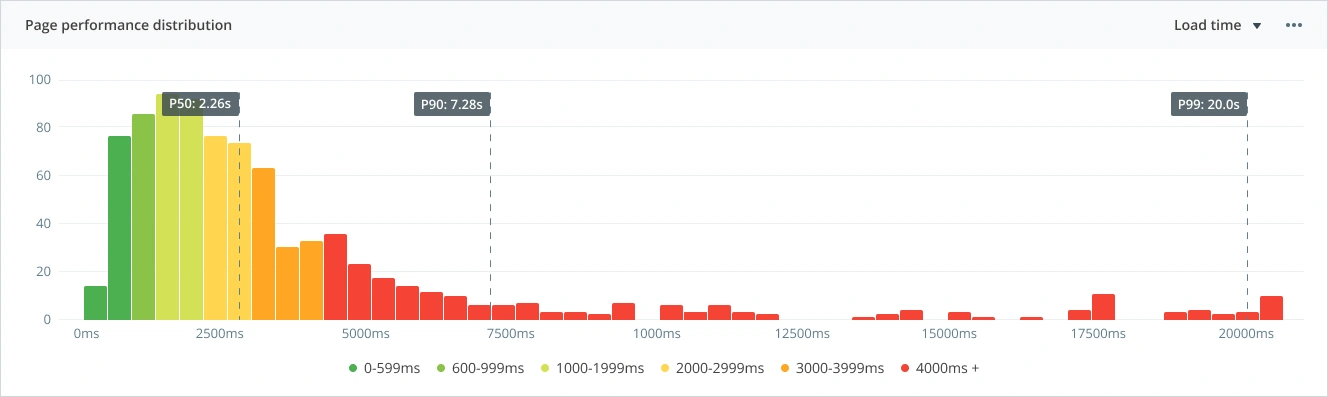
The graph also has built-in controls to hide the 10% slowest data, or to display the Y-axis in a logarithmic scale, ensuring no extreme outliers prevent you from understanding the page performance.
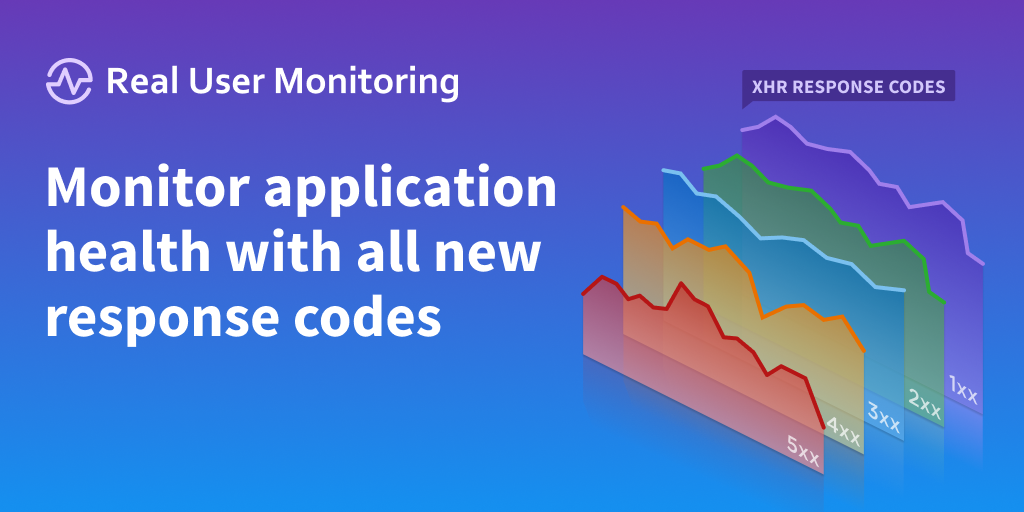
Single-page apps are also supported by the new histogram. The distribution of XHR response times and view duration give you an understanding of the time your site is taking to respond to a request for a virtual page, and how long users are spending on the page.
We created some detailed documentation for both web and mobile so you can get set up quickly.
Track deployments alongside page performance
Did a recent deployment cause a gradual increase in P90 load time? Now you can know how your deployments affect performance with the new deployment tracking functionality for RUM.
![]()
On the Performance page, hover over the deployment bar to reveal a breakdown of the deployments made on that day, then drill down into the performance breakdown on the line graph above. It’s a fast and effective way of getting the answers you need at a glance.
Histogram and instance drill-in
In addition to the histogram bars, you can now click into any bar on the histogram to reveal the session with views of that page within the time range represented by the bar. When you click into a page request from the user session view, you’re presented with an instance-level view of page performance.
Read the announcement for more details.
Real User Monitoring for modern teams
Real User Monitoring provides in-depth diagnostics on how real users are experiencing your applications. As a modern development team, you need user-centric performance metrics to understand application performance from the perspective of your customers and ensure you’re building flawless software experiences.
Raygun is committed to helping developers detect and diagnose poor performance, and to helping teams to understand the impact of their hard work to improve performance and build better software. With this in mind, you can expect to see more steady feature updates for Real User Monitoring - along with Crash Reporting and APM - in the coming months.
Want to understand how to implement these metrics, plus get a rare insight into how Raygun manages software performance? Sign up for our webinar for a deeper dive into how to use first paint, first contentful paint, and load time distribution.
Are you new to Raygun? Take a free 14-day trial of Real User Monitoring and try first paint metrics for yourself. Get up and running in minutes with our simple SDKs.