Server performance metrics: 11 to consider for actionable monitoring
Posted Jul 11, 2023 | 11 min. (2217 words)With the DevOps movement becoming mainstream, more and more developers are getting involved with the end-to-end delivery of web applications, including deployment, monitoring performance, and maintenance.
As an application gains more users in a production environment, it’s increasingly critical that you understand the role of the server. To determine the health of your applications, you need to gather system performance metrics for the servers running your web applications and optimize your web server performance.
All different types of web servers (like Apache, IIS, Azure, AWS, and NGINX, for example) have similar server performance metrics. Here, we’re going to mostly focus on Microsoft Azure, which provides an easy-to-use interface for finding and collecting data. Working with Azure grants the ability to host applications in either Azure App Services (PaaS), or Azure Virtual Machines (IaaS). This setup gets you a view of the different metrics for the application or server running.
Below, we’ve broken down twelve of the most useful server performance metrics. These metrics can be divided into two categories: app performance metrics and user experience metrics.
Table of contents:
- 1. Requests per second
- 2. Data I/O
- 3. Average response time rate
- 4. Peak response time
- 5. Hardware utilization
- 6. Thread count
- 7. Disk usage
- 8. Load
- 9: Network bandwidth
Let’s start by looking at the metrics under the app performance umbrella.
App performance metrics
App performance metrics are specific to the speed of the web applications that are running. If you’re having issues with an application performing slowly, these metrics are a good place to start.
Metric 1: Requests per second
Requests per second (also called throughput) are just like what they sound like — the number of requests your server receives every second. This is a fundamental metric that measures the main purpose of a web server, which is receiving and processing requests. Large-scale applications can reach up to about 2,000 requests per second.
Given enough load, any server can fall. When considering the impact, remember that requests are just that: a single request to the server. This metric doesn’t consider what’s happening in each of these requests.
Raygun, for example, increased throughput by 2000% by changing from Node.js to .NET Core.
This brings us to our next metric.
Metric 2: Data I/O
The next metric we suggest you look at is your data input and data output. The input metric is the size of the request payload going to the web server. For this metric, a lower rate is better (lower meaning that small payloads are being sent to the server). High data in can indicate the application is requesting more information than it needs.
Data output is the response payload being sent to clients. As websites are getting larger over time, this causes an issue, especially for those with slower network connections. Bloated response payloads lead to slow websites, and slow websites will give your users a poor experience. With enough delays, users will abandon the website and move on. Google suggests pages that take three or more seconds for mobile users to load have about a 53% chance of users abandoning before load completion.
Metric 3: Average response time
Defined directly, the average response time (ART) is the average time the server takes to respond to all requests. This metric is a strong indicator of the overall performance of the application, giving an impression of the application’s usability. In general, the lower this number is, the better. But studies are showing that the ceiling for a user to have a sense of “seamlessness” while navigating through an application is around one second.
When considering ART, remember what the acronym stands for — it’s just an average. Like all averages, high outliers can throw the number off entirely and make the system seem slower than is. ART is most helpful when used alongside our next metric on the list.
Metric 4: Peak response time
Similar to the average response time, the peak response time (PRT) is the measurement of the longest responses for all requests coming through the server. This is a good indicator of performance pain points in the application. (And remember, anything over 10 seconds and you’ve lost the user.
PRT will not only give you an idea of which portions of your applications are causing bottlenecks, but it will also help you find the root cause of these holdups. For example, if there’s a certain slow web page or a particularly slow call, this metric can give you an idea of where to look.
Metric 5: Hardware utilization
Next, let’s talk about hardware. Any application or server running is limited by the resources allocated to it. Therefore, keeping track of the utilization of resources is key, primarily to determine if a resource bottleneck exists. You have three major aspects of a server to consider:
- The processor
- The RAM (memory)
- The disk space and usage
When reviewing these, you’re looking for what can become a bottleneck for the whole system. As any physical (or virtual!) computer running with these components will show, performance is only as strong as its weakest link. This metric can tell you what the bottleneck is and what physical components can be updated to improve performance.
For example, you may run into issues when trying to render data from a physical hard drive. That will cause a bottleneck in the I/O interactions between gathering files and presenting them to the user. While the hard drive spins and gathers data, the other physical components do nothing. An upgrade to a solid-state drive would improve the performance of the entire application because the bottleneck will disappear.
Metric 6: Thread count
The next metric — the thread count of a server — tells you how many concurrent requests are happening in the server at a particular time. This metric will help you understand what the general load of a server looks like from a request level. It will also give you an idea of the load placed on the server when running multiple threads.
A server can generally be configured with a maximum thread count allowed. By doing this, you’re setting a max limit of requests that can happen at one time. If the thread count passes this maximum value, all remaining requests will be deferred until there’s space available in the queue to process them. If these deferred requests take too long, they’ll generally time out.
It’s worth noting that increasing the max thread count generally relies on having the appropriate resources available for use.
Metric 7: Disk usage
Disk usage is another important performance metric to monitor. It provides insights into how much storage space is being utilized and can help identify potential issues or bottlenecks.
This metric combines insights such as the amount of disk currently in use, the number of reads and write operations on the disk, the time it takes for the disk to process read/write requests, the amount of data that can be transferred to or from the disk within a given time frame, and the number of pending I/O operations waiting to be processed by the disk.
Monitoring these disk usage metrics can help system administrators identify disk-related performance issues, optimize storage utilization, and ensure smooth server operations.
Metric 8: Load
Server load is another crucial performance metric that provides insights into the server’s overall resource utilization and performance. It measures the average number of processes or threads actively running or waiting for CPU time during a specific period.
Server load is a combination of insights such as the server’s workload, the server’s hardware specifications, and the impact of load on performance.
Metric 9: Network bandwidth
Monitoring network bandwidth and related metrics is essential for maintaining high-performance server networks. This server performance metric measures bandwidth utilization, throughput, and potential bottlenecks. This helps administrators take proactive measures to optimize network performance, ensure smooth data transmission, and deliver an efficient user experience.
User experience metrics
Now that we’ve covered the app performance metrics, let’s discuss a few that are user experience-centered. These server performance metrics can measure your users’ overall satisfaction when using your web applications.
Metric 11: Uptime
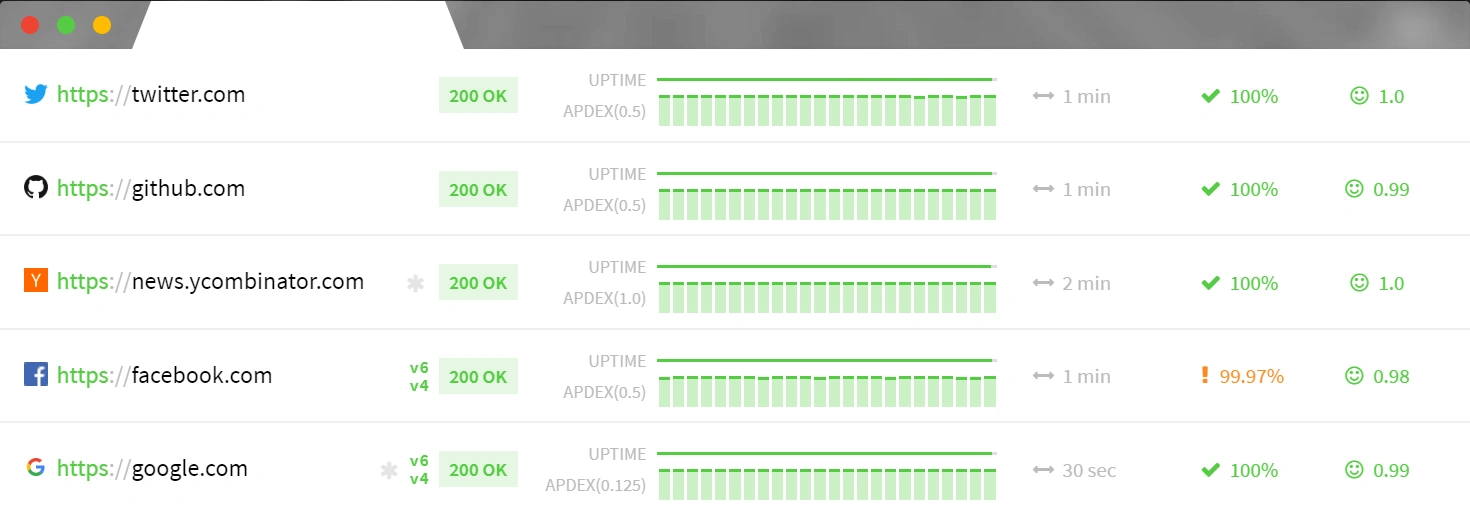
Although not directly related to its performance, the uptime of the server is a critical metric. Uptime is the percentage that the server is available for use. Ideally, you’re aiming for 100% uptime, and you’ll see many cases of 99.9% uptime (or more) when looking at web hosting packages.
It’s not uncommon for software projects to abide by a service level agreement that dictates a particular server uptime rate. If uptime metrics checking isn’t something your server can provide built-in, there are plenty of third-party services, such as Updown.io, that can do it for you. These services can even give you a visual depiction of their report:
And here’s an interesting fact. Calculating the monthly allowed downtime shows:
- 99%: ~7 hours
- 99.9%: ~45 minutes
- 99.999%: 30 seconds
Metric 12: HTTP server error rate
The HTTP server error rate is a performance metric that doesn’t directly relate to application performance, but it’s a very critical one. It returns the count of internal server errors (or HTTP 5xx codes) being returned to clients. These errors are returned from malfunctioning applications when you have an exception or other error not being handled correctly.
A good practice is to set up an alert whenever these kinds of errors occur. Because 500 errors are almost completely preventable, you can be certain you have a robust application. Being notified of all HTTP server errors allows you to stay on top of any errors occurring. This prevents the issue of having errors build up in the application over time.
Client-side vs server-side performance metrics
Here is a quick comparison table between client-side performance matrics and server-side performance metrics:
| Metric | Client-side performance metrics | Server-side performance metrics |
|---|---|---|
| Page Load Time | Measures the time taken for the client’s browser to fully render and display the web page | Measures the time taken for the server to process the request, generate a response, and send it |
| Network Latency | Measures the time it takes for a network request to reach the server from the client’s device | Measures the time it takes for the server to receive the request from the client’s device |
| DNS Lookup Time | Measures the time it takes for the client’s device to look up the server’s IP address from the domain name | Measures the time it takes for the server to resolve the domain name to its IP address |
| Connection Time | Measures the time taken to establish a connection with the server | Measures the time taken to establish a connection between the server and the client |
| Rendering Performance | Measures how quickly the client’s browser renders and displays the web page elements | Server-side does not directly affect rendering performance |
Top server performance metrics to track
Server performance metrics are crucial for maintaining optimal operations. While there are many metrics to consider, here are the top five server performance metrics to track:
- CPU usage: Monitoring CPU usage includes insights into the server’s processing capacity and helps identify bottlenecks. For example, high CPU usage can lead to slow response times, increased latency, and reduced overall performance.
- Memory usage: Monitoring memory usage allows you to understand how effectively the server is utilizing its available memory. It helps identify potential memory leaks or inadequate memory allocation. Higher memory usage may cause the server to rely on disk swapping, which significantly impacts performance.
- Disk I/O: Tracking disk I/O metrics, including read and write speeds, helps evaluate the performance of the server’s storage subsystem. High disk I/O wait times can impact application responsiveness.
- Network latency: The latency measures the delay between a request sent from the server to another system or vice versa. It helps identify network-related performance issues and optimize network configurations. High network latency may slow data transfers, increase response times, and result in poor user experience.
- Response time: Monitoring response time measures the time it takes for the server to respond to requests. It is a critical metric for assessing the overall performance of the server. High response times can indicate performance bottlenecks, such as inefficient code, database issues, or resource constraints.
How to measure server performance
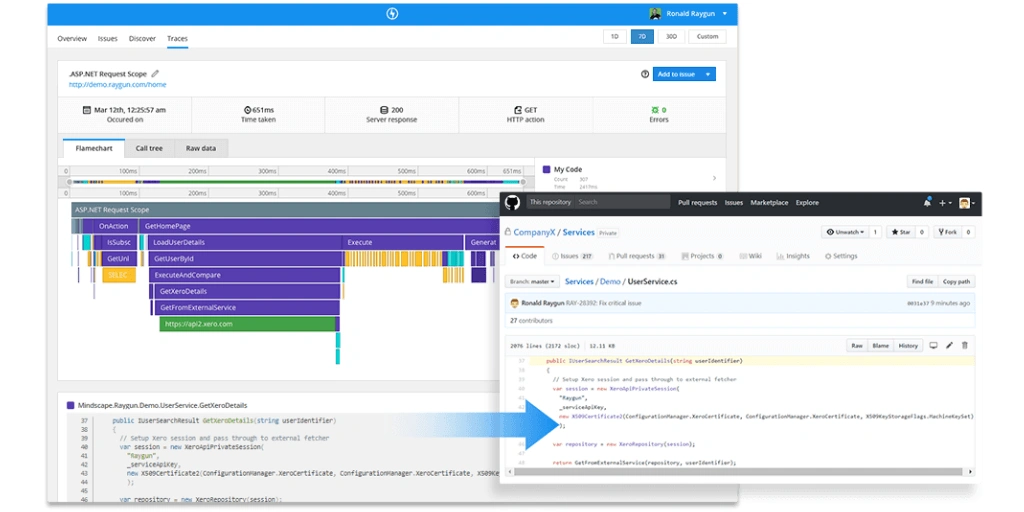
Measuring server performance with an Application Performance Monitoring (APM) tool like Raygun APM is the easiest and most accurate way of measuring the health of your software.
APM will give your team greater context into your biggest application performance by providing visualizations into metrics like requests per second and more. The following screenshot shows Raygun APM’s flamechart showing an error and its location in the code.
Keep your finger on the pulse
These are the server performance metrics we’ve found to be the most valuable. If you collect and monitor this kind of data on both your users’ experience and your app performance, very little will fall between the cracks.
If you’re not using any of the above, try them out. After all, metrics are your best way to keep your eye on your server performance—and, by extension, your application’s health.
IF you’re curious about Raygun APM, hop on a free 14-day trial, no credit card required. You’ll have full access to all Raygun products and features free during your trial period and you’ll have server-side visibility like you’ve never seen before.